Data Analytics for Small Business (2026)
You know the data is there. Buried in your Shopify dashboard, HubSpot reports, and Google Analytics is a goldmine of information that could show you exactly how to grow. The problem? Trying to get straight answers feels like digging for that gold with a plastic spoon. Waiting weeks for an analyst to build a dashboard is a relic of the past.
This guide is about turning all that raw information into a clear, actionable roadmap—without the headaches.
Key Takeaways (TL;DR)
Data analytics for small business is about getting quick, clear answers from the tools you already use.
Traditional BI tools are often too slow and complicated for busy teams. Waiting on manual reports is no longer an option.
Modern tools like Statspresso act as a Conversational AI Data Analyst, letting you ask questions in plain English.
The real benefit: Skip the SQL. Just ask your data a question and get a chart in seconds.
Your Data Is a Goldmine. Are You Digging with a Spoon?

Let's be blunt. As a founder or marketing lead, you don't have time to learn SQL or wrestle with a clunky, oversized business intelligence tool. You just need to know what’s working and what isn’t, right now.
For solo entrepreneurs, data analysis presents a unique set of challenges, often requiring a deep understanding of various tools and techniques without a dedicated analytics team. Understanding how to effectively leverage your data is crucial for making informed decisions and driving growth. To delve deeper into this, explore this comprehensive guide on how to analyze data as a solo entrepreneur, offering practical strategies tailored for independent business owners.
The frustrating cycle of exporting CSV files, trying to stitch them together in a spreadsheet, and still not having clear answers is over. Modern AI has finally made powerful analytics accessible to everyone, not just data scientists.
The New Reality of Conversational Analytics
Imagine this: instead of filing a request and waiting, you just ask a simple question in plain English and get an instant chart. That's the new reality.
A Conversational AI Data Analyst like Statspresso works like your own personal BI expert, on call 24/7. This isn't about replacing human analysts; it’s about empowering you to get immediate answers to the 90% of routine questions that slow your team down every day.
Now you can get instant clarity on questions that actually matter:
Which marketing campaigns are really driving sales?
Why did our sign-ups suddenly drop last Tuesday?
What’s our projected revenue for the next quarter?
This direct approach closes the gap between curiosity and insight. Instead of getting stuck in a data ticket queue, you just ask.
Try asking Statspresso: "Show me my monthly recurring revenue (MRR) growth over the last 12 months."
The goal isn't just to "read about a problem"—it's to connect your own database and start getting answers in seconds.
What Data Analytics Actually Means for Your Business
"Data analytics" is a term that sounds way more complicated than it is. It probably brings to mind scenes from a spy movie, with glowing screens full of code that only a genius could understand.
The reality, especially for a small business, is much simpler. Think of data analytics as a fitness tracker for your company. It keeps an eye on your vital signs—sales, marketing, customer habits—and gives you straightforward advice on how to get stronger.
The point isn't to get lost in academic theories. It's about getting clear answers to the questions that keep you up at night.
Forget the jargon. Analytics is about answering questions like:
"Who are my best, most profitable customers?"
"Why did our sales suddenly drop off last month?"
"Is that new ad campaign actually making us money?"
You don't need a PhD in statistics to get value from your data. You just need a tool that understands your questions. That's where a Conversational AI Data Analyst like Statspresso changes the game. You can skip the complex queries and coding. Just ask your data a question and get a chart in seconds.
The Four Flavors of Analytics
Data analytics isn't one big thing; it's a journey with four key stages. Each answers a different type of question, helping you build a complete picture of your business.
Descriptive Analytics (What happened?): This is your starting point—a look in the rearview mirror. It summarizes past data to tell you what has already occurred.
Example: "We generated $150,000 in total revenue last quarter."
Diagnostic Analytics (Why did it happen?): This is the detective work. Once you know what happened, you dig in to find out why. It’s about connecting the dots to find the root cause.
Example: "Sales dipped because a key Facebook ad campaign was accidentally paused."
Predictive Analytics (What will happen next?): Now we're forecasting. This stage uses historical data and trends to make an educated guess about the future.
Example: "Based on the last six months, we project next quarter’s revenue will be around $175,000."
Prescriptive Analytics (What should we do about it?): This is the most powerful stage. It doesn't just predict the future; it recommends specific actions to get the best outcome.
Example: "To hit our $175,000 goal, we should set up automated budget alerts for all major ad campaigns."
Try asking Statspresso: "Compare my revenue from new vs. returning customers this year as a stacked area chart."
With one simple question, you're instantly blending descriptive analytics (seeing the numbers) and diagnostic analytics (spotting why one group outperforms the other). That’s the magic of conversational analytics.
The AI Revolution in Small Business Analytics

So, why is data analytics for small business suddenly all the rage? The short answer: artificial intelligence. The days when you needed a six-figure budget and a dedicated data team to understand your own numbers are officially over. AI has become the great equalizer.
This isn't some futuristic fantasy; it’s a practical advantage. Industry reports project that by 2026, over 60% of small businesses will leverage AI for core operations, up from just a fraction a few years ago. This explosive growth isn't about chasing trends; it's about survival and finding a smarter way to work.
From Manual Labor to Automated Insights
Think about the old way of getting answers from your data. It was slow, frustrating, and expensive. This is where AI completely changes the game by introducing conversational analytics.
You’re no longer stuck translating your questions into code. Instead, you just ask.
Feature | The Old Way (Manual SQL) | The New Way (Statspresso) |
|---|---|---|
Getting Answers | Write complex code or wrestle with a clunky dashboard. | Ask a question in plain English. |
Time to Insight | Hours, days, or even weeks. | Seconds. |
Required Skills | You had to be a data analyst or developer. | Anyone on your team can do it. |
Cost | High software fees and specialist salaries. | Affordable, scalable monthly subscription. |
This shift means you no longer have to be a tech expert. A Conversational AI Data Analyst like Statspresso does the heavy lifting for you. All you need is curiosity. You can learn more about this automated process by reading our guide on using AI for data analysis.
How AI Unlocks Your Data’s Potential
AI doesn't just make analytics faster; it makes it smarter. It acts as a force multiplier for your team.
Finds Hidden Patterns: AI algorithms can scan millions of data points, uncovering correlations a human might miss. For example, it can pinpoint which customer segment is most likely to churn next month.
Puts Data in Everyone's Hands: By removing technical roadblocks, everyone from marketing to operations can find their own answers. This is the essence of automated BI.
Drives Proactive Decisions: Instead of just reporting on what already happened, modern AI tools help forecast trends, giving you a valuable heads-up on future opportunities or risks.
This new wave of GenBI is also helping small businesses generate powerful AI-driven marketing insights, turning raw campaign data into a clear roadmap for growth.
Try asking Statspresso: "What is the lifetime value of customers acquired from Google Ads versus Facebook Ads?"
With a tool like Statspresso, you skip the code and get a chart in seconds. This is a fundamental change in how you can operate, letting you move at the speed of your questions.
High-Impact Analytics Projects You Can Start Today
Let's move from theory to reality. The whole point of digging into your business data is to make more money, save time, and keep your customers happy. You shouldn't have to wait weeks for a report to get those answers.
Here are a few high-value projects you can tackle right away, just by asking the right questions.
Find Your Most Profitable Marketing Channels
You're putting money into Google Ads, running campaigns on Facebook, and dabbling in content marketing. But which efforts are actually bringing in cash? Marketing spend can feel like a black box.
Instead of trying to stitch together five different spreadsheets, connect your advertising costs directly to your sales figures to see your true Return on Ad Spend (ROAS). This is the magic number that tells you how many dollars you earn for every dollar you spend.
This used to be a massive undertaking. Now, with a Conversational AI Data Analyst, you can get the answer in plain English. For example, with Statspresso, you just connect your data and ask.
Try asking Statspresso: "Compare my marketing spend vs. revenue by channel for the last quarter as a combo chart."
A simple question like that gives you an immediate, visual breakdown of which channels are your winners and which are draining your budget.
Understand and Reduce Customer Churn
It’s an old saying because it’s true: acquiring a new customer is anywhere from 5 to 25 times more expensive than keeping an existing one. Despite this, many small businesses are flying blind when it comes to understanding why customers leave.
Guesswork won't get you far. Use your data to find the "why" behind your churn rate. By analyzing the behavior of customers who left compared to those who stayed, you can identify the specific triggers that cause people to cancel.
For instance, you might discover that customers who don’t use a key feature within their first week are 80% more likely to churn. These are the patterns that are almost impossible to see without looking at the data.
Try asking Statspresso: "Show me the churn rate by customer subscription plan over the last six months."
Armed with this information, you can stop reacting to churn and start preventing it. You don't need to know SQL; you just need to ask the right questions.
Optimize Your Sales Funnel
Every business has a sales funnel—the path someone takes from being a curious visitor to a paying customer. The million-dollar question is, where are the leaks? Are people dropping off at the sign-up page? Do they get stuck during the trial? Or do they abandon their cart at the last second?
Fixing these bottlenecks is one of the fastest ways to grow revenue. By tracking how many people move from one step to the next, you can quickly spot the problem areas:
Website Visit to Sign-up: High drop-off? Your landing page messaging might be off.
Sign-up to Trial Activation: Users signing up but never starting? Your first email could be the culprit.
Trial to Paid Conversion: Low conversion? Maybe your pricing is confusing or a killer feature is too hard to find.
These aren't just abstract numbers; they're a clear roadmap telling you exactly where to focus.
Try asking Statspresso: "What is the conversion rate from trial to paid subscription, broken down by acquisition source?"
An analysis like this gives your team a data-backed to-do list. Just connect your customer and sales data to start plugging those leaks today.
Choosing Your Analytics Toolkit: The Old Way vs. The New Way
When it’s time to pick tools for data analytics, you're facing a fundamental choice. One path is the traditional route—powerful, but notoriously slow and complicated. The other is a newer, faster, and far more intuitive approach. The path you take will determine how quickly you can turn numbers into decisions.
A Tale of Two Toolkits
The old way of business intelligence (BI) was built for a different era. It was designed for massive companies with teams of data analysts fluent in SQL and platforms like Tableau or Microsoft Power BI. For a small business, this old-school process is full of bottlenecks.
The new way changes the game. Modern tools like Statspresso work as a Conversational AI Data Analyst, making data exploration feel as simple as asking a colleague a question. You don't file a ticket; you just ask. Skip the SQL. Just ask your data a question and get a chart in seconds. This approach gives everyone on your team direct access to answers.
Data Analytics: The Old Way vs. The New Way
Feature | The Old Way (Manual SQL & BI Tools) | The New Way (Statspresso) |
|---|---|---|
How You Get Answers | Submit a request to an analyst or wrestle with a complex dashboard builder. | Ask a question in plain English, like "What were my top 5 selling products last month?" |
Time to Insight | Hours, days, or even weeks depending on analyst availability. | Seconds. You get an immediate chart or number. |
Required Skills | Deep technical expertise in SQL, data modeling, and specific BI software. | Curiosity. If you can ask a question, you can get an answer. |
Who Can Use It | Only data specialists, creating a significant bottleneck for the rest of the team. | Anyone—founders, marketers, product managers, and support leads. |
Typical Cost | High licensing fees plus the cost of hiring and retaining specialized talent. | An affordable, predictable monthly subscription that scales with your business. |
The contrast is stark. While legacy tools still have a place, the "new way" offers the fastest path to answers for over 90% of your daily business questions.
The Real-World ROI of Conversational Analytics
This isn't just about saving time; it's about a measurable return on investment. The productivity bump from AI-powered analytics is huge. As detailed in a recent report on small business AI adoption, businesses using these tools report significant savings. The data shows 58% save more than 20 hours a month, and 66% save between $500-$2,000 monthly. Those hours and dollars add up fast.
This infographic breaks down some high-value areas where you can put analytics to work.
By pointing a conversational AI tool at your data, you can uncover opportunities that improve your bottom line. It’s also a great way to move beyond generic reports by building custom SEO dashboards that tie your specific activities to business goals.
Try asking Statspresso: "What is the average time between a customer's first and second purchase?"
In the past, answering that would have meant hours in spreadsheets. Now, it's a simple query that delivers a critical insight in moments.
Your Roadmap to Becoming a Data-Driven Business
So, you're sold on using data analytics for your small business. But where do you begin? Don't get intimidated by launching a massive "data strategy." Becoming data-driven isn't about buying a tool; it's about building a habit of curiosity. This simple roadmap shows you how.
Step 1: Pinpoint Your Core Business Questions
First things first: resist the urge to analyze everything at once. That's a path to paralysis. Start small and stay focused.
Identify just one to three burning questions that would genuinely move the needle for your business.
Marketing: "Which of our ad campaigns has the best return on ad spend (ROAS)?"
Sales: "How many days does it take for a new lead to become a paying customer?"
Operations: "What are our top 3 most-returned products, and why?"
Picking a few high-impact questions creates a clear target.
Step 2: Connect Your Key Data Sources
Now, let’s figure out where the answers are hiding. Most small businesses have their data spread across a handful of platforms. Just start with the one or two systems that hold the most valuable information. For most companies, that means connecting:
Your ecommerce platform (like Shopify)
Your web analytics tool (like Google Analytics)
Your CRM or marketing tool (like HubSpot)
This is where a Conversational AI Data Analyst like Statspresso makes a huge difference. You simply authorize access, and the platform does the heavy lifting of connecting the dots.
Step 3: Ask, Explore, and Validate
With your data connected, it's time for the fun part: start asking those questions. Type your question in plain English and see what the data says.
Try asking Statspresso: "Show me my revenue by month for the last year as a bar chart."
But don't stop at the first answer. Let curiosity lead the way. If a chart reveals a revenue spike in May, ask a follow-up: "What were my top traffic sources in May?" This ability to immediately drill down is what makes modern analytics so powerful. Skip the SQL. Just ask your data a question and get a chart in seconds.
Step 4: Create a Central Dashboard
As you uncover useful charts, save your most important visuals to a central dashboard. Think of it as your business's "mission control"—a single place your team can look to for the truth. This isn’t about building some overwhelming, complicated dashboard. It’s about curating a handful of key metrics that show you the health of your business at a glance.
Step 5: Schedule a Weekly Metrics Huddle
Finally, turn data into a team ritual. A dashboard is worthless if no one looks at it. Put a short, 15-minute weekly huddle on the calendar to review your main metrics as a team. This isn't a long presentation. It's a quick discussion: What went right last week? What looks off? What's our focus for this week? When data becomes part of your weekly conversation, you build a culture where decisions are backed by evidence, not just gut feelings.
Answering Your Top Questions About Small Business Data Analytics
It's normal to have questions before diving into the world of data. Let's walk through some of the most common concerns we hear from small business owners and get you straightforward answers.
Is My Business Too Small for Data Analytics?
This is the biggest hesitation we see, and the short answer is: no. You wouldn't say your business is too small to check its bank account. Data is just another form of essential feedback. Even if you've only made your first sale, you have data. That single sale tells a story. The sooner you start paying attention to early signals, the faster you can spot what’s working.
Do I Need to Hire a Data Analyst to Use These Tools?
Not anymore. The old way absolutely required a specialist who could write SQL. That put data out of reach for most small businesses. Modern tools are built for the rest of us—the busy founders, marketers, and managers who have questions but no time to become data wizards.
This is exactly why a Conversational AI Data Analyst like Statspresso exists. They are designed for people without a technical background. If you can ask a question in plain English, you can get a chart in seconds. You bring the business knowledge; the AI does the heavy lifting.
How Secure Is Connecting My Business Data to an AI Platform?
This is a critical question. Handing over access to your business data is a big deal, and any reputable analytics company treats security as its top priority.
Legitimate platforms use a multi-layered defense system. Look for these key indicators:
SOC 2 Compliance: A tough, independent audit that confirms a company follows strict security policies.
End-to-End Encryption: Your data is scrambled and protected both in transit and at rest.
Read-Only Access: Most modern tools connect to your databases with "read-only" permissions. They can view your data to analyze it, but they have no ability to change, edit, or delete your original records.
Always check a platform's security page. A company that values your trust will be transparent about how they protect you.
What’s the Difference Between This and My Shopify Dashboard?
Your Shopify, Google Analytics, or HubSpot dashboards are great for what they do. They give you a snapshot of what's happening inside that one specific tool. The problem is, they don't talk to each other. Your Shopify dashboard can't tell you which Facebook ad brought in your most valuable customers.
True data analytics for small business happens when you bring those separate pieces together. An analytics platform like Statspresso connects to all these different sources, blending the data into a single, unified view. It’s the difference between looking at a single puzzle piece and finally seeing the complete picture.
Ready to stop guessing and start knowing? Statspresso is your on-demand data analyst. Connect your first data source for free and ask your first question to see how easy it is to get clear answers in seconds.
You know the data is there. Buried in your Shopify dashboard, HubSpot reports, and Google Analytics is a goldmine of information that could show you exactly how to grow. The problem? Trying to get straight answers feels like digging for that gold with a plastic spoon. Waiting weeks for an analyst to build a dashboard is a relic of the past.
This guide is about turning all that raw information into a clear, actionable roadmap—without the headaches.
Key Takeaways (TL;DR)
Data analytics for small business is about getting quick, clear answers from the tools you already use.
Traditional BI tools are often too slow and complicated for busy teams. Waiting on manual reports is no longer an option.
Modern tools like Statspresso act as a Conversational AI Data Analyst, letting you ask questions in plain English.
The real benefit: Skip the SQL. Just ask your data a question and get a chart in seconds.
Your Data Is a Goldmine. Are You Digging with a Spoon?
Let's be blunt. As a founder or marketing lead, you don't have time to learn SQL or wrestle with a clunky, oversized business intelligence tool. You just need to know what’s working and what isn’t, right now.
For solo entrepreneurs, data analysis presents a unique set of challenges, often requiring a deep understanding of various tools and techniques without a dedicated analytics team. Understanding how to effectively leverage your data is crucial for making informed decisions and driving growth. To delve deeper into this, explore this comprehensive guide on how to analyze data as a solo entrepreneur, offering practical strategies tailored for independent business owners.
The frustrating cycle of exporting CSV files, trying to stitch them together in a spreadsheet, and still not having clear answers is over. Modern AI has finally made powerful analytics accessible to everyone, not just data scientists.
The New Reality of Conversational Analytics
Imagine this: instead of filing a request and waiting, you just ask a simple question in plain English and get an instant chart. That's the new reality.
A Conversational AI Data Analyst like Statspresso works like your own personal BI expert, on call 24/7. This isn't about replacing human analysts; it’s about empowering you to get immediate answers to the 90% of routine questions that slow your team down every day.
Now you can get instant clarity on questions that actually matter:
Which marketing campaigns are really driving sales?
Why did our sign-ups suddenly drop last Tuesday?
What’s our projected revenue for the next quarter?
This direct approach closes the gap between curiosity and insight. Instead of getting stuck in a data ticket queue, you just ask.
Try asking Statspresso: "Show me my monthly recurring revenue (MRR) growth over the last 12 months."
The goal isn't just to "read about a problem"—it's to connect your own database and start getting answers in seconds.
What Data Analytics Actually Means for Your Business
"Data analytics" is a term that sounds way more complicated than it is. It probably brings to mind scenes from a spy movie, with glowing screens full of code that only a genius could understand.
The reality, especially for a small business, is much simpler. Think of data analytics as a fitness tracker for your company. It keeps an eye on your vital signs—sales, marketing, customer habits—and gives you straightforward advice on how to get stronger.
The point isn't to get lost in academic theories. It's about getting clear answers to the questions that keep you up at night.
Forget the jargon. Analytics is about answering questions like:
"Who are my best, most profitable customers?"
"Why did our sales suddenly drop off last month?"
"Is that new ad campaign actually making us money?"
You don't need a PhD in statistics to get value from your data. You just need a tool that understands your questions. That's where a Conversational AI Data Analyst like Statspresso changes the game. You can skip the complex queries and coding. Just ask your data a question and get a chart in seconds.
The Four Flavors of Analytics
Data analytics isn't one big thing; it's a journey with four key stages. Each answers a different type of question, helping you build a complete picture of your business.
Descriptive Analytics (What happened?): This is your starting point—a look in the rearview mirror. It summarizes past data to tell you what has already occurred.
Example: "We generated $150,000 in total revenue last quarter."
Diagnostic Analytics (Why did it happen?): This is the detective work. Once you know what happened, you dig in to find out why. It’s about connecting the dots to find the root cause.
Example: "Sales dipped because a key Facebook ad campaign was accidentally paused."
Predictive Analytics (What will happen next?): Now we're forecasting. This stage uses historical data and trends to make an educated guess about the future.
Example: "Based on the last six months, we project next quarter’s revenue will be around $175,000."
Prescriptive Analytics (What should we do about it?): This is the most powerful stage. It doesn't just predict the future; it recommends specific actions to get the best outcome.
Example: "To hit our $175,000 goal, we should set up automated budget alerts for all major ad campaigns."
Try asking Statspresso: "Compare my revenue from new vs. returning customers this year as a stacked area chart."
With one simple question, you're instantly blending descriptive analytics (seeing the numbers) and diagnostic analytics (spotting why one group outperforms the other). That’s the magic of conversational analytics.
The AI Revolution in Small Business Analytics
So, why is data analytics for small business suddenly all the rage? The short answer: artificial intelligence. The days when you needed a six-figure budget and a dedicated data team to understand your own numbers are officially over. AI has become the great equalizer.
This isn't some futuristic fantasy; it’s a practical advantage. Industry reports project that by 2026, over 60% of small businesses will leverage AI for core operations, up from just a fraction a few years ago. This explosive growth isn't about chasing trends; it's about survival and finding a smarter way to work.
From Manual Labor to Automated Insights
Think about the old way of getting answers from your data. It was slow, frustrating, and expensive. This is where AI completely changes the game by introducing conversational analytics.
You’re no longer stuck translating your questions into code. Instead, you just ask.
Feature | The Old Way (Manual SQL) | The New Way (Statspresso) |
|---|---|---|
Getting Answers | Write complex code or wrestle with a clunky dashboard. | Ask a question in plain English. |
Time to Insight | Hours, days, or even weeks. | Seconds. |
Required Skills | You had to be a data analyst or developer. | Anyone on your team can do it. |
Cost | High software fees and specialist salaries. | Affordable, scalable monthly subscription. |
This shift means you no longer have to be a tech expert. A Conversational AI Data Analyst like Statspresso does the heavy lifting for you. All you need is curiosity. You can learn more about this automated process by reading our guide on using AI for data analysis.
How AI Unlocks Your Data’s Potential
AI doesn't just make analytics faster; it makes it smarter. It acts as a force multiplier for your team.
Finds Hidden Patterns: AI algorithms can scan millions of data points, uncovering correlations a human might miss. For example, it can pinpoint which customer segment is most likely to churn next month.
Puts Data in Everyone's Hands: By removing technical roadblocks, everyone from marketing to operations can find their own answers. This is the essence of automated BI.
Drives Proactive Decisions: Instead of just reporting on what already happened, modern AI tools help forecast trends, giving you a valuable heads-up on future opportunities or risks.
This new wave of GenBI is also helping small businesses generate powerful AI-driven marketing insights, turning raw campaign data into a clear roadmap for growth.
Try asking Statspresso: "What is the lifetime value of customers acquired from Google Ads versus Facebook Ads?"
With a tool like Statspresso, you skip the code and get a chart in seconds. This is a fundamental change in how you can operate, letting you move at the speed of your questions.
High-Impact Analytics Projects You Can Start Today
Let's move from theory to reality. The whole point of digging into your business data is to make more money, save time, and keep your customers happy. You shouldn't have to wait weeks for a report to get those answers.
Here are a few high-value projects you can tackle right away, just by asking the right questions.
Find Your Most Profitable Marketing Channels
You're putting money into Google Ads, running campaigns on Facebook, and dabbling in content marketing. But which efforts are actually bringing in cash? Marketing spend can feel like a black box.
Instead of trying to stitch together five different spreadsheets, connect your advertising costs directly to your sales figures to see your true Return on Ad Spend (ROAS). This is the magic number that tells you how many dollars you earn for every dollar you spend.
This used to be a massive undertaking. Now, with a Conversational AI Data Analyst, you can get the answer in plain English. For example, with Statspresso, you just connect your data and ask.
Try asking Statspresso: "Compare my marketing spend vs. revenue by channel for the last quarter as a combo chart."
A simple question like that gives you an immediate, visual breakdown of which channels are your winners and which are draining your budget.
Understand and Reduce Customer Churn
It’s an old saying because it’s true: acquiring a new customer is anywhere from 5 to 25 times more expensive than keeping an existing one. Despite this, many small businesses are flying blind when it comes to understanding why customers leave.
Guesswork won't get you far. Use your data to find the "why" behind your churn rate. By analyzing the behavior of customers who left compared to those who stayed, you can identify the specific triggers that cause people to cancel.
For instance, you might discover that customers who don’t use a key feature within their first week are 80% more likely to churn. These are the patterns that are almost impossible to see without looking at the data.
Try asking Statspresso: "Show me the churn rate by customer subscription plan over the last six months."
Armed with this information, you can stop reacting to churn and start preventing it. You don't need to know SQL; you just need to ask the right questions.
Optimize Your Sales Funnel
Every business has a sales funnel—the path someone takes from being a curious visitor to a paying customer. The million-dollar question is, where are the leaks? Are people dropping off at the sign-up page? Do they get stuck during the trial? Or do they abandon their cart at the last second?
Fixing these bottlenecks is one of the fastest ways to grow revenue. By tracking how many people move from one step to the next, you can quickly spot the problem areas:
Website Visit to Sign-up: High drop-off? Your landing page messaging might be off.
Sign-up to Trial Activation: Users signing up but never starting? Your first email could be the culprit.
Trial to Paid Conversion: Low conversion? Maybe your pricing is confusing or a killer feature is too hard to find.
These aren't just abstract numbers; they're a clear roadmap telling you exactly where to focus.
Try asking Statspresso: "What is the conversion rate from trial to paid subscription, broken down by acquisition source?"
An analysis like this gives your team a data-backed to-do list. Just connect your customer and sales data to start plugging those leaks today.
Choosing Your Analytics Toolkit: The Old Way vs. The New Way
When it’s time to pick tools for data analytics, you're facing a fundamental choice. One path is the traditional route—powerful, but notoriously slow and complicated. The other is a newer, faster, and far more intuitive approach. The path you take will determine how quickly you can turn numbers into decisions.
A Tale of Two Toolkits
The old way of business intelligence (BI) was built for a different era. It was designed for massive companies with teams of data analysts fluent in SQL and platforms like Tableau or Microsoft Power BI. For a small business, this old-school process is full of bottlenecks.
The new way changes the game. Modern tools like Statspresso work as a Conversational AI Data Analyst, making data exploration feel as simple as asking a colleague a question. You don't file a ticket; you just ask. Skip the SQL. Just ask your data a question and get a chart in seconds. This approach gives everyone on your team direct access to answers.
Data Analytics: The Old Way vs. The New Way
Feature | The Old Way (Manual SQL & BI Tools) | The New Way (Statspresso) |
|---|---|---|
How You Get Answers | Submit a request to an analyst or wrestle with a complex dashboard builder. | Ask a question in plain English, like "What were my top 5 selling products last month?" |
Time to Insight | Hours, days, or even weeks depending on analyst availability. | Seconds. You get an immediate chart or number. |
Required Skills | Deep technical expertise in SQL, data modeling, and specific BI software. | Curiosity. If you can ask a question, you can get an answer. |
Who Can Use It | Only data specialists, creating a significant bottleneck for the rest of the team. | Anyone—founders, marketers, product managers, and support leads. |
Typical Cost | High licensing fees plus the cost of hiring and retaining specialized talent. | An affordable, predictable monthly subscription that scales with your business. |
The contrast is stark. While legacy tools still have a place, the "new way" offers the fastest path to answers for over 90% of your daily business questions.
The Real-World ROI of Conversational Analytics
This isn't just about saving time; it's about a measurable return on investment. The productivity bump from AI-powered analytics is huge. As detailed in a recent report on small business AI adoption, businesses using these tools report significant savings. The data shows 58% save more than 20 hours a month, and 66% save between $500-$2,000 monthly. Those hours and dollars add up fast.
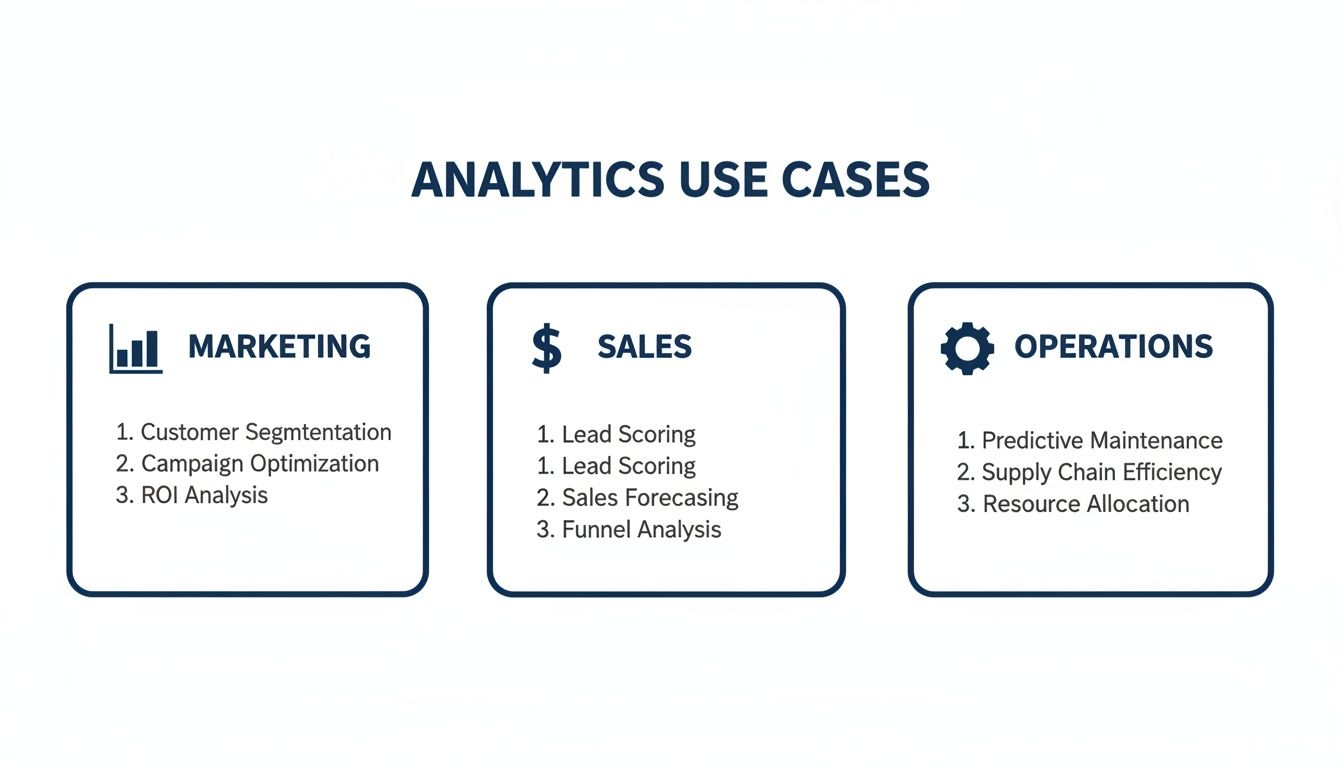
This infographic breaks down some high-value areas where you can put analytics to work.
By pointing a conversational AI tool at your data, you can uncover opportunities that improve your bottom line. It’s also a great way to move beyond generic reports by building custom SEO dashboards that tie your specific activities to business goals.
Try asking Statspresso: "What is the average time between a customer's first and second purchase?"
In the past, answering that would have meant hours in spreadsheets. Now, it's a simple query that delivers a critical insight in moments.
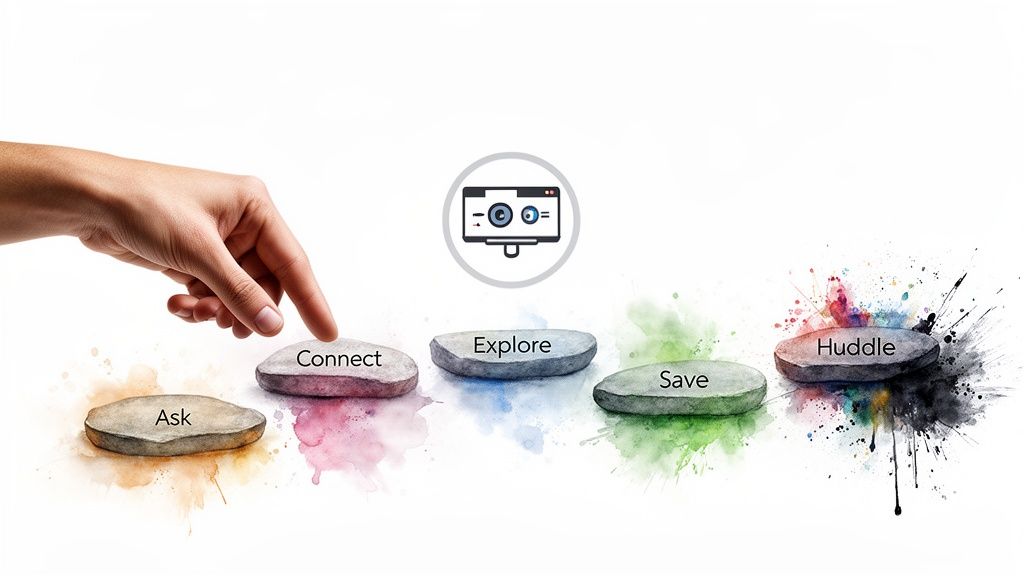
Your Roadmap to Becoming a Data-Driven Business
So, you're sold on using data analytics for your small business. But where do you begin? Don't get intimidated by launching a massive "data strategy." Becoming data-driven isn't about buying a tool; it's about building a habit of curiosity. This simple roadmap shows you how.
Step 1: Pinpoint Your Core Business Questions
First things first: resist the urge to analyze everything at once. That's a path to paralysis. Start small and stay focused.
Identify just one to three burning questions that would genuinely move the needle for your business.
Marketing: "Which of our ad campaigns has the best return on ad spend (ROAS)?"
Sales: "How many days does it take for a new lead to become a paying customer?"
Operations: "What are our top 3 most-returned products, and why?"
Picking a few high-impact questions creates a clear target.
Step 2: Connect Your Key Data Sources
Now, let’s figure out where the answers are hiding. Most small businesses have their data spread across a handful of platforms. Just start with the one or two systems that hold the most valuable information. For most companies, that means connecting:
Your ecommerce platform (like Shopify)
Your web analytics tool (like Google Analytics)
Your CRM or marketing tool (like HubSpot)
This is where a Conversational AI Data Analyst like Statspresso makes a huge difference. You simply authorize access, and the platform does the heavy lifting of connecting the dots.
Step 3: Ask, Explore, and Validate
With your data connected, it's time for the fun part: start asking those questions. Type your question in plain English and see what the data says.
Try asking Statspresso: "Show me my revenue by month for the last year as a bar chart."
But don't stop at the first answer. Let curiosity lead the way. If a chart reveals a revenue spike in May, ask a follow-up: "What were my top traffic sources in May?" This ability to immediately drill down is what makes modern analytics so powerful. Skip the SQL. Just ask your data a question and get a chart in seconds.
Step 4: Create a Central Dashboard
As you uncover useful charts, save your most important visuals to a central dashboard. Think of it as your business's "mission control"—a single place your team can look to for the truth. This isn’t about building some overwhelming, complicated dashboard. It’s about curating a handful of key metrics that show you the health of your business at a glance.
Step 5: Schedule a Weekly Metrics Huddle
Finally, turn data into a team ritual. A dashboard is worthless if no one looks at it. Put a short, 15-minute weekly huddle on the calendar to review your main metrics as a team. This isn't a long presentation. It's a quick discussion: What went right last week? What looks off? What's our focus for this week? When data becomes part of your weekly conversation, you build a culture where decisions are backed by evidence, not just gut feelings.
Answering Your Top Questions About Small Business Data Analytics
It's normal to have questions before diving into the world of data. Let's walk through some of the most common concerns we hear from small business owners and get you straightforward answers.
Is My Business Too Small for Data Analytics?
This is the biggest hesitation we see, and the short answer is: no. You wouldn't say your business is too small to check its bank account. Data is just another form of essential feedback. Even if you've only made your first sale, you have data. That single sale tells a story. The sooner you start paying attention to early signals, the faster you can spot what’s working.
Do I Need to Hire a Data Analyst to Use These Tools?
Not anymore. The old way absolutely required a specialist who could write SQL. That put data out of reach for most small businesses. Modern tools are built for the rest of us—the busy founders, marketers, and managers who have questions but no time to become data wizards.
This is exactly why a Conversational AI Data Analyst like Statspresso exists. They are designed for people without a technical background. If you can ask a question in plain English, you can get a chart in seconds. You bring the business knowledge; the AI does the heavy lifting.
How Secure Is Connecting My Business Data to an AI Platform?
This is a critical question. Handing over access to your business data is a big deal, and any reputable analytics company treats security as its top priority.
Legitimate platforms use a multi-layered defense system. Look for these key indicators:
SOC 2 Compliance: A tough, independent audit that confirms a company follows strict security policies.
End-to-End Encryption: Your data is scrambled and protected both in transit and at rest.
Read-Only Access: Most modern tools connect to your databases with "read-only" permissions. They can view your data to analyze it, but they have no ability to change, edit, or delete your original records.
Always check a platform's security page. A company that values your trust will be transparent about how they protect you.
What’s the Difference Between This and My Shopify Dashboard?
Your Shopify, Google Analytics, or HubSpot dashboards are great for what they do. They give you a snapshot of what's happening inside that one specific tool. The problem is, they don't talk to each other. Your Shopify dashboard can't tell you which Facebook ad brought in your most valuable customers.
True data analytics for small business happens when you bring those separate pieces together. An analytics platform like Statspresso connects to all these different sources, blending the data into a single, unified view. It’s the difference between looking at a single puzzle piece and finally seeing the complete picture.
Ready to stop guessing and start knowing? Statspresso is your on-demand data analyst. Connect your first data source for free and ask your first question to see how easy it is to get clear answers in seconds.
You know the data is there. Buried in your Shopify dashboard, HubSpot reports, and Google Analytics is a goldmine of information that could show you exactly how to grow. The problem? Trying to get straight answers feels like digging for that gold with a plastic spoon. Waiting weeks for an analyst to build a dashboard is a relic of the past.
This guide is about turning all that raw information into a clear, actionable roadmap—without the headaches.
Key Takeaways (TL;DR)
Data analytics for small business is about getting quick, clear answers from the tools you already use.
Traditional BI tools are often too slow and complicated for busy teams. Waiting on manual reports is no longer an option.
Modern tools like Statspresso act as a Conversational AI Data Analyst, letting you ask questions in plain English.
The real benefit: Skip the SQL. Just ask your data a question and get a chart in seconds.
Your Data Is a Goldmine. Are You Digging with a Spoon?
Let's be blunt. As a founder or marketing lead, you don't have time to learn SQL or wrestle with a clunky, oversized business intelligence tool. You just need to know what’s working and what isn’t, right now.
For solo entrepreneurs, data analysis presents a unique set of challenges, often requiring a deep understanding of various tools and techniques without a dedicated analytics team. Understanding how to effectively leverage your data is crucial for making informed decisions and driving growth. To delve deeper into this, explore this comprehensive guide on how to analyze data as a solo entrepreneur, offering practical strategies tailored for independent business owners.
The frustrating cycle of exporting CSV files, trying to stitch them together in a spreadsheet, and still not having clear answers is over. Modern AI has finally made powerful analytics accessible to everyone, not just data scientists.
The New Reality of Conversational Analytics
Imagine this: instead of filing a request and waiting, you just ask a simple question in plain English and get an instant chart. That's the new reality.
A Conversational AI Data Analyst like Statspresso works like your own personal BI expert, on call 24/7. This isn't about replacing human analysts; it’s about empowering you to get immediate answers to the 90% of routine questions that slow your team down every day.
Now you can get instant clarity on questions that actually matter:
Which marketing campaigns are really driving sales?
Why did our sign-ups suddenly drop last Tuesday?
What’s our projected revenue for the next quarter?
This direct approach closes the gap between curiosity and insight. Instead of getting stuck in a data ticket queue, you just ask.
Try asking Statspresso: "Show me my monthly recurring revenue (MRR) growth over the last 12 months."
The goal isn't just to "read about a problem"—it's to connect your own database and start getting answers in seconds.
What Data Analytics Actually Means for Your Business
"Data analytics" is a term that sounds way more complicated than it is. It probably brings to mind scenes from a spy movie, with glowing screens full of code that only a genius could understand.
The reality, especially for a small business, is much simpler. Think of data analytics as a fitness tracker for your company. It keeps an eye on your vital signs—sales, marketing, customer habits—and gives you straightforward advice on how to get stronger.
The point isn't to get lost in academic theories. It's about getting clear answers to the questions that keep you up at night.
Forget the jargon. Analytics is about answering questions like:
"Who are my best, most profitable customers?"
"Why did our sales suddenly drop off last month?"
"Is that new ad campaign actually making us money?"
You don't need a PhD in statistics to get value from your data. You just need a tool that understands your questions. That's where a Conversational AI Data Analyst like Statspresso changes the game. You can skip the complex queries and coding. Just ask your data a question and get a chart in seconds.
The Four Flavors of Analytics
Data analytics isn't one big thing; it's a journey with four key stages. Each answers a different type of question, helping you build a complete picture of your business.
Descriptive Analytics (What happened?): This is your starting point—a look in the rearview mirror. It summarizes past data to tell you what has already occurred.
Example: "We generated $150,000 in total revenue last quarter."
Diagnostic Analytics (Why did it happen?): This is the detective work. Once you know what happened, you dig in to find out why. It’s about connecting the dots to find the root cause.
Example: "Sales dipped because a key Facebook ad campaign was accidentally paused."
Predictive Analytics (What will happen next?): Now we're forecasting. This stage uses historical data and trends to make an educated guess about the future.
Example: "Based on the last six months, we project next quarter’s revenue will be around $175,000."
Prescriptive Analytics (What should we do about it?): This is the most powerful stage. It doesn't just predict the future; it recommends specific actions to get the best outcome.
Example: "To hit our $175,000 goal, we should set up automated budget alerts for all major ad campaigns."
Try asking Statspresso: "Compare my revenue from new vs. returning customers this year as a stacked area chart."
With one simple question, you're instantly blending descriptive analytics (seeing the numbers) and diagnostic analytics (spotting why one group outperforms the other). That’s the magic of conversational analytics.
The AI Revolution in Small Business Analytics
So, why is data analytics for small business suddenly all the rage? The short answer: artificial intelligence. The days when you needed a six-figure budget and a dedicated data team to understand your own numbers are officially over. AI has become the great equalizer.
This isn't some futuristic fantasy; it’s a practical advantage. Industry reports project that by 2026, over 60% of small businesses will leverage AI for core operations, up from just a fraction a few years ago. This explosive growth isn't about chasing trends; it's about survival and finding a smarter way to work.
From Manual Labor to Automated Insights
Think about the old way of getting answers from your data. It was slow, frustrating, and expensive. This is where AI completely changes the game by introducing conversational analytics.
You’re no longer stuck translating your questions into code. Instead, you just ask.
Feature | The Old Way (Manual SQL) | The New Way (Statspresso) |
|---|---|---|
Getting Answers | Write complex code or wrestle with a clunky dashboard. | Ask a question in plain English. |
Time to Insight | Hours, days, or even weeks. | Seconds. |
Required Skills | You had to be a data analyst or developer. | Anyone on your team can do it. |
Cost | High software fees and specialist salaries. | Affordable, scalable monthly subscription. |
This shift means you no longer have to be a tech expert. A Conversational AI Data Analyst like Statspresso does the heavy lifting for you. All you need is curiosity. You can learn more about this automated process by reading our guide on using AI for data analysis.
How AI Unlocks Your Data’s Potential
AI doesn't just make analytics faster; it makes it smarter. It acts as a force multiplier for your team.
Finds Hidden Patterns: AI algorithms can scan millions of data points, uncovering correlations a human might miss. For example, it can pinpoint which customer segment is most likely to churn next month.
Puts Data in Everyone's Hands: By removing technical roadblocks, everyone from marketing to operations can find their own answers. This is the essence of automated BI.
Drives Proactive Decisions: Instead of just reporting on what already happened, modern AI tools help forecast trends, giving you a valuable heads-up on future opportunities or risks.
This new wave of GenBI is also helping small businesses generate powerful AI-driven marketing insights, turning raw campaign data into a clear roadmap for growth.
Try asking Statspresso: "What is the lifetime value of customers acquired from Google Ads versus Facebook Ads?"
With a tool like Statspresso, you skip the code and get a chart in seconds. This is a fundamental change in how you can operate, letting you move at the speed of your questions.
High-Impact Analytics Projects You Can Start Today
Let's move from theory to reality. The whole point of digging into your business data is to make more money, save time, and keep your customers happy. You shouldn't have to wait weeks for a report to get those answers.
Here are a few high-value projects you can tackle right away, just by asking the right questions.
Find Your Most Profitable Marketing Channels
You're putting money into Google Ads, running campaigns on Facebook, and dabbling in content marketing. But which efforts are actually bringing in cash? Marketing spend can feel like a black box.
Instead of trying to stitch together five different spreadsheets, connect your advertising costs directly to your sales figures to see your true Return on Ad Spend (ROAS). This is the magic number that tells you how many dollars you earn for every dollar you spend.
This used to be a massive undertaking. Now, with a Conversational AI Data Analyst, you can get the answer in plain English. For example, with Statspresso, you just connect your data and ask.
Try asking Statspresso: "Compare my marketing spend vs. revenue by channel for the last quarter as a combo chart."
A simple question like that gives you an immediate, visual breakdown of which channels are your winners and which are draining your budget.
Understand and Reduce Customer Churn
It’s an old saying because it’s true: acquiring a new customer is anywhere from 5 to 25 times more expensive than keeping an existing one. Despite this, many small businesses are flying blind when it comes to understanding why customers leave.
Guesswork won't get you far. Use your data to find the "why" behind your churn rate. By analyzing the behavior of customers who left compared to those who stayed, you can identify the specific triggers that cause people to cancel.
For instance, you might discover that customers who don’t use a key feature within their first week are 80% more likely to churn. These are the patterns that are almost impossible to see without looking at the data.
Try asking Statspresso: "Show me the churn rate by customer subscription plan over the last six months."
Armed with this information, you can stop reacting to churn and start preventing it. You don't need to know SQL; you just need to ask the right questions.
Optimize Your Sales Funnel
Every business has a sales funnel—the path someone takes from being a curious visitor to a paying customer. The million-dollar question is, where are the leaks? Are people dropping off at the sign-up page? Do they get stuck during the trial? Or do they abandon their cart at the last second?
Fixing these bottlenecks is one of the fastest ways to grow revenue. By tracking how many people move from one step to the next, you can quickly spot the problem areas:
Website Visit to Sign-up: High drop-off? Your landing page messaging might be off.
Sign-up to Trial Activation: Users signing up but never starting? Your first email could be the culprit.
Trial to Paid Conversion: Low conversion? Maybe your pricing is confusing or a killer feature is too hard to find.
These aren't just abstract numbers; they're a clear roadmap telling you exactly where to focus.
Try asking Statspresso: "What is the conversion rate from trial to paid subscription, broken down by acquisition source?"
An analysis like this gives your team a data-backed to-do list. Just connect your customer and sales data to start plugging those leaks today.
Choosing Your Analytics Toolkit: The Old Way vs. The New Way
When it’s time to pick tools for data analytics, you're facing a fundamental choice. One path is the traditional route—powerful, but notoriously slow and complicated. The other is a newer, faster, and far more intuitive approach. The path you take will determine how quickly you can turn numbers into decisions.
A Tale of Two Toolkits
The old way of business intelligence (BI) was built for a different era. It was designed for massive companies with teams of data analysts fluent in SQL and platforms like Tableau or Microsoft Power BI. For a small business, this old-school process is full of bottlenecks.
The new way changes the game. Modern tools like Statspresso work as a Conversational AI Data Analyst, making data exploration feel as simple as asking a colleague a question. You don't file a ticket; you just ask. Skip the SQL. Just ask your data a question and get a chart in seconds. This approach gives everyone on your team direct access to answers.
Data Analytics: The Old Way vs. The New Way
Feature | The Old Way (Manual SQL & BI Tools) | The New Way (Statspresso) |
|---|---|---|
How You Get Answers | Submit a request to an analyst or wrestle with a complex dashboard builder. | Ask a question in plain English, like "What were my top 5 selling products last month?" |
Time to Insight | Hours, days, or even weeks depending on analyst availability. | Seconds. You get an immediate chart or number. |
Required Skills | Deep technical expertise in SQL, data modeling, and specific BI software. | Curiosity. If you can ask a question, you can get an answer. |
Who Can Use It | Only data specialists, creating a significant bottleneck for the rest of the team. | Anyone—founders, marketers, product managers, and support leads. |
Typical Cost | High licensing fees plus the cost of hiring and retaining specialized talent. | An affordable, predictable monthly subscription that scales with your business. |
The contrast is stark. While legacy tools still have a place, the "new way" offers the fastest path to answers for over 90% of your daily business questions.
The Real-World ROI of Conversational Analytics
This isn't just about saving time; it's about a measurable return on investment. The productivity bump from AI-powered analytics is huge. As detailed in a recent report on small business AI adoption, businesses using these tools report significant savings. The data shows 58% save more than 20 hours a month, and 66% save between $500-$2,000 monthly. Those hours and dollars add up fast.
This infographic breaks down some high-value areas where you can put analytics to work.
By pointing a conversational AI tool at your data, you can uncover opportunities that improve your bottom line. It’s also a great way to move beyond generic reports by building custom SEO dashboards that tie your specific activities to business goals.
Try asking Statspresso: "What is the average time between a customer's first and second purchase?"
In the past, answering that would have meant hours in spreadsheets. Now, it's a simple query that delivers a critical insight in moments.
Your Roadmap to Becoming a Data-Driven Business
So, you're sold on using data analytics for your small business. But where do you begin? Don't get intimidated by launching a massive "data strategy." Becoming data-driven isn't about buying a tool; it's about building a habit of curiosity. This simple roadmap shows you how.
Step 1: Pinpoint Your Core Business Questions
First things first: resist the urge to analyze everything at once. That's a path to paralysis. Start small and stay focused.
Identify just one to three burning questions that would genuinely move the needle for your business.
Marketing: "Which of our ad campaigns has the best return on ad spend (ROAS)?"
Sales: "How many days does it take for a new lead to become a paying customer?"
Operations: "What are our top 3 most-returned products, and why?"
Picking a few high-impact questions creates a clear target.
Step 2: Connect Your Key Data Sources
Now, let’s figure out where the answers are hiding. Most small businesses have their data spread across a handful of platforms. Just start with the one or two systems that hold the most valuable information. For most companies, that means connecting:
Your ecommerce platform (like Shopify)
Your web analytics tool (like Google Analytics)
Your CRM or marketing tool (like HubSpot)
This is where a Conversational AI Data Analyst like Statspresso makes a huge difference. You simply authorize access, and the platform does the heavy lifting of connecting the dots.
Step 3: Ask, Explore, and Validate
With your data connected, it's time for the fun part: start asking those questions. Type your question in plain English and see what the data says.
Try asking Statspresso: "Show me my revenue by month for the last year as a bar chart."
But don't stop at the first answer. Let curiosity lead the way. If a chart reveals a revenue spike in May, ask a follow-up: "What were my top traffic sources in May?" This ability to immediately drill down is what makes modern analytics so powerful. Skip the SQL. Just ask your data a question and get a chart in seconds.
Step 4: Create a Central Dashboard
As you uncover useful charts, save your most important visuals to a central dashboard. Think of it as your business's "mission control"—a single place your team can look to for the truth. This isn’t about building some overwhelming, complicated dashboard. It’s about curating a handful of key metrics that show you the health of your business at a glance.
Step 5: Schedule a Weekly Metrics Huddle
Finally, turn data into a team ritual. A dashboard is worthless if no one looks at it. Put a short, 15-minute weekly huddle on the calendar to review your main metrics as a team. This isn't a long presentation. It's a quick discussion: What went right last week? What looks off? What's our focus for this week? When data becomes part of your weekly conversation, you build a culture where decisions are backed by evidence, not just gut feelings.
Answering Your Top Questions About Small Business Data Analytics
It's normal to have questions before diving into the world of data. Let's walk through some of the most common concerns we hear from small business owners and get you straightforward answers.
Is My Business Too Small for Data Analytics?
This is the biggest hesitation we see, and the short answer is: no. You wouldn't say your business is too small to check its bank account. Data is just another form of essential feedback. Even if you've only made your first sale, you have data. That single sale tells a story. The sooner you start paying attention to early signals, the faster you can spot what’s working.
Do I Need to Hire a Data Analyst to Use These Tools?
Not anymore. The old way absolutely required a specialist who could write SQL. That put data out of reach for most small businesses. Modern tools are built for the rest of us—the busy founders, marketers, and managers who have questions but no time to become data wizards.
This is exactly why a Conversational AI Data Analyst like Statspresso exists. They are designed for people without a technical background. If you can ask a question in plain English, you can get a chart in seconds. You bring the business knowledge; the AI does the heavy lifting.
How Secure Is Connecting My Business Data to an AI Platform?
This is a critical question. Handing over access to your business data is a big deal, and any reputable analytics company treats security as its top priority.
Legitimate platforms use a multi-layered defense system. Look for these key indicators:
SOC 2 Compliance: A tough, independent audit that confirms a company follows strict security policies.
End-to-End Encryption: Your data is scrambled and protected both in transit and at rest.
Read-Only Access: Most modern tools connect to your databases with "read-only" permissions. They can view your data to analyze it, but they have no ability to change, edit, or delete your original records.
Always check a platform's security page. A company that values your trust will be transparent about how they protect you.
What’s the Difference Between This and My Shopify Dashboard?
Your Shopify, Google Analytics, or HubSpot dashboards are great for what they do. They give you a snapshot of what's happening inside that one specific tool. The problem is, they don't talk to each other. Your Shopify dashboard can't tell you which Facebook ad brought in your most valuable customers.
True data analytics for small business happens when you bring those separate pieces together. An analytics platform like Statspresso connects to all these different sources, blending the data into a single, unified view. It’s the difference between looking at a single puzzle piece and finally seeing the complete picture.
Ready to stop guessing and start knowing? Statspresso is your on-demand data analyst. Connect your first data source for free and ask your first question to see how easy it is to get clear answers in seconds.