Automate Reports: No SQL, No Analyst (2026)

Waiting weeks for a data analyst to build a dashboard is a relic of the past. If your week starts with the familiar, soul-crushing ritual of downloading CSVs just to see what happened last week, you're not just doing tedious work—you're operating at a competitive disadvantage. It's time to automate reports and get your team focused on growth, not spreadsheets. This guide will show you how to do it.
TL;DR: How to Automate Reports
Start with Questions, Not Dashboards: Focus on the KPIs that actually matter. What do you need to know daily or weekly?
Connect Your Data Sources in Minutes: Securely link platforms like Shopify or your Postgres database with a few clicks. No engineering help needed.
Skip the SQL, Just Ask: Use a Conversational AI Data Analyst like Statspresso to get charts by asking questions in plain English.
Set It and Forget It: Turn any chart into a scheduled report delivered directly to your email or Slack.
Embed Insights Everywhere: Put live, interactive charts directly into your team's workflow in Notion or Confluence.
Your Manual Reporting Is Costing You More Than Just Time

Does your week start with that familiar ritual of downloading CSVs from Shopify or HubSpot? If you're manually stitching data together in a spreadsheet to see last week's numbers, you're lighting money on fire. The real cost of clinging to these old methods is staggering, and it's hiding in plain sight.
The problems run deeper than just wasted hours:
Decisions on a Delay: You’re constantly looking in the rearview mirror, using stale data to navigate today’s challenges.
Costly Human Errors: One wrong copy-paste or a bad formula can torpedo your entire strategy. We’ve all seen it happen.
Wasted Talent and Burnout: Your smartest people are stuck doing repetitive data entry when they should be focused on growth. A huge part of this is the manual process itself. Taking steps toward automating data entry is a critical first move.
The Problem with Traditional BI Tools
For years, traditional Business Intelligence (BI) platforms were pitched as the answer. They just traded one problem for another. These tools created a new bottleneck, demanding deep SQL knowledge or weeks of complex setup.
As a founder or marketing lead, you don't have time for a data science project. You have business questions. You need answers now.
Skip the SQL. Just ask your data a question and get a chart in seconds. That’s the entire idea behind a Conversational AI Data Analyst like Statspresso. It removes the friction between your question and your data’s answer. Instead of spending an hour building a report, you spend five seconds asking for one.
The Old Way vs. The New Way
Task | Old Way (Manual SQL & Spreadsheets) | New Way (Statspresso) |
|---|---|---|
Get Sales Data | Export a CSV from Shopify, import it into a spreadsheet. | Connect Shopify once. Data syncs automatically. |
Ask a Question | "Can you pull last week's sales by product? I need it by EOD." | Type: "What were our top 5 products by sales last week?" |
Build a Chart | Spend 20 minutes with a pivot table. | Get an auto-generated chart in under 10 seconds. |
Share the Insight | Take a screenshot, paste it into Slack or an email. | Share a live, interactive link to the chart or dashboard. |
Follow-up Question | "Actually, can you break that down by discount code?" (Wait another hour). | Type: "Now break that down by discount code." (Get an updated chart instantly). |
The old way is a cycle of requests, waiting, and manual work. The new way is a conversation.
Figure Out What’s Actually Worth Measuring
Before you automate anything, ask a tough question: what metrics actually matter? It's easy to build a dashboard packed with "vanity metrics." It's useless. The first step to automate reports is focusing on the Key Performance Indicators (KPIs) that truly move the needle.
This is where a marketing lead stops obsessing over website traffic and starts digging into cost per qualified lead by channel. For a founder, it’s not about celebrating every new signup; it’s a relentless focus on the monthly recurring revenue (MRR) growth rate.
The trick is to frame these critical metrics as direct questions. It's a small mental shift, but it's the foundation for reports people actually use.
From Fuzzy Goals to Sharp Questions
Thinking in questions forces you to be specific. This approach is a natural fit for a Conversational AI Data Analyst like Statspresso, since the whole point is to just ask for what you need.
Let’s get real:
For a Product Manager: Don't "improve user engagement." Ask, "What is the 30-day retention rate for users who signed up last quarter, broken down by the first feature they used?"
For a Sales Lead: "Total deals closed" is a report card, not an insight. A better question is, "Show me our average sales cycle length by deal size for the past six months." Now you can spot where big deals get stuck.
For a Marketing Lead: Forget social media followers. Ask, "What is our customer lifetime value (LTV) for users acquired from Google Ads versus organic search?" This tells you where to put your money.
This is where you skip writing SQL. You did the hard work by figuring out the right question. Now you just need a tool that understands plain English.
Try asking Statspresso: "Show me my new customer acquisition cost by marketing channel for the last 90 days."
You'll get a chart without ever opening a spreadsheet. From here, automating the report is as simple as telling Statspresso to run that query every Monday morning. That’s smart report automation.
Connect Your Data Sources in Minutes, Not Weeks

Let's be real—the biggest bottleneck in reporting has always been getting your data in one place. What used to take weeks of engineering back-and-forth can now be done in the time it takes to drink your coffee.
You're running a business, not a data center. Your customer info might be in a Postgres database, your sales data in Shopify, and your marketing funnel in Google Analytics. Getting them to talk shouldn't require a computer science degree.
This is where a Conversational AI Data Analyst like Statspresso completely shifts the dynamic. It handles the messy part. Instead of wrestling with API docs, you just authorize a secure connection. Skip the SQL. The moment a source is connected, you can start asking it questions.
A Quick Word on Security: I know connecting your core database seems intimidating. Modern platforms are built on a read-only principle. Tools like Statspresso can never modify, update, or delete your source data. It only reads information to answer your questions, so your data's integrity is never at risk.
From Connection to Conversation
Once you’ve authenticated your sources, the wall between you and your data crumbles. You can immediately start pulling insights.
Connect Shopify: Within five minutes, ask, "What was our AOV last month?"
Link your Postgres DB: Seconds later, follow up with, "Show me the top 10 power users by number of logins."
Integrate Google Analytics: Then pivot again, "Which blog posts drove the most conversions in Q4?"
Each new connection becomes another source of instant answers.
Try asking Statspresso: "Compare new subscriptions from our web and mobile apps for the last 6 months."
You’ll get a chart back in seconds. The path from raw data to a clear insight is now ridiculously short.
Turning Your Questions Into Fully Automated Reports
Alright, you’ve connected your data and know what to ask. This is where you build a hands-off, automated report that works for you. No Python scripts, no cron jobs.
It starts with a simple conversation.
Imagine you're a product manager. You can ask Statspresso, our Conversational AI Data Analyst, a direct question.
"Show me weekly active users from our Postgres database over the last six months."
In seconds, you have a line chart. But you see a dip. You want to know why.
"Now segment this by acquisition channel."
The chart updates instantly. A recent ad campaign change is the culprit. You've found your insight. Now, how do you watch this without repeating the process every week?
From Insight to Automated Workflow
Once you have the perfect chart, you’re clicks away from putting it on autopilot.
Save Your Work: Click "Save to Dashboard." Create a new one, maybe "Weekly Product KPIs."
Set a Schedule: From the dashboard, hit "Schedule." Set the cadence—every Monday at 8 AM—and choose how it's delivered. Send a PDF to your team's Slack channel or email it to execs.
That's it. You just built an automated reporting pipeline. The push for this kind of automation is everywhere; the business process automation market is projected to hit $19.4 billion by 2026. Companies are seeing clear, fast ROI. You can read the full research on the business process automation market to dig deeper.
This frees you up to act on the data, not just gather it. You can see more on this approach in this guide on Transforming Customer Support Data Into Actionable Reports With AI.
Embed Live Insights Directly into Your Team's Workflow
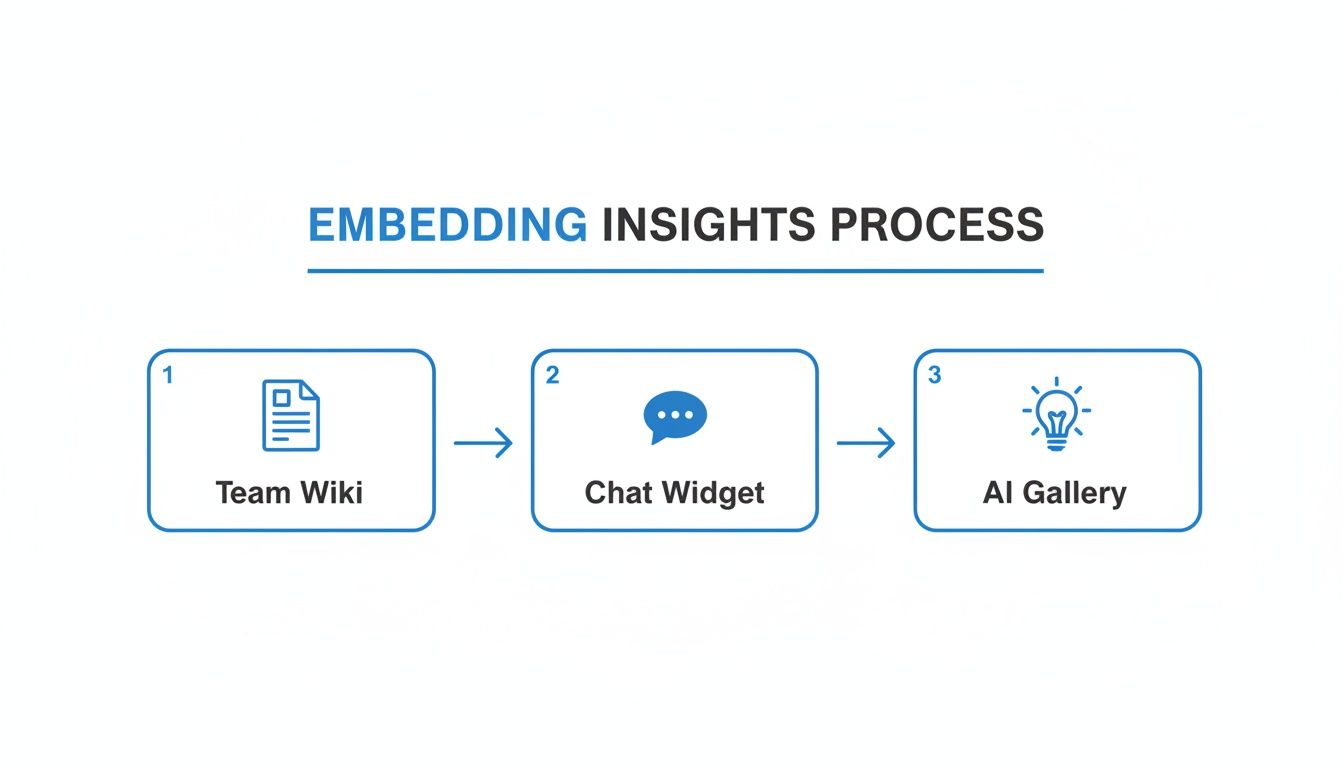
An automated report gathering dust in an inbox is useless. Real value comes when data sparks a decision. The final step is embedding insights where your team lives—your Notion pages, your internal admin panels, and your team chats.
Bring Your Wiki to Life with Live Charts
Think about your team’s wiki in Confluence or Notion. How often is the data a stale, weeks-old screenshot? Fix that.
Instead of pasting a dead image, embed a live chart right on the page. Imagine your marketing team's weekly plan with a chart showing real-time cost-per-acquisition by channel, refreshing on its own. The numbers are right where the conversation is happening. This turns a static document into a dynamic workspace. Learn more in our guide on what is embedded analytics.
Empower Your Team with Embedded Chat
What if someone has a question that isn't on a pre-built chart? Embed a chat widget directly into your internal tools. Think of it as putting Statspresso, your Conversational AI Data Analyst, inside your company’s admin panel.
Now, a support manager can ask, "How many tickets were created yesterday about billing issues?" and get an answer instantly—without leaving their support dashboard. It removes the data team as a bottleneck.
Try asking Statspresso: "Show me my user retention by cohort for the last three months."
Your Action Plan to Automate Reporting Today
Let's cut to the chase. Manual reporting is a competitive disadvantage. It's slow, error-prone, and bogs down your best people. You have to stop being the bottleneck.
Here's what to do:
Start with Questions, Not Dashboards. Define the crucial business questions you need answered. What numbers truly matter?
Connect Your Sources in Minutes. Connect data sources like Shopify or Postgres in minutes, no code required.
Talk to Your Data. Use conversational AI to ask for what you need. Build a report just by asking questions, then schedule it for delivery to Slack or email. Skip the SQL and get straight to answers.
Embed Live Insights Everywhere. Embed live charts and chat widgets directly into tools like Notion or Confluence.
Stop being the data gatekeeper. You can get your first automated report running in the next five minutes.
Common Questions About Report Automation
When moving away from manual spreadsheets, a few questions always come up. I've heard them all. Let's tackle them head-on.
"How Secure Is It to Connect My Database?"
This is the most important question. Your data's security is non-negotiable.
Connections are always made with read-only access. This is critical. It means a tool like Statspresso can only view your data, never change, update, or delete anything. On top of that, every connection is protected by end-to-end encryption, and the platform is SOC 2 compliant.
"Can It Handle Our Complex Calculations?"
Absolutely. For everyday analysis, you can simply ask follow-up questions. Start with total sales, then ask, "what was the week-over-week growth?" or "break that down by marketing channel."
For the heavy lifting, Statspresso can tap into complex data models your analytics team already built. If you have a specific definition for a metric like customer lifetime value (LTV), our Conversational AI Data Analyst queries that existing logic directly.
"What If My Team Doesn't Know What to Ask?"
A real problem. When you've been limited to the same static reports, it's tough to break out of that box.
That's where an AI-driven Insight Gallery comes in. It proactively scans your data for anomalies and interesting trends. It might surface a sudden drop in engagement or flag a landing page that's converting at a high rate.
These aren't just random charts; they're conversation starters. It's like having a junior analyst on your team who's always digging for opportunities.
Ready to stop being the data bottleneck and empower your team with instant answers? Connect your first data source for free and ask your first question.
Waiting weeks for a data analyst to build a dashboard is a relic of the past. If your week starts with the familiar, soul-crushing ritual of downloading CSVs just to see what happened last week, you're not just doing tedious work—you're operating at a competitive disadvantage. It's time to automate reports and get your team focused on growth, not spreadsheets. This guide will show you how to do it.
TL;DR: How to Automate Reports
Start with Questions, Not Dashboards: Focus on the KPIs that actually matter. What do you need to know daily or weekly?
Connect Your Data Sources in Minutes: Securely link platforms like Shopify or your Postgres database with a few clicks. No engineering help needed.
Skip the SQL, Just Ask: Use a Conversational AI Data Analyst like Statspresso to get charts by asking questions in plain English.
Set It and Forget It: Turn any chart into a scheduled report delivered directly to your email or Slack.
Embed Insights Everywhere: Put live, interactive charts directly into your team's workflow in Notion or Confluence.
Your Manual Reporting Is Costing You More Than Just Time
Does your week start with that familiar ritual of downloading CSVs from Shopify or HubSpot? If you're manually stitching data together in a spreadsheet to see last week's numbers, you're lighting money on fire. The real cost of clinging to these old methods is staggering, and it's hiding in plain sight.
The problems run deeper than just wasted hours:
Decisions on a Delay: You’re constantly looking in the rearview mirror, using stale data to navigate today’s challenges.
Costly Human Errors: One wrong copy-paste or a bad formula can torpedo your entire strategy. We’ve all seen it happen.
Wasted Talent and Burnout: Your smartest people are stuck doing repetitive data entry when they should be focused on growth. A huge part of this is the manual process itself. Taking steps toward automating data entry is a critical first move.
The Problem with Traditional BI Tools
For years, traditional Business Intelligence (BI) platforms were pitched as the answer. They just traded one problem for another. These tools created a new bottleneck, demanding deep SQL knowledge or weeks of complex setup.
As a founder or marketing lead, you don't have time for a data science project. You have business questions. You need answers now.
Skip the SQL. Just ask your data a question and get a chart in seconds. That’s the entire idea behind a Conversational AI Data Analyst like Statspresso. It removes the friction between your question and your data’s answer. Instead of spending an hour building a report, you spend five seconds asking for one.
The Old Way vs. The New Way
Task | Old Way (Manual SQL & Spreadsheets) | New Way (Statspresso) |
|---|---|---|
Get Sales Data | Export a CSV from Shopify, import it into a spreadsheet. | Connect Shopify once. Data syncs automatically. |
Ask a Question | "Can you pull last week's sales by product? I need it by EOD." | Type: "What were our top 5 products by sales last week?" |
Build a Chart | Spend 20 minutes with a pivot table. | Get an auto-generated chart in under 10 seconds. |
Share the Insight | Take a screenshot, paste it into Slack or an email. | Share a live, interactive link to the chart or dashboard. |
Follow-up Question | "Actually, can you break that down by discount code?" (Wait another hour). | Type: "Now break that down by discount code." (Get an updated chart instantly). |
The old way is a cycle of requests, waiting, and manual work. The new way is a conversation.
Figure Out What’s Actually Worth Measuring
Before you automate anything, ask a tough question: what metrics actually matter? It's easy to build a dashboard packed with "vanity metrics." It's useless. The first step to automate reports is focusing on the Key Performance Indicators (KPIs) that truly move the needle.
This is where a marketing lead stops obsessing over website traffic and starts digging into cost per qualified lead by channel. For a founder, it’s not about celebrating every new signup; it’s a relentless focus on the monthly recurring revenue (MRR) growth rate.
The trick is to frame these critical metrics as direct questions. It's a small mental shift, but it's the foundation for reports people actually use.
From Fuzzy Goals to Sharp Questions
Thinking in questions forces you to be specific. This approach is a natural fit for a Conversational AI Data Analyst like Statspresso, since the whole point is to just ask for what you need.
Let’s get real:
For a Product Manager: Don't "improve user engagement." Ask, "What is the 30-day retention rate for users who signed up last quarter, broken down by the first feature they used?"
For a Sales Lead: "Total deals closed" is a report card, not an insight. A better question is, "Show me our average sales cycle length by deal size for the past six months." Now you can spot where big deals get stuck.
For a Marketing Lead: Forget social media followers. Ask, "What is our customer lifetime value (LTV) for users acquired from Google Ads versus organic search?" This tells you where to put your money.
This is where you skip writing SQL. You did the hard work by figuring out the right question. Now you just need a tool that understands plain English.
Try asking Statspresso: "Show me my new customer acquisition cost by marketing channel for the last 90 days."
You'll get a chart without ever opening a spreadsheet. From here, automating the report is as simple as telling Statspresso to run that query every Monday morning. That’s smart report automation.
Connect Your Data Sources in Minutes, Not Weeks
Let's be real—the biggest bottleneck in reporting has always been getting your data in one place. What used to take weeks of engineering back-and-forth can now be done in the time it takes to drink your coffee.
You're running a business, not a data center. Your customer info might be in a Postgres database, your sales data in Shopify, and your marketing funnel in Google Analytics. Getting them to talk shouldn't require a computer science degree.
This is where a Conversational AI Data Analyst like Statspresso completely shifts the dynamic. It handles the messy part. Instead of wrestling with API docs, you just authorize a secure connection. Skip the SQL. The moment a source is connected, you can start asking it questions.
A Quick Word on Security: I know connecting your core database seems intimidating. Modern platforms are built on a read-only principle. Tools like Statspresso can never modify, update, or delete your source data. It only reads information to answer your questions, so your data's integrity is never at risk.
From Connection to Conversation
Once you’ve authenticated your sources, the wall between you and your data crumbles. You can immediately start pulling insights.
Connect Shopify: Within five minutes, ask, "What was our AOV last month?"
Link your Postgres DB: Seconds later, follow up with, "Show me the top 10 power users by number of logins."
Integrate Google Analytics: Then pivot again, "Which blog posts drove the most conversions in Q4?"
Each new connection becomes another source of instant answers.
Try asking Statspresso: "Compare new subscriptions from our web and mobile apps for the last 6 months."
You’ll get a chart back in seconds. The path from raw data to a clear insight is now ridiculously short.
Turning Your Questions Into Fully Automated Reports
Alright, you’ve connected your data and know what to ask. This is where you build a hands-off, automated report that works for you. No Python scripts, no cron jobs.
It starts with a simple conversation.
Imagine you're a product manager. You can ask Statspresso, our Conversational AI Data Analyst, a direct question.
"Show me weekly active users from our Postgres database over the last six months."
In seconds, you have a line chart. But you see a dip. You want to know why.
"Now segment this by acquisition channel."
The chart updates instantly. A recent ad campaign change is the culprit. You've found your insight. Now, how do you watch this without repeating the process every week?
From Insight to Automated Workflow
Once you have the perfect chart, you’re clicks away from putting it on autopilot.
Save Your Work: Click "Save to Dashboard." Create a new one, maybe "Weekly Product KPIs."
Set a Schedule: From the dashboard, hit "Schedule." Set the cadence—every Monday at 8 AM—and choose how it's delivered. Send a PDF to your team's Slack channel or email it to execs.
That's it. You just built an automated reporting pipeline. The push for this kind of automation is everywhere; the business process automation market is projected to hit $19.4 billion by 2026. Companies are seeing clear, fast ROI. You can read the full research on the business process automation market to dig deeper.
This frees you up to act on the data, not just gather it. You can see more on this approach in this guide on Transforming Customer Support Data Into Actionable Reports With AI.
Embed Live Insights Directly into Your Team's Workflow
An automated report gathering dust in an inbox is useless. Real value comes when data sparks a decision. The final step is embedding insights where your team lives—your Notion pages, your internal admin panels, and your team chats.
Bring Your Wiki to Life with Live Charts
Think about your team’s wiki in Confluence or Notion. How often is the data a stale, weeks-old screenshot? Fix that.
Instead of pasting a dead image, embed a live chart right on the page. Imagine your marketing team's weekly plan with a chart showing real-time cost-per-acquisition by channel, refreshing on its own. The numbers are right where the conversation is happening. This turns a static document into a dynamic workspace. Learn more in our guide on what is embedded analytics.
Empower Your Team with Embedded Chat
What if someone has a question that isn't on a pre-built chart? Embed a chat widget directly into your internal tools. Think of it as putting Statspresso, your Conversational AI Data Analyst, inside your company’s admin panel.
Now, a support manager can ask, "How many tickets were created yesterday about billing issues?" and get an answer instantly—without leaving their support dashboard. It removes the data team as a bottleneck.
Try asking Statspresso: "Show me my user retention by cohort for the last three months."
Your Action Plan to Automate Reporting Today
Let's cut to the chase. Manual reporting is a competitive disadvantage. It's slow, error-prone, and bogs down your best people. You have to stop being the bottleneck.
Here's what to do:
Start with Questions, Not Dashboards. Define the crucial business questions you need answered. What numbers truly matter?
Connect Your Sources in Minutes. Connect data sources like Shopify or Postgres in minutes, no code required.
Talk to Your Data. Use conversational AI to ask for what you need. Build a report just by asking questions, then schedule it for delivery to Slack or email. Skip the SQL and get straight to answers.
Embed Live Insights Everywhere. Embed live charts and chat widgets directly into tools like Notion or Confluence.
Stop being the data gatekeeper. You can get your first automated report running in the next five minutes.
Common Questions About Report Automation
When moving away from manual spreadsheets, a few questions always come up. I've heard them all. Let's tackle them head-on.
"How Secure Is It to Connect My Database?"
This is the most important question. Your data's security is non-negotiable.
Connections are always made with read-only access. This is critical. It means a tool like Statspresso can only view your data, never change, update, or delete anything. On top of that, every connection is protected by end-to-end encryption, and the platform is SOC 2 compliant.
"Can It Handle Our Complex Calculations?"
Absolutely. For everyday analysis, you can simply ask follow-up questions. Start with total sales, then ask, "what was the week-over-week growth?" or "break that down by marketing channel."
For the heavy lifting, Statspresso can tap into complex data models your analytics team already built. If you have a specific definition for a metric like customer lifetime value (LTV), our Conversational AI Data Analyst queries that existing logic directly.
"What If My Team Doesn't Know What to Ask?"
A real problem. When you've been limited to the same static reports, it's tough to break out of that box.
That's where an AI-driven Insight Gallery comes in. It proactively scans your data for anomalies and interesting trends. It might surface a sudden drop in engagement or flag a landing page that's converting at a high rate.
These aren't just random charts; they're conversation starters. It's like having a junior analyst on your team who's always digging for opportunities.
Ready to stop being the data bottleneck and empower your team with instant answers? Connect your first data source for free and ask your first question.