What Is Embedded Analytics? (2026 Guide)

Let's get straight to it. Embedded analytics is the simple act of putting data dashboards and reporting tools directly inside the software your teams and customers use every day. Waiting weeks for a data analyst to build a dashboard is a relic of the past. It’s about bringing data to where the work gets done, whether that's your SaaS app, a CRM, or an internal tool.
This approach ends the painful ritual of toggling between tabs, exporting messy CSVs, or waiting in line for a report. Instead, users get instant, interactive charts to answer their own questions without ever leaving your app.
TL;DR (Too Long; Didn't Read)
What it is: Putting charts and dashboards directly into your software.
Why it matters: It stops forcing users to export data or wait for manual reports.
The trend: The market is booming as users demand in-app, real-time insights.
The new way: Tools like Statspresso, a Conversational AI Data Analyst, let you skip the SQL and just ask your data a question.
Why Your App's Data Is Trapped (And How to Free It)
Every SaaS application is a goldmine of data. The problem? For your customers and even your internal teams, that gold might as well be locked in a vault. The old way of doing things creates friction and squanders opportunities.
Forcing users to export data or wait weeks for a custom dashboard is a broken system. In today's world, instant access isn't a luxury; it's the baseline.
This shift is fueling a massive market boom. A Mordor Intelligence report projects the embedded analytics market will skyrocket to USD 86.2 billion by 2034. Why the explosion? Because businesses are tired of waiting and are demanding data at their fingertips.
From Data Purgatory to Product Partner
The real killer is context switching. When users have to leave your application to make sense of their data, you're not just inconveniencing them—you're actively devaluing your own product. They lose their flow, and the insights feel disconnected from the actions they need to take right then and there.
Embedded analytics flips this dynamic on its head. It turns your product from a simple tool into an indispensable, data-driven partner.
Imagine your user asking, "How did my last marketing campaign perform?" and getting a complete answer with interactive charts in seconds, without ever leaving your app. That's the power we're talking about.
This isn't just about throwing data on a screen; it's about doing it securely. The right solution ensures sensitive information is protected, preventing unauthorized access while making insights available to the right people.

Security and accessibility aren't opposing forces. Modern embedded analytics platforms are built to deliver insights safely, respecting your product's existing user permissions and security framework.
Stop Building Reports, Start Answering Questions
This is where a Conversational AI Data Analyst like Statspresso completely changes the game. Instead of just embedding static dashboards that only answer a handful of canned questions, you can embed an experience that lets users ask anything.
Skip the SQL: Your users don't need to know a line of code. They just ask a question in plain English.
Get Instant Charts: A simple query returns a rich data visualization in seconds.
Boost Stickiness: When users can answer their own questions, they become more self-sufficient, engaged, and far less likely to churn.
This approach moves beyond simply displaying data; it fosters genuine data exploration and curiosity right inside your product.
Try asking Statspresso: "Show me my revenue by month for the last year as a bar chart."
What Does "Embedded Analytics" Actually Mean?
At its core, embedded analytics is all about putting data insights and dashboards directly into the software people already use every day. That’s it. No jargon needed.
Think about the navigation system in your car. Instead of juggling a separate map (like using a standalone BI tool), the directions are right there on the dashboard. It’s built into the experience. Embedded analytics does the exact same thing for your business applications—it brings the data to where you and your users are already working.
This simple change means your users don't have to stop what they're doing, log into a different platform like Tableau or Looker, and try to find the information they need. The insights are right there, making them immediately useful.
It's All About Context
The real power of embedding analytics lies in one word: context. When a sales manager is looking at their team's performance in your CRM, they shouldn't have to export data to a spreadsheet just to see their sales pipeline. The pipeline chart should be sitting right there, next to their list of active deals.
When you place data directly into a user's workflow, you eliminate the friction of switching between apps. That simple shift transforms data from a tedious task into a natural part of making a decision.
This approach turns your application from a simple tool into a smart partner that helps users do their job better. It answers questions the moment they pop into a user's head, which makes your product stickier and far more valuable.
The Old Way vs. The New Way
For a long time, getting answers from data was a slow, frustrating process. The "new way," driven by embedded analytics and conversational AI, completely overhauls that workflow.
The Old Way (Manual SQL & Separate Tools) | The New Way (Statspresso) |
|---|---|
Export data to a messy CSV file. | Data lives right inside the app. |
Log into a separate, complex BI platform. | Insights are part of the UI. |
Wait for an analyst to write SQL queries. | Ask a question, get an answer in seconds. |
View static, pre-built dashboards. | Explore data and ask new questions. |
This isn't just about making things easier; it's about making things faster. The team that gets answers from their data the quickest almost always wins.
Not All Embedding Is Created Equal
"Embedded analytics" can mean a few different things, with each approach offering a different level of power.
Static Dashboards: The most basic form. You're just dropping a pre-built, non-interactive dashboard into your application. It’s a start, but users can't dig deeper.
Interactive BI: A big step up. Users can filter data, drill down, and explore a predefined dataset. It offers more flexibility but is still limited to what's been prepared ahead of time.
Conversational Analytics: The most advanced and intuitive form. With a Conversational AI Data Analyst like Statspresso, users skip dashboards entirely. Instead, they just ask questions in plain English and get custom charts on the spot.
This conversational approach is the end goal. It cuts out the need for SQL or fiddling with report builders. You just ask your data a question, like you'd ask a colleague.
Try asking Statspresso: "Show me my new signups by acquisition channel this month as a pie chart."
By embedding this capability, you give every user the power to be their own data analyst.
4 Ways to Embed Analytics: Which Approach is Right for You?
Okay, you're convinced. Putting analytics in your application is the way to go. But how do you actually do it? This is a serious architectural decision that impacts your budget, timeline, and customer experience.
Let's walk through the four main ways to get charts and dashboards into your product, without the dense engineering jargon.
1. iFrames: The "Quick and Dirty" Route
An iFrame (or Inline Frame) is the fastest way to get analytics up and running. Think of it as cutting a window in your app's wall and pointing it to your analytics dashboard living on another server. It’s a straightforward approach with minimal developer effort.
The catch? Speed comes at a price. iFrames often feel clunky and disconnected. They can be slow to load, a nightmare to style, and just scream "tacked on." It's a start, but it's rarely a solution that delights customers.
2. JavaScript SDKs: The Balanced Approach
A JavaScript SDK (Software Development Kit) is a big step up from iFrames, offering a much more integrated feel. Instead of a clunky window, your developers get a library of pre-built components they can place more naturally within your application.
This gives you far more control over the look and feel, allowing you to create a cohesive experience that matches your brand. The trade-off is more technical work, but the result is a far more professional and seamless experience.
The Bottom Line: Your integration method is your user experience. A seamless integration feels like a powerful, native feature. A clunky one feels like a cheap add-on.
This decision tree helps visualize the fundamental choice: do you force users to leave your app for insights, or do you bring the insights directly to them?
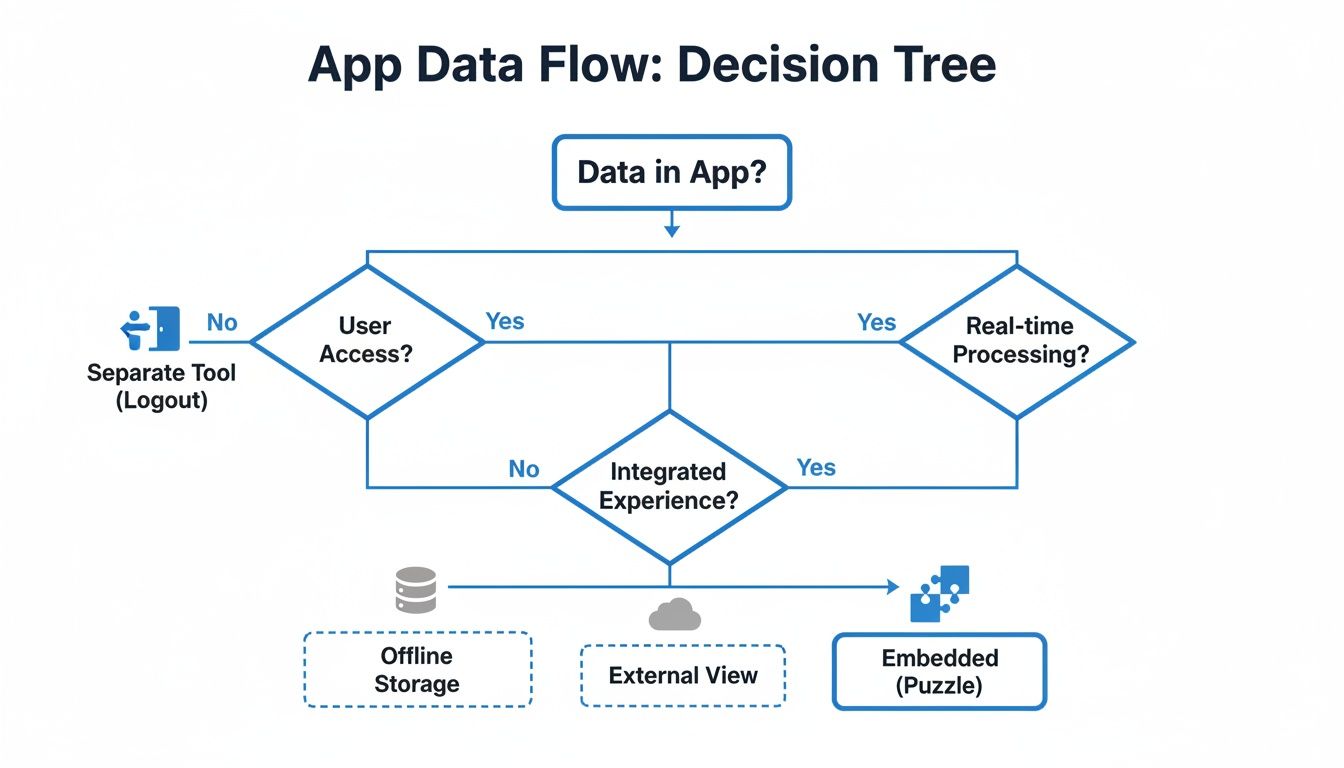
Embedding keeps users inside your product, making it the one-stop shop for both doing the work and understanding the results.
3. APIs: The Power-User Path
For teams that want serious customization without building everything from the ground up, there are APIs (Application Programming Interfaces). An API-first analytics platform allows your developers to request raw, processed data and then use your own front-end code to render the visualizations.
This gives you fantastic control over the end-user experience while still offloading the heavy lifting of data processing to the vendor. It’s a great middle ground for teams with solid engineering resources who want deep integration.
4. Fully Native: The "Build it Yourself" Mountain
Finally, there’s building a fully native solution. This is the high-effort, high-reward approach. Your team builds the entire analytics feature from scratch—the data connection, the query engine, the front-end charts, everything.
This gives you total, pixel-perfect control. But be warned: this path is extremely expensive and time-consuming, requiring a dedicated team of engineers for the initial build and all ongoing maintenance.
Embedding a tool like Statspresso, a Conversational AI Data Analyst, lets you sidestep this massive development overhead. Instead of building endless charts, you embed a simple chat interface.
Try asking Statspresso: "Compare user retention for customers who onboarded in Q1 vs Q2."
You get the analytical power of a custom solution without the years of development pain. Your users get instant answers, and your engineers stay focused on your core product.
The Build vs. Buy Decision for Analytics
Sooner or later, every product leader hits this fork in the road: do we build that shiny new analytics feature ourselves, or do we buy a solution from someone who lives and breathes this stuff?
At first glance, building it yourself is tempting. The idea of total control, a feature tailored perfectly to your application, is a powerful draw.
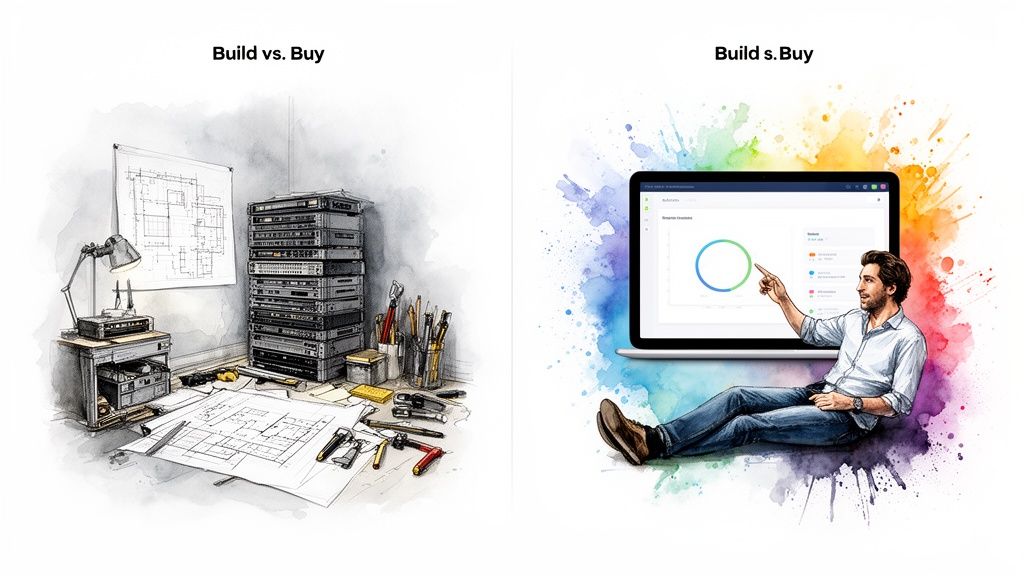
But here's the hard truth: building analytics in-house is often a brutal, resource-draining marathon. You're not just whipping up a few charts. You’re signing your engineering team up to create, scale, and forever maintain an entire product inside your main product.
Why Building From Scratch Is a Trap
The real cost of a DIY analytics solution isn't the initial coding sprint; it’s the endless maintenance that follows. Data sources change. Security holes need patching. And your users will inevitably ask for new chart types, filters, and features.
Your homegrown analytics module quickly becomes a hungry mouth that needs constant feeding from your engineering budget.
The "total control" you gain from a custom build often morphs into "total responsibility." Every bug, slowdown, and feature request lands squarely on your team's plate, forever.
This is the slow-burn cost that causes so many in-house analytics projects to eventually stall, leaving behind a clunky, outdated feature nobody loves.
The Conversational AI Advantage
Choosing to "buy" becomes a no-brainer with the rise of conversational analytics. Imagine embedding not just a few static dashboards, but an AI-powered analyst right into your app. This is where a solution like Statspresso, our Conversational AI Data Analyst, creates a huge competitive edge.
Let's break down the trade-offs:
Factor | The Old Way (Manual Build) | The New Way (Statspresso) |
|---|---|---|
Time-to-Market | 9-18+ months | 1-2 weeks |
Initial Cost | Very High (Multiple engineer salaries) | Low (Monthly subscription) |
Ongoing Maintenance | Constant engineering overhead | Zero, handled by vendor |
Feature Upgrades | Requires dedicated dev cycles | Automatic; new features roll out |
Core Focus | Diverted from your main product | Remains on your core product |
The "buy" decision is clear. Instead of trying to predict every question with a pre-built dashboard, you give users the power to ask anything.
Slash Development Time: Embed a single, powerful interface instead of dozens of reports.
Empower Your Users: Customers get instant answers without filing a support ticket.
Future-Proof Your Product: As AI capabilities improve, your analytics feature automatically gets smarter.
For example, you could ask Statspresso: “Show me our top 10 customers by revenue last quarter and what products they bought.”
The build-or-buy debate for analytics has reached a tipping point. With modern solutions that let you skip the SQL and just ask your data a question, the reasons to buy have become too big to ignore.
Embedded Analytics Use Cases That Drive Growth
Theory is great, but how does embedded analytics actually save you time or make you money? The value is in the specific, tangible results it creates when you pull data out of a dusty folder and put it in the middle of the action.
For SaaS companies, this means building customer-facing analytics that prove your app’s value and make it incredibly sticky. For your own teams, it’s about putting a sales dashboard right inside your CRM or marketing charts into your project management tools. No more toggling between a dozen tabs.
The goal is to deliver actionable insights directly within the user's natural workflow, making data a core part of their daily decisions.
Supercharging SaaS Products
One of the most powerful uses is building analytics directly into your own SaaS product. This has a direct impact on two critical metrics: user engagement and churn.
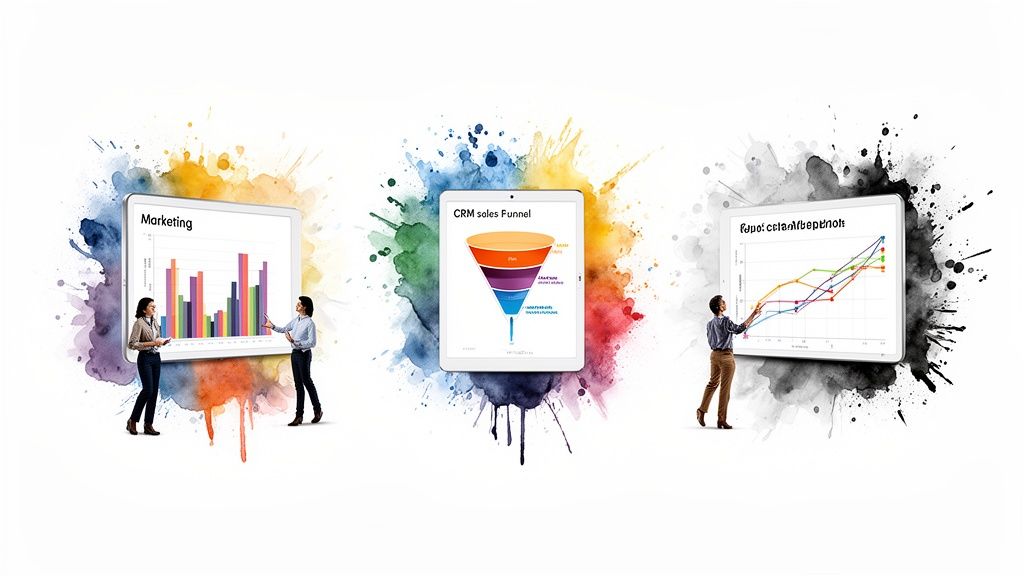
When customers can see the value they're getting—visualized in clear, compelling charts—they are far more likely to stick around.
Marketing Automation Tool: Embed dashboards showing campaign performance and conversion funnels.
Project Management App: Provide charts on team velocity and project completion rates.
E-commerce Platform: Offer real-time sales dashboards and customer lifetime value reports.
Accelerating Internal Teams
Embedded analytics is a massive productivity booster for your internal operations, too.
Why force your sales team to log into a separate BI tool to see their pipeline when you can embed that exact chart directly inside Salesforce? When insights live where decisions are made, you accelerate the entire business.
A marketing agency could embed client performance dashboards into their project management system, slashing manual reporting time by up to 90%. This frees up strategists to strategize, not copy-paste charts. We explore more ways to unlock these efficiencies in our guide to data analytics for startups.
The Conversational Approach in Action
Traditional embedded dashboards are static. A Conversational AI Data Analyst like Statspresso changes the game.
Imagine a product manager who needs to understand new feature performance. Instead of filing a ticket with the data team and waiting, they can just ask a question.
Try asking Statspresso: “Show me user engagement for our new 'Reporting' feature over the last 30 days, segmented by user plan.”
In seconds, they get a chart and a clear answer. This is the future of embedded analytics—it’s not just about presenting data, but enabling a real-time conversation with it.
Your Implementation Checklist For Success
Ready to start? Kicking off an embedded analytics project without a plan is like building a house without a blueprint. This checklist will help you start small, learn quickly, and deliver real value from day one.
1. Define Your "Why"
Before anyone writes a line of code, answer: What specific user pain point are you solving? Are customers stuck exporting CSVs? Are they in the dark about their ROI?
Don't build analytics because it's trendy. Build it because it solves a painful problem for the people who pay you. A strong "why" is your North Star.
Example: "Our users spend 5 hours a month manually building reports. We will embed analytics to give them that time back."
2. Identify The Key Metrics
Resist the temptation to show everything. A cluttered dashboard is a useless dashboard. What are the 3-5 numbers your user needs to see to feel like they're winning?
E-commerce: Revenue, Average Order Value, Customer Lifetime Value.
Project Management: Tasks Completed, On-time Percentage, Team Velocity.
Keep it focused. The goal is immediate clarity, not a mountain of detail.
3. Choose The Right Integration Method
Your integration method shapes your user's experience. Don't default to the quickest option (iFrames) if it creates a clunky feel. A JavaScript SDK or API-first approach often strikes a much better balance.
For the most intuitive experience, consider embedding a Conversational AI Data Analyst like Statspresso. This lets you embed one powerful chat interface instead of building dozens of charts.
4. Design A Seamless User Experience
Your analytics should feel like a natural part of your application, not a bolt-on. Match your existing UI—fonts, colors, button styles. A user should never know where your app ends and the analytics begin.
Put insights right where users need them. A sales performance chart belongs in your CRM's deal view, not buried three clicks deep in a "reports" tab.
5. Plan for Security and Governance
This is non-negotiable. Your chosen solution must support robust security protocols like row-level security. This guarantees users only see the data they are authorized to access, which is crucial for protecting sensitive information and maintaining trust.
6. Define and Measure ROI
How will you know if this project was a success? Define your key performance indicators (KPIs) before you start. Are you trying to:
Reduce churn by 5%?
Increase user engagement by 15%?
Create a new premium upsell tier?
Track these metrics religiously. If you can’t measure the impact, you can’t justify the investment.
Common Questions About Embedded Analytics
When teams first look into embedded analytics, a few key questions always come up. Let's tackle them head-on.
How Is Embedded Analytics Different from Traditional BI?
Traditional BI tools like Tableau or Power BI are separate destinations. Your team has to break their flow, open a new tab, and dig for a report.
Embedded analytics, on the other hand, weaves those insights directly into the applications your teams are already using. It kills context switching and makes data a real-time part of their workflow.
Is It Secure to Embed Analytics in My App?
Absolutely, if you do it right. Modern embedded analytics solutions are built with security at their core. Look for critical features like:
Row-Level Security: Ensures users only see the data they're authorized to see.
Data Masking: Obscures sensitive information while allowing for analysis of underlying trends.
Strict User Permissions: Controls access through your application's existing authentication system.
What Skills Does My Team Need to Implement This?
It depends on whether you "build" or "buy".
If you "buy" a solution, the effort is surprisingly low. You'll need a product manager to map out user needs and a developer for the one-time integration. The vendor handles the heavy lifting.
A "build" approach is a whole different ballgame. It requires a full team of backend engineers, frontend developers, and UI/UX designers, plus an ongoing commitment to maintain it all.
Can Users Actually Ask Their Own Questions?
This is where you see the difference between basic and advanced embedded analytics.
Many basic solutions just embed pre-built, static dashboards. It's a look-but-don't-touch experience.
More advanced platforms, especially a Conversational AI Data Analyst like Statspresso, are built for true data exploration. They empower users to ask questions in plain English and receive custom charts and answers instantly.
It's the difference between giving someone a static map and handing them a GPS that can answer any question about the journey. You're not just embedding a report; you're embedding a data expert.
Ready to move beyond static dashboards and have a real conversation with your data? With Statspresso, our Conversational AI Data Analyst, you can skip the SQL. Just ask your data a question and get a chart in seconds.
Connect your first data source for free and ask your first question.
Let's get straight to it. Embedded analytics is the simple act of putting data dashboards and reporting tools directly inside the software your teams and customers use every day. Waiting weeks for a data analyst to build a dashboard is a relic of the past. It’s about bringing data to where the work gets done, whether that's your SaaS app, a CRM, or an internal tool.
This approach ends the painful ritual of toggling between tabs, exporting messy CSVs, or waiting in line for a report. Instead, users get instant, interactive charts to answer their own questions without ever leaving your app.
TL;DR (Too Long; Didn't Read)
What it is: Putting charts and dashboards directly into your software.
Why it matters: It stops forcing users to export data or wait for manual reports.
The trend: The market is booming as users demand in-app, real-time insights.
The new way: Tools like Statspresso, a Conversational AI Data Analyst, let you skip the SQL and just ask your data a question.
Why Your App's Data Is Trapped (And How to Free It)
Every SaaS application is a goldmine of data. The problem? For your customers and even your internal teams, that gold might as well be locked in a vault. The old way of doing things creates friction and squanders opportunities.
Forcing users to export data or wait weeks for a custom dashboard is a broken system. In today's world, instant access isn't a luxury; it's the baseline.
This shift is fueling a massive market boom. A Mordor Intelligence report projects the embedded analytics market will skyrocket to USD 86.2 billion by 2034. Why the explosion? Because businesses are tired of waiting and are demanding data at their fingertips.
From Data Purgatory to Product Partner
The real killer is context switching. When users have to leave your application to make sense of their data, you're not just inconveniencing them—you're actively devaluing your own product. They lose their flow, and the insights feel disconnected from the actions they need to take right then and there.
Embedded analytics flips this dynamic on its head. It turns your product from a simple tool into an indispensable, data-driven partner.
Imagine your user asking, "How did my last marketing campaign perform?" and getting a complete answer with interactive charts in seconds, without ever leaving your app. That's the power we're talking about.
This isn't just about throwing data on a screen; it's about doing it securely. The right solution ensures sensitive information is protected, preventing unauthorized access while making insights available to the right people.
Security and accessibility aren't opposing forces. Modern embedded analytics platforms are built to deliver insights safely, respecting your product's existing user permissions and security framework.
Stop Building Reports, Start Answering Questions
This is where a Conversational AI Data Analyst like Statspresso completely changes the game. Instead of just embedding static dashboards that only answer a handful of canned questions, you can embed an experience that lets users ask anything.
Skip the SQL: Your users don't need to know a line of code. They just ask a question in plain English.
Get Instant Charts: A simple query returns a rich data visualization in seconds.
Boost Stickiness: When users can answer their own questions, they become more self-sufficient, engaged, and far less likely to churn.
This approach moves beyond simply displaying data; it fosters genuine data exploration and curiosity right inside your product.
Try asking Statspresso: "Show me my revenue by month for the last year as a bar chart."
What Does "Embedded Analytics" Actually Mean?
At its core, embedded analytics is all about putting data insights and dashboards directly into the software people already use every day. That’s it. No jargon needed.
Think about the navigation system in your car. Instead of juggling a separate map (like using a standalone BI tool), the directions are right there on the dashboard. It’s built into the experience. Embedded analytics does the exact same thing for your business applications—it brings the data to where you and your users are already working.
This simple change means your users don't have to stop what they're doing, log into a different platform like Tableau or Looker, and try to find the information they need. The insights are right there, making them immediately useful.
It's All About Context
The real power of embedding analytics lies in one word: context. When a sales manager is looking at their team's performance in your CRM, they shouldn't have to export data to a spreadsheet just to see their sales pipeline. The pipeline chart should be sitting right there, next to their list of active deals.
When you place data directly into a user's workflow, you eliminate the friction of switching between apps. That simple shift transforms data from a tedious task into a natural part of making a decision.
This approach turns your application from a simple tool into a smart partner that helps users do their job better. It answers questions the moment they pop into a user's head, which makes your product stickier and far more valuable.
The Old Way vs. The New Way
For a long time, getting answers from data was a slow, frustrating process. The "new way," driven by embedded analytics and conversational AI, completely overhauls that workflow.
The Old Way (Manual SQL & Separate Tools) | The New Way (Statspresso) |
|---|---|
Export data to a messy CSV file. | Data lives right inside the app. |
Log into a separate, complex BI platform. | Insights are part of the UI. |
Wait for an analyst to write SQL queries. | Ask a question, get an answer in seconds. |
View static, pre-built dashboards. | Explore data and ask new questions. |
This isn't just about making things easier; it's about making things faster. The team that gets answers from their data the quickest almost always wins.
Not All Embedding Is Created Equal
"Embedded analytics" can mean a few different things, with each approach offering a different level of power.
Static Dashboards: The most basic form. You're just dropping a pre-built, non-interactive dashboard into your application. It’s a start, but users can't dig deeper.
Interactive BI: A big step up. Users can filter data, drill down, and explore a predefined dataset. It offers more flexibility but is still limited to what's been prepared ahead of time.
Conversational Analytics: The most advanced and intuitive form. With a Conversational AI Data Analyst like Statspresso, users skip dashboards entirely. Instead, they just ask questions in plain English and get custom charts on the spot.
This conversational approach is the end goal. It cuts out the need for SQL or fiddling with report builders. You just ask your data a question, like you'd ask a colleague.
Try asking Statspresso: "Show me my new signups by acquisition channel this month as a pie chart."
By embedding this capability, you give every user the power to be their own data analyst.
4 Ways to Embed Analytics: Which Approach is Right for You?
Okay, you're convinced. Putting analytics in your application is the way to go. But how do you actually do it? This is a serious architectural decision that impacts your budget, timeline, and customer experience.
Let's walk through the four main ways to get charts and dashboards into your product, without the dense engineering jargon.
1. iFrames: The "Quick and Dirty" Route
An iFrame (or Inline Frame) is the fastest way to get analytics up and running. Think of it as cutting a window in your app's wall and pointing it to your analytics dashboard living on another server. It’s a straightforward approach with minimal developer effort.
The catch? Speed comes at a price. iFrames often feel clunky and disconnected. They can be slow to load, a nightmare to style, and just scream "tacked on." It's a start, but it's rarely a solution that delights customers.
2. JavaScript SDKs: The Balanced Approach
A JavaScript SDK (Software Development Kit) is a big step up from iFrames, offering a much more integrated feel. Instead of a clunky window, your developers get a library of pre-built components they can place more naturally within your application.
This gives you far more control over the look and feel, allowing you to create a cohesive experience that matches your brand. The trade-off is more technical work, but the result is a far more professional and seamless experience.
The Bottom Line: Your integration method is your user experience. A seamless integration feels like a powerful, native feature. A clunky one feels like a cheap add-on.
This decision tree helps visualize the fundamental choice: do you force users to leave your app for insights, or do you bring the insights directly to them?
Embedding keeps users inside your product, making it the one-stop shop for both doing the work and understanding the results.
3. APIs: The Power-User Path
For teams that want serious customization without building everything from the ground up, there are APIs (Application Programming Interfaces). An API-first analytics platform allows your developers to request raw, processed data and then use your own front-end code to render the visualizations.
This gives you fantastic control over the end-user experience while still offloading the heavy lifting of data processing to the vendor. It’s a great middle ground for teams with solid engineering resources who want deep integration.
4. Fully Native: The "Build it Yourself" Mountain
Finally, there’s building a fully native solution. This is the high-effort, high-reward approach. Your team builds the entire analytics feature from scratch—the data connection, the query engine, the front-end charts, everything.
This gives you total, pixel-perfect control. But be warned: this path is extremely expensive and time-consuming, requiring a dedicated team of engineers for the initial build and all ongoing maintenance.
Embedding a tool like Statspresso, a Conversational AI Data Analyst, lets you sidestep this massive development overhead. Instead of building endless charts, you embed a simple chat interface.
Try asking Statspresso: "Compare user retention for customers who onboarded in Q1 vs Q2."
You get the analytical power of a custom solution without the years of development pain. Your users get instant answers, and your engineers stay focused on your core product.
The Build vs. Buy Decision for Analytics
Sooner or later, every product leader hits this fork in the road: do we build that shiny new analytics feature ourselves, or do we buy a solution from someone who lives and breathes this stuff?
At first glance, building it yourself is tempting. The idea of total control, a feature tailored perfectly to your application, is a powerful draw.
But here's the hard truth: building analytics in-house is often a brutal, resource-draining marathon. You're not just whipping up a few charts. You’re signing your engineering team up to create, scale, and forever maintain an entire product inside your main product.
Why Building From Scratch Is a Trap
The real cost of a DIY analytics solution isn't the initial coding sprint; it’s the endless maintenance that follows. Data sources change. Security holes need patching. And your users will inevitably ask for new chart types, filters, and features.
Your homegrown analytics module quickly becomes a hungry mouth that needs constant feeding from your engineering budget.
The "total control" you gain from a custom build often morphs into "total responsibility." Every bug, slowdown, and feature request lands squarely on your team's plate, forever.
This is the slow-burn cost that causes so many in-house analytics projects to eventually stall, leaving behind a clunky, outdated feature nobody loves.
The Conversational AI Advantage
Choosing to "buy" becomes a no-brainer with the rise of conversational analytics. Imagine embedding not just a few static dashboards, but an AI-powered analyst right into your app. This is where a solution like Statspresso, our Conversational AI Data Analyst, creates a huge competitive edge.
Let's break down the trade-offs:
Factor | The Old Way (Manual Build) | The New Way (Statspresso) |
|---|---|---|
Time-to-Market | 9-18+ months | 1-2 weeks |
Initial Cost | Very High (Multiple engineer salaries) | Low (Monthly subscription) |
Ongoing Maintenance | Constant engineering overhead | Zero, handled by vendor |
Feature Upgrades | Requires dedicated dev cycles | Automatic; new features roll out |
Core Focus | Diverted from your main product | Remains on your core product |
The "buy" decision is clear. Instead of trying to predict every question with a pre-built dashboard, you give users the power to ask anything.
Slash Development Time: Embed a single, powerful interface instead of dozens of reports.
Empower Your Users: Customers get instant answers without filing a support ticket.
Future-Proof Your Product: As AI capabilities improve, your analytics feature automatically gets smarter.
For example, you could ask Statspresso: “Show me our top 10 customers by revenue last quarter and what products they bought.”
The build-or-buy debate for analytics has reached a tipping point. With modern solutions that let you skip the SQL and just ask your data a question, the reasons to buy have become too big to ignore.
Embedded Analytics Use Cases That Drive Growth
Theory is great, but how does embedded analytics actually save you time or make you money? The value is in the specific, tangible results it creates when you pull data out of a dusty folder and put it in the middle of the action.
For SaaS companies, this means building customer-facing analytics that prove your app’s value and make it incredibly sticky. For your own teams, it’s about putting a sales dashboard right inside your CRM or marketing charts into your project management tools. No more toggling between a dozen tabs.
The goal is to deliver actionable insights directly within the user's natural workflow, making data a core part of their daily decisions.
Supercharging SaaS Products
One of the most powerful uses is building analytics directly into your own SaaS product. This has a direct impact on two critical metrics: user engagement and churn.
When customers can see the value they're getting—visualized in clear, compelling charts—they are far more likely to stick around.
Marketing Automation Tool: Embed dashboards showing campaign performance and conversion funnels.
Project Management App: Provide charts on team velocity and project completion rates.
E-commerce Platform: Offer real-time sales dashboards and customer lifetime value reports.
Accelerating Internal Teams
Embedded analytics is a massive productivity booster for your internal operations, too.
Why force your sales team to log into a separate BI tool to see their pipeline when you can embed that exact chart directly inside Salesforce? When insights live where decisions are made, you accelerate the entire business.
A marketing agency could embed client performance dashboards into their project management system, slashing manual reporting time by up to 90%. This frees up strategists to strategize, not copy-paste charts. We explore more ways to unlock these efficiencies in our guide to data analytics for startups.
The Conversational Approach in Action
Traditional embedded dashboards are static. A Conversational AI Data Analyst like Statspresso changes the game.
Imagine a product manager who needs to understand new feature performance. Instead of filing a ticket with the data team and waiting, they can just ask a question.
Try asking Statspresso: “Show me user engagement for our new 'Reporting' feature over the last 30 days, segmented by user plan.”
In seconds, they get a chart and a clear answer. This is the future of embedded analytics—it’s not just about presenting data, but enabling a real-time conversation with it.
Your Implementation Checklist For Success
Ready to start? Kicking off an embedded analytics project without a plan is like building a house without a blueprint. This checklist will help you start small, learn quickly, and deliver real value from day one.
1. Define Your "Why"
Before anyone writes a line of code, answer: What specific user pain point are you solving? Are customers stuck exporting CSVs? Are they in the dark about their ROI?
Don't build analytics because it's trendy. Build it because it solves a painful problem for the people who pay you. A strong "why" is your North Star.
Example: "Our users spend 5 hours a month manually building reports. We will embed analytics to give them that time back."
2. Identify The Key Metrics
Resist the temptation to show everything. A cluttered dashboard is a useless dashboard. What are the 3-5 numbers your user needs to see to feel like they're winning?
E-commerce: Revenue, Average Order Value, Customer Lifetime Value.
Project Management: Tasks Completed, On-time Percentage, Team Velocity.
Keep it focused. The goal is immediate clarity, not a mountain of detail.
3. Choose The Right Integration Method
Your integration method shapes your user's experience. Don't default to the quickest option (iFrames) if it creates a clunky feel. A JavaScript SDK or API-first approach often strikes a much better balance.
For the most intuitive experience, consider embedding a Conversational AI Data Analyst like Statspresso. This lets you embed one powerful chat interface instead of building dozens of charts.
4. Design A Seamless User Experience
Your analytics should feel like a natural part of your application, not a bolt-on. Match your existing UI—fonts, colors, button styles. A user should never know where your app ends and the analytics begin.
Put insights right where users need them. A sales performance chart belongs in your CRM's deal view, not buried three clicks deep in a "reports" tab.
5. Plan for Security and Governance
This is non-negotiable. Your chosen solution must support robust security protocols like row-level security. This guarantees users only see the data they are authorized to access, which is crucial for protecting sensitive information and maintaining trust.
6. Define and Measure ROI
How will you know if this project was a success? Define your key performance indicators (KPIs) before you start. Are you trying to:
Reduce churn by 5%?
Increase user engagement by 15%?
Create a new premium upsell tier?
Track these metrics religiously. If you can’t measure the impact, you can’t justify the investment.
Common Questions About Embedded Analytics
When teams first look into embedded analytics, a few key questions always come up. Let's tackle them head-on.
How Is Embedded Analytics Different from Traditional BI?
Traditional BI tools like Tableau or Power BI are separate destinations. Your team has to break their flow, open a new tab, and dig for a report.
Embedded analytics, on the other hand, weaves those insights directly into the applications your teams are already using. It kills context switching and makes data a real-time part of their workflow.
Is It Secure to Embed Analytics in My App?
Absolutely, if you do it right. Modern embedded analytics solutions are built with security at their core. Look for critical features like:
Row-Level Security: Ensures users only see the data they're authorized to see.
Data Masking: Obscures sensitive information while allowing for analysis of underlying trends.
Strict User Permissions: Controls access through your application's existing authentication system.
What Skills Does My Team Need to Implement This?
It depends on whether you "build" or "buy".
If you "buy" a solution, the effort is surprisingly low. You'll need a product manager to map out user needs and a developer for the one-time integration. The vendor handles the heavy lifting.
A "build" approach is a whole different ballgame. It requires a full team of backend engineers, frontend developers, and UI/UX designers, plus an ongoing commitment to maintain it all.
Can Users Actually Ask Their Own Questions?
This is where you see the difference between basic and advanced embedded analytics.
Many basic solutions just embed pre-built, static dashboards. It's a look-but-don't-touch experience.
More advanced platforms, especially a Conversational AI Data Analyst like Statspresso, are built for true data exploration. They empower users to ask questions in plain English and receive custom charts and answers instantly.
It's the difference between giving someone a static map and handing them a GPS that can answer any question about the journey. You're not just embedding a report; you're embedding a data expert.
Ready to move beyond static dashboards and have a real conversation with your data? With Statspresso, our Conversational AI Data Analyst, you can skip the SQL. Just ask your data a question and get a chart in seconds.
Connect your first data source for free and ask your first question.