
Chat with Your Data: Instant Insights, No SQL

Waiting a week for a “quick” metric is still normal in too many companies. By the time the dashboard lands, the question has changed, the campaign has moved on, and your team is back in Slack asking for another pull. Chat with your data fixes that bottleneck. Instead of filing a ticket, you ask a question in plain English and get an answer, chart, or explanation right away. For founders and operators, that changes analytics from a reporting function into a daily decision tool.
What is "Chat with Your Data" Anyway?
Traditional BI asks people to think like databases. Chat with your data flips that around. The software meets the user where they are, in plain language.
A founder asks, “Which channel brought in the highest-value customers last quarter?” A product lead asks, “Did activation improve after the onboarding change?” A marketer asks, “Show paid conversions by campaign as a bar chart.” The system translates that into the right data query and returns the result in a form people can use.
That matters because business teams do not suffer from a lack of dashboards. They suffer from friction. If you want a refresher on how much manual querying still depends on traditional SQL query languages, it is a useful comparison point for why conversational analytics feels so different in practice.
The power of conversational analytics stems from the underlying AI that interprets natural language questions and delivers precise business answers in seconds. If you're interested in how this technology works to transform raw data into actionable intelligence, explore the details of AI-powered insights.
The broader shift is real. Live chat, which helped normalize real-time conversational interfaces, has grown 400% since 2015, and 38% of consumers report making a purchase directly triggered by a chat conversation, according to LiveAgent’s live chat statistics. Different use case, same lesson. When people can ask in the moment and get a relevant answer, they act faster.
It is less like reporting and more like messaging
The simplest analogy is this. Old-school BI is like writing formal letters to your data team. Conversational analytics is like texting your business and getting an answer back.
That does not mean dashboards disappear. It means they stop being the only door into your data.
For teams exploring this category, the move from static reporting to conversational workflows is also part of the broader shift covered in this guide to generative business intelligence.
Old way versus new way
Aspect | The Old Way (Traditional BI) | The New Way (Chat with Your Data) |
|---|---|---|
How questions get asked | Ticket, Slack request, analyst backlog | Plain-English question in a chat box |
Speed | Often delayed by queue time and revisions | Immediate back-and-forth exploration |
Skill required | SQL, dashboard tools, schema knowledge | Business context and a clear question |
Who can use it | Analysts and BI specialists | Founders, PMs, marketers, ops, analysts |
Typical output | Static dashboard or one-off report | Answer, chart, explanation, follow-up prompts |
Best for | Formal reporting and recurring KPIs | Ad hoc analysis and fast decision support |
Practical takeaway: The value is not “AI for AI’s sake.” The value is cutting the distance between a business question and a trusted answer.
What works and what does not
What works:
Specific questions: “Compare this month’s trials to last month by channel.”
Context-rich prompts: “Use closed-won revenue, not booked revenue.”
Follow-up exploration: “Now break that out by region.”
What does not:
Vague prompts: “How’s the business doing?”
Messy metric definitions: If “active user” means three different things internally, the tool cannot rescue that confusion.
Treating it like magic: Good conversational BI still needs good data hygiene.
The big shift is simple. You stop waiting for someone to translate your question into SQL, and start interacting with data the same way you interact with the rest of your software.
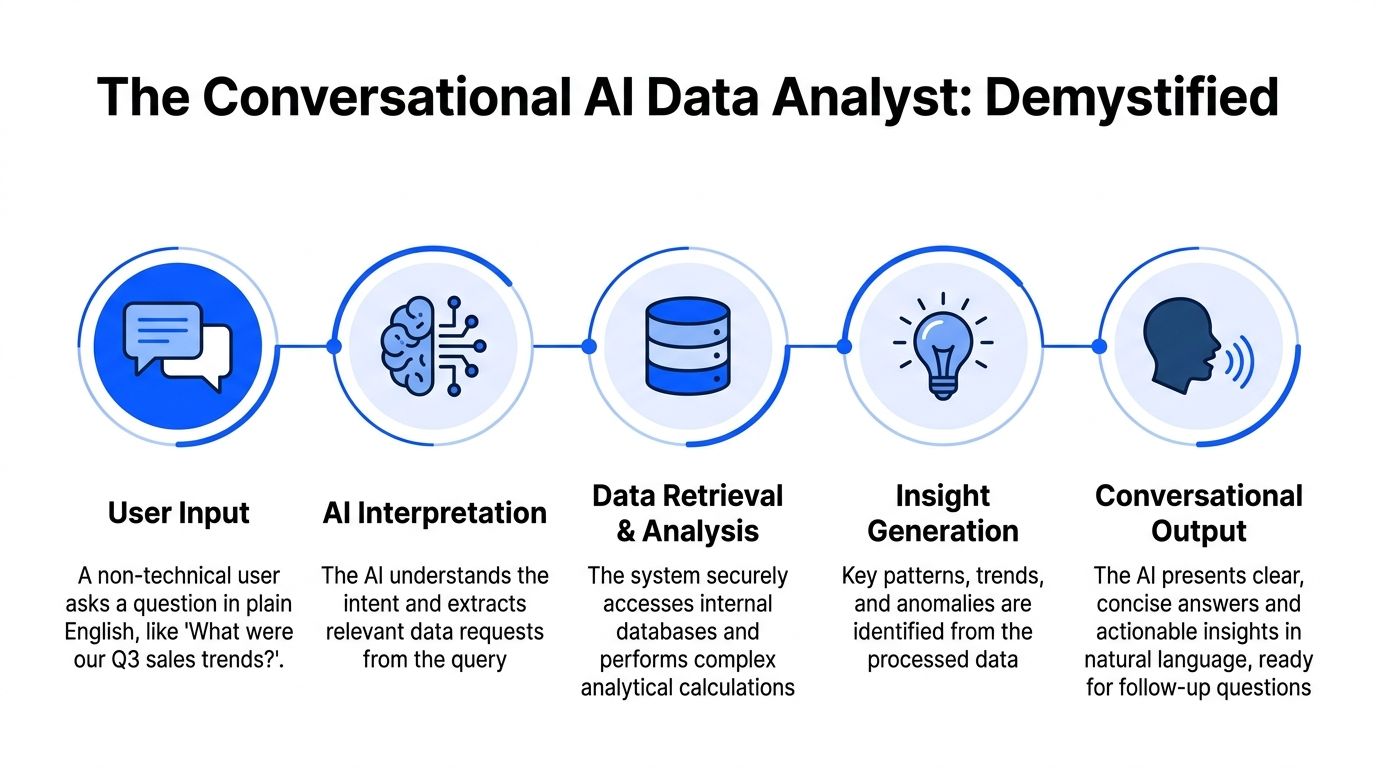
How a Conversational AI Data Analyst Works
The interface looks simple. Under the hood, it is not. That is good news, because the complexity should sit in the product, not on your team.
First, it connects to real systems
A conversational analytics tool is only useful if it can reach the data your team already uses. That usually means connectors into systems like Shopify, HubSpot, product databases, warehouses, and Postgres.
In practice, many buyers should slow down and ask sharper questions at this point. Does the tool read directly from source systems? Does it rely on synced copies? Can it work across multiple sources in one workflow? These details shape how current and trustworthy the answers will be.
Then it translates intent into data operations
A user writes, “Show me top-selling products from last month.” The system has to infer several things:
what “top-selling” means in your business
which source holds the canonical orders table
what date field defines “last month”
whether to sort by units, revenue, or margin
how to present the answer
That translation layer is the difference between a toy demo and a useful workflow. Some teams also compare this capability with broader tools such as an AI Assistant, but analytics-specific products live or die on how well they handle business questions, schemas, joins, and metric definitions.
Grounding is the part that matters most
The fastest way to lose trust is to let the model improvise. Reliable systems ground answers in the underlying data and in the business context around that data.
That is why metadata matters. Alation says its specialized chat agent delivers 60% higher accuracy than generic LLMs by using a metadata knowledge layer that understands table joins and business definitions, as described in Alation’s introduction to Chat with Your Data. Put plainly, the AI does better when it knows what your tables mean.
Rule of thumb: If a tool cannot explain where an answer came from, treat the answer as a draft, not a decision.
Good tools do more than wait for questions
The strongest products are not just reactive. They also surface useful patterns before a user knows what to ask.
Here, a Conversational AI Data Analyst becomes more interesting than a chat box. Instead of only responding to prompts, it can flag trends, anomalies, or changes worth a closer look. That turns analytics into an active workflow rather than a passive search problem.
One example in this category is Statspresso, which connects business data sources, lets users ask plain-English questions, and surfaces patterns through an AI Insight Gallery. That combination matters because teams often need both modes: direct answers when they know the question, and discovery support when they do not.
The workflow is simple for the user
From the user’s perspective, it feels like this:
Ask a question
Get an answer or chart
Refine with follow-ups
Share the result
That simplicity is the whole point. The hard parts are schema awareness, data retrieval, and guardrails. If those are solid, the experience feels obvious. If they are not, you get fast nonsense.
Practical Use Cases and Sample Queries
The easiest way to understand chat with your data is to look at the questions people already ask in meetings. Most of them are not complex. They are just urgent.
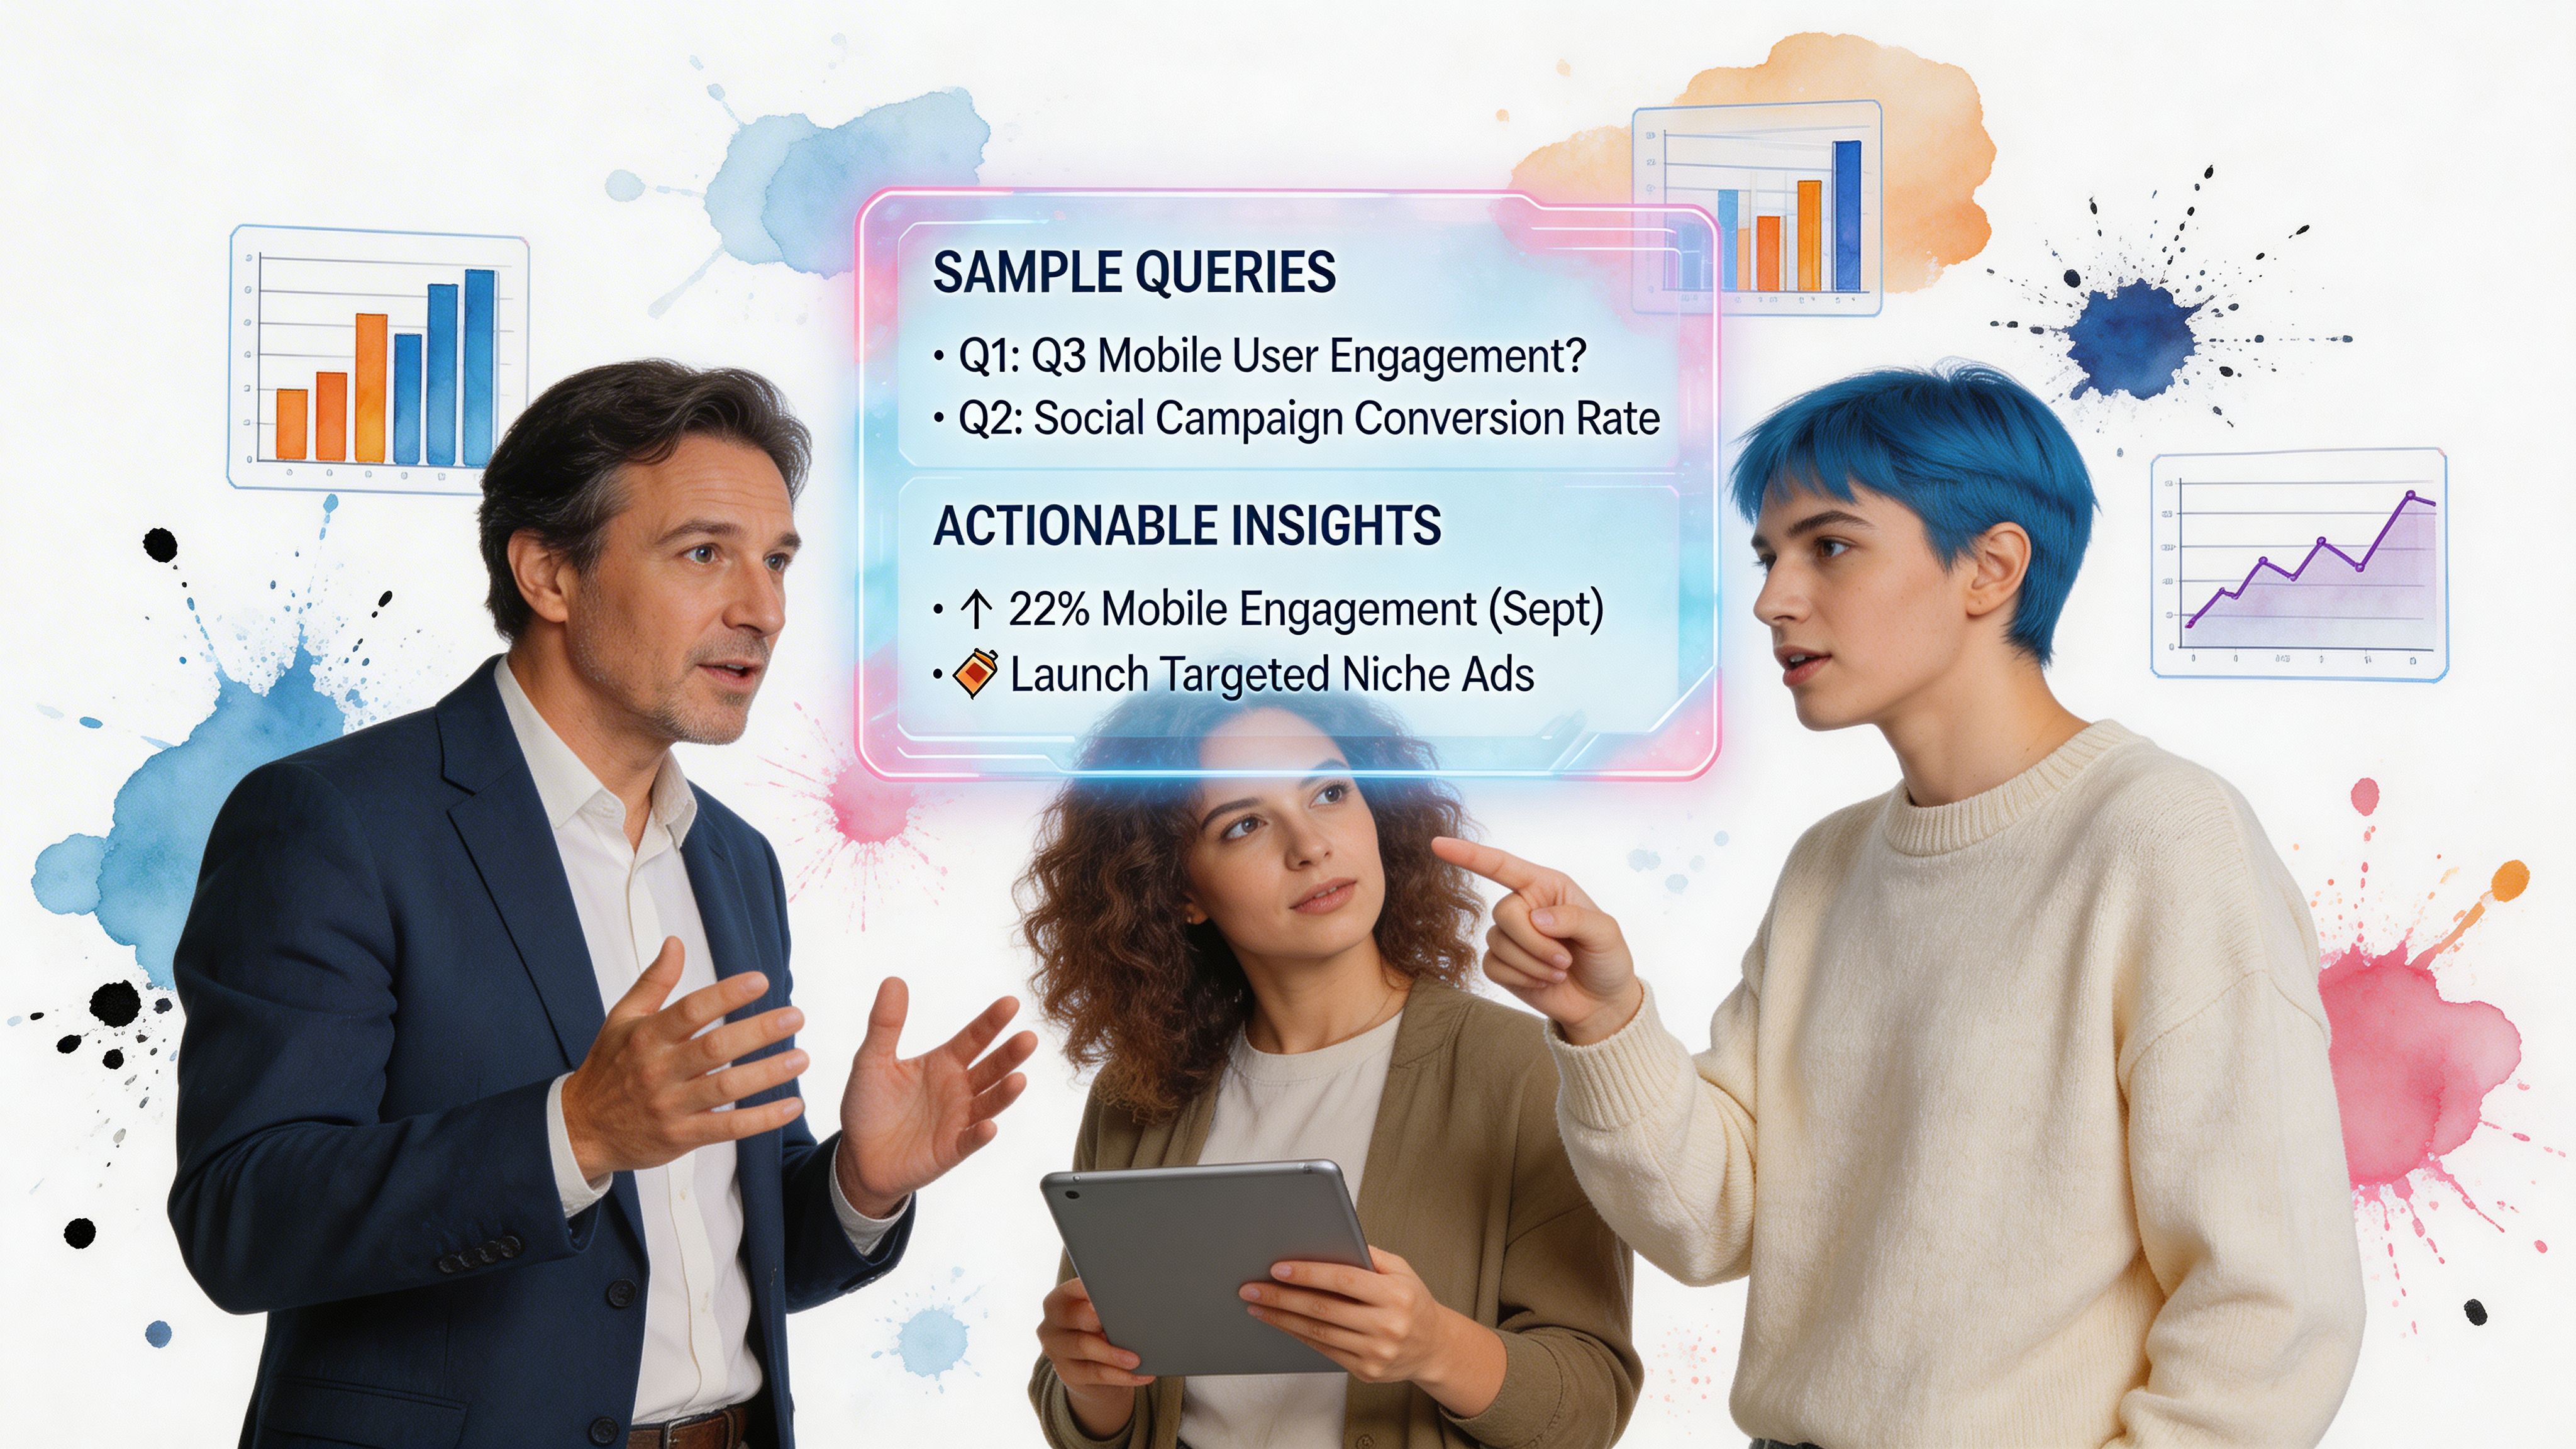
The appeal of this workflow is not theoretical. Since its launch in 2022, ChatGPT helped popularize no-code exploratory analysis by letting non-technical users upload CSVs, generate summaries, and spot trends without writing code, as shown in this video on using ChatGPT for data analysis. That same behavior now shows up inside business analytics workflows.
For founders
Founders usually want signal, not a dissertation. They need a quick read on performance, momentum, and risk.
Useful prompts:
Try asking: “Show monthly revenue for the last year as a bar chart.”
Try asking: “Which customer segments have the highest average order value?”
Try asking: “Compare churn this quarter versus last quarter.”
Try asking: “What changed in pipeline conversion over the last 30 days?”
What works best for founders is starting broad, then drilling in. Ask for the chart first. Ask “why” second.
For product managers
PMs live in the gap between feature launches and user behavior. Conversational analytics helps them check adoption without opening five tabs and waiting on an analyst.
Examples:
“Show feature adoption by cohort since the new onboarding flow launched.”
“Which steps in onboarding have the highest drop-off?”
“Compare activation rates for users acquired before and after the pricing update.”
“Break weekly active users down by plan type.”
Tip: PMs get better answers when they specify the event names or business definitions they care about. “Activation” is often a debate disguised as a metric.
For marketing leads
Marketers need fast feedback loops. They do not want another dashboard. They want to know what to do next.
Prompts worth copying:
Try asking: “Show conversion rate by channel for this month.”
Try asking: “Which campaigns influenced the most closed-won revenue?”
Try asking: “Compare CAC trends by source over the last six months.”
Try asking: “Plot leads, opportunities, and customers by campaign in one view.”
For operators and finance-minded teams
Operations and finance teams often use chat with your data for exception-finding, trend checks, and board-prep questions.
A few high-value prompts:
“Which regions are missing their sales targets this month?”
“Show refund trends by product line.”
“List customers with declining usage and open support tickets.”
“Compare gross margin by product family.”
What these prompts have in common
They all do three things well:
They ask one business question at a time
They use terms the company already uses
They invite a follow-up
That follow-up is where significant time savings occur. A normal BI process might answer the first question tomorrow. A conversational workflow lets you immediately ask, “Now split that by plan,” or “Show me only enterprise accounts.”
That is the point. Skip the SQL. Just ask your data a question and get a chart in seconds.
Key Implementation Considerations
Smart teams do not get stuck on “Can this work?” They ask, “Can this work safely, consistently, and without creating a governance mess?”

That is the right posture. Conversational analytics is powerful, but sloppy implementation creates risk fast.
Security is not a checkbox
A lot of teams focus on the demo and ignore the permission model. That is backwards.
According to Microsoft Fabric’s discussion of SaaS databases and chat experiences, a 2025 Gartner report found that 75% of enterprises using natural language query tools faced compliance incidents due to poor access controls. That is the stat that should make every buyer ask harder questions about governance and auditability in Microsoft Fabric’s chat with your data discussion.
Questions worth asking vendors:
Access controls: Does the tool respect existing permissions and row-level rules?
Auditability: Can admins review what was asked and how data was accessed?
Data handling: Is the system using read-only connections where appropriate?
Workspace separation: Can one team’s data stay isolated from another’s?
Data modeling still matters
Chat interfaces reduce friction. They do not erase bad data.
If your CRM has duplicate accounts, your event taxonomy is inconsistent, and your “revenue” field means three different things depending on the team, the chat layer will expose those problems quickly. That is not a bug. It is a very efficient truth-telling machine.
Clean naming, documented metrics, and sensible source-of-truth decisions make the experience dramatically better. In real projects, this is usually the hidden lever behind trust.
Practical advice: Before rollout, define a short metric glossary for the questions leaders ask most often. Start with revenue, pipeline, churn, activation, and conversion.
Governance determines whether people trust the answers
Governance sounds boring until the wrong person sees payroll data or the CEO gets two different answers to the same question.
The best implementations do a few things well:
Limit scope early: Start with a handful of trusted data sources.
Publish approved definitions: Make it clear what key business terms mean.
Review query traces: Spot recurring confusion and tighten the model.
Separate exploration from official reporting: Let people ask freely, but keep board metrics governed.
What works in the field
The teams that succeed usually launch with one department, one clear use case, and a narrow set of trusted metrics.
What fails is the “connect everything and let’s see what happens” approach. That sounds fast. It usually creates noise, internal debate, and a trust problem that takes longer to unwind than the initial rollout would have taken.
Driving Adoption and Measuring Your ROI
Buying the tool is easy. Getting people to change habits is the primary project.
A conversational analytics rollout works best when you treat it like a workflow change, not a software install. The goal is not “team has access.” The goal is “team asks better questions, more often, without waiting in line.”
Start with one painful question
Pick a question that currently causes delay, repetition, or meeting churn.
Good pilot examples:
Founder reporting: weekly revenue and pipeline checks
Marketing: campaign performance by channel
Product: feature adoption after launch
Then give a small group permission to use the tool in live work. Not as homework. In real meetings, real planning sessions, real handoffs.
Train people on prompts, not features
Most non-technical users do not need a tour of every button. They need examples they can steal.
Create a short starter pack:
Executive prompt: “Show revenue by month for the last year.”
Marketing prompt: “Compare conversions by source this quarter.”
Product prompt: “Which onboarding step has the biggest drop-off?”
That kind of onboarding drives behavior faster than a generic platform demo.
Helpful habit: Save strong prompts from early users and turn them into a shared team library. Good questions spread.
Measure speed, confidence, and actual usage
If you want a business case, track operational change.
Microsoft reports that users completed business tasks 52% faster and 36% more accurately with conversational AI assistance, according to its own research in the Fabric ecosystem. That is a useful benchmark for the kind of efficiency gains teams aim for when they move repetitive analysis into chat.
For your own rollout, focus on measures like:
Time to insight: How long does it take to answer common business questions now?
Analyst interruption load: Are fewer basic requests hitting your BI team?
Adoption outside data roles: Are founders, PMs, and marketers using it?
Decision support: Are charts from the tool showing up in planning and review meetings?
What ROI really looks like
The biggest return is not “we asked the bot many questions.” It is that fewer decisions stall out waiting for analysis, and your analysts spend less time on repetitive pulls.
When chat with your data works, analysts move up the value chain. They do less dashboard babysitting and more definition-setting, model design, and strategic analysis. That is a better operating model for everyone.
Get Started and Key Takeaways
TL;DR
Traditional BI is too slow for daily decisions. Waiting on tickets and dashboard revisions creates drag.
Chat with your data removes that drag. People ask questions in plain English and get answers, charts, and follow-ups quickly.
Grounding matters more than flashy demos. Reliable systems use real business context, metadata, and governed sources.
Implementation is where smart teams win. Security, permissions, metric definitions, and auditability decide whether the tool becomes trusted.
Adoption needs a plan. Start with a small pilot, a few high-value questions, and clear examples users can copy.
The right outcome is operational. Faster answers, fewer analyst interruptions, and broader access to usable insight.
If your team already has the data but still waits too long to use it, this workflow is worth testing. Start small. Connect one trusted source. Ask a question your team asks every week. Then see whether the answer arrives fast enough, clearly enough, and safely enough to change how you work.
Connect your first data source in Statspresso and ask your first question. If you want a practical way to skip the SQL and work from plain-English prompts, it is a straightforward place to test whether a Conversational AI Data Analyst fits your team’s workflow.
Waiting a week for a “quick” metric is still normal in too many companies. By the time the dashboard lands, the question has changed, the campaign has moved on, and your team is back in Slack asking for another pull. Chat with your data fixes that bottleneck. Instead of filing a ticket, you ask a question in plain English and get an answer, chart, or explanation right away. For founders and operators, that changes analytics from a reporting function into a daily decision tool.
What is "Chat with Your Data" Anyway?
Traditional BI asks people to think like databases. Chat with your data flips that around. The software meets the user where they are, in plain language.
A founder asks, “Which channel brought in the highest-value customers last quarter?” A product lead asks, “Did activation improve after the onboarding change?” A marketer asks, “Show paid conversions by campaign as a bar chart.” The system translates that into the right data query and returns the result in a form people can use.
That matters because business teams do not suffer from a lack of dashboards. They suffer from friction. If you want a refresher on how much manual querying still depends on traditional SQL query languages, it is a useful comparison point for why conversational analytics feels so different in practice.
The power of conversational analytics stems from the underlying AI that interprets natural language questions and delivers precise business answers in seconds. If you're interested in how this technology works to transform raw data into actionable intelligence, explore the details of AI-powered insights.
The broader shift is real. Live chat, which helped normalize real-time conversational interfaces, has grown 400% since 2015, and 38% of consumers report making a purchase directly triggered by a chat conversation, according to LiveAgent’s live chat statistics. Different use case, same lesson. When people can ask in the moment and get a relevant answer, they act faster.
It is less like reporting and more like messaging
The simplest analogy is this. Old-school BI is like writing formal letters to your data team. Conversational analytics is like texting your business and getting an answer back.
That does not mean dashboards disappear. It means they stop being the only door into your data.
For teams exploring this category, the move from static reporting to conversational workflows is also part of the broader shift covered in this guide to generative business intelligence.
Old way versus new way
Aspect | The Old Way (Traditional BI) | The New Way (Chat with Your Data) |
|---|---|---|
How questions get asked | Ticket, Slack request, analyst backlog | Plain-English question in a chat box |
Speed | Often delayed by queue time and revisions | Immediate back-and-forth exploration |
Skill required | SQL, dashboard tools, schema knowledge | Business context and a clear question |
Who can use it | Analysts and BI specialists | Founders, PMs, marketers, ops, analysts |
Typical output | Static dashboard or one-off report | Answer, chart, explanation, follow-up prompts |
Best for | Formal reporting and recurring KPIs | Ad hoc analysis and fast decision support |
Practical takeaway: The value is not “AI for AI’s sake.” The value is cutting the distance between a business question and a trusted answer.
What works and what does not
What works:
Specific questions: “Compare this month’s trials to last month by channel.”
Context-rich prompts: “Use closed-won revenue, not booked revenue.”
Follow-up exploration: “Now break that out by region.”
What does not:
Vague prompts: “How’s the business doing?”
Messy metric definitions: If “active user” means three different things internally, the tool cannot rescue that confusion.
Treating it like magic: Good conversational BI still needs good data hygiene.
The big shift is simple. You stop waiting for someone to translate your question into SQL, and start interacting with data the same way you interact with the rest of your software.
How a Conversational AI Data Analyst Works
The interface looks simple. Under the hood, it is not. That is good news, because the complexity should sit in the product, not on your team.

First, it connects to real systems
A conversational analytics tool is only useful if it can reach the data your team already uses. That usually means connectors into systems like Shopify, HubSpot, product databases, warehouses, and Postgres.
In practice, many buyers should slow down and ask sharper questions at this point. Does the tool read directly from source systems? Does it rely on synced copies? Can it work across multiple sources in one workflow? These details shape how current and trustworthy the answers will be.
Then it translates intent into data operations
A user writes, “Show me top-selling products from last month.” The system has to infer several things:
what “top-selling” means in your business
which source holds the canonical orders table
what date field defines “last month”
whether to sort by units, revenue, or margin
how to present the answer
That translation layer is the difference between a toy demo and a useful workflow. Some teams also compare this capability with broader tools such as an AI Assistant, but analytics-specific products live or die on how well they handle business questions, schemas, joins, and metric definitions.
Grounding is the part that matters most
The fastest way to lose trust is to let the model improvise. Reliable systems ground answers in the underlying data and in the business context around that data.
That is why metadata matters. Alation says its specialized chat agent delivers 60% higher accuracy than generic LLMs by using a metadata knowledge layer that understands table joins and business definitions, as described in Alation’s introduction to Chat with Your Data. Put plainly, the AI does better when it knows what your tables mean.
Rule of thumb: If a tool cannot explain where an answer came from, treat the answer as a draft, not a decision.
Good tools do more than wait for questions
The strongest products are not just reactive. They also surface useful patterns before a user knows what to ask.
Here, a Conversational AI Data Analyst becomes more interesting than a chat box. Instead of only responding to prompts, it can flag trends, anomalies, or changes worth a closer look. That turns analytics into an active workflow rather than a passive search problem.
One example in this category is Statspresso, which connects business data sources, lets users ask plain-English questions, and surfaces patterns through an AI Insight Gallery. That combination matters because teams often need both modes: direct answers when they know the question, and discovery support when they do not.
The workflow is simple for the user
From the user’s perspective, it feels like this:
Ask a question
Get an answer or chart
Refine with follow-ups
Share the result
That simplicity is the whole point. The hard parts are schema awareness, data retrieval, and guardrails. If those are solid, the experience feels obvious. If they are not, you get fast nonsense.
Practical Use Cases and Sample Queries
The easiest way to understand chat with your data is to look at the questions people already ask in meetings. Most of them are not complex. They are just urgent.

The appeal of this workflow is not theoretical. Since its launch in 2022, ChatGPT helped popularize no-code exploratory analysis by letting non-technical users upload CSVs, generate summaries, and spot trends without writing code, as shown in this video on using ChatGPT for data analysis. That same behavior now shows up inside business analytics workflows.
For founders
Founders usually want signal, not a dissertation. They need a quick read on performance, momentum, and risk.
Useful prompts:
Try asking: “Show monthly revenue for the last year as a bar chart.”
Try asking: “Which customer segments have the highest average order value?”
Try asking: “Compare churn this quarter versus last quarter.”
Try asking: “What changed in pipeline conversion over the last 30 days?”
What works best for founders is starting broad, then drilling in. Ask for the chart first. Ask “why” second.
For product managers
PMs live in the gap between feature launches and user behavior. Conversational analytics helps them check adoption without opening five tabs and waiting on an analyst.
Examples:
“Show feature adoption by cohort since the new onboarding flow launched.”
“Which steps in onboarding have the highest drop-off?”
“Compare activation rates for users acquired before and after the pricing update.”
“Break weekly active users down by plan type.”
Tip: PMs get better answers when they specify the event names or business definitions they care about. “Activation” is often a debate disguised as a metric.
For marketing leads
Marketers need fast feedback loops. They do not want another dashboard. They want to know what to do next.
Prompts worth copying:
Try asking: “Show conversion rate by channel for this month.”
Try asking: “Which campaigns influenced the most closed-won revenue?”
Try asking: “Compare CAC trends by source over the last six months.”
Try asking: “Plot leads, opportunities, and customers by campaign in one view.”
For operators and finance-minded teams
Operations and finance teams often use chat with your data for exception-finding, trend checks, and board-prep questions.
A few high-value prompts:
“Which regions are missing their sales targets this month?”
“Show refund trends by product line.”
“List customers with declining usage and open support tickets.”
“Compare gross margin by product family.”
What these prompts have in common
They all do three things well:
They ask one business question at a time
They use terms the company already uses
They invite a follow-up
That follow-up is where significant time savings occur. A normal BI process might answer the first question tomorrow. A conversational workflow lets you immediately ask, “Now split that by plan,” or “Show me only enterprise accounts.”
That is the point. Skip the SQL. Just ask your data a question and get a chart in seconds.
Key Implementation Considerations
Smart teams do not get stuck on “Can this work?” They ask, “Can this work safely, consistently, and without creating a governance mess?”

That is the right posture. Conversational analytics is powerful, but sloppy implementation creates risk fast.
Security is not a checkbox
A lot of teams focus on the demo and ignore the permission model. That is backwards.
According to Microsoft Fabric’s discussion of SaaS databases and chat experiences, a 2025 Gartner report found that 75% of enterprises using natural language query tools faced compliance incidents due to poor access controls. That is the stat that should make every buyer ask harder questions about governance and auditability in Microsoft Fabric’s chat with your data discussion.
Questions worth asking vendors:
Access controls: Does the tool respect existing permissions and row-level rules?
Auditability: Can admins review what was asked and how data was accessed?
Data handling: Is the system using read-only connections where appropriate?
Workspace separation: Can one team’s data stay isolated from another’s?
Data modeling still matters
Chat interfaces reduce friction. They do not erase bad data.
If your CRM has duplicate accounts, your event taxonomy is inconsistent, and your “revenue” field means three different things depending on the team, the chat layer will expose those problems quickly. That is not a bug. It is a very efficient truth-telling machine.
Clean naming, documented metrics, and sensible source-of-truth decisions make the experience dramatically better. In real projects, this is usually the hidden lever behind trust.
Practical advice: Before rollout, define a short metric glossary for the questions leaders ask most often. Start with revenue, pipeline, churn, activation, and conversion.
Governance determines whether people trust the answers
Governance sounds boring until the wrong person sees payroll data or the CEO gets two different answers to the same question.
The best implementations do a few things well:
Limit scope early: Start with a handful of trusted data sources.
Publish approved definitions: Make it clear what key business terms mean.
Review query traces: Spot recurring confusion and tighten the model.
Separate exploration from official reporting: Let people ask freely, but keep board metrics governed.
What works in the field
The teams that succeed usually launch with one department, one clear use case, and a narrow set of trusted metrics.
What fails is the “connect everything and let’s see what happens” approach. That sounds fast. It usually creates noise, internal debate, and a trust problem that takes longer to unwind than the initial rollout would have taken.
Driving Adoption and Measuring Your ROI
Buying the tool is easy. Getting people to change habits is the primary project.
A conversational analytics rollout works best when you treat it like a workflow change, not a software install. The goal is not “team has access.” The goal is “team asks better questions, more often, without waiting in line.”
Start with one painful question
Pick a question that currently causes delay, repetition, or meeting churn.
Good pilot examples:
Founder reporting: weekly revenue and pipeline checks
Marketing: campaign performance by channel
Product: feature adoption after launch
Then give a small group permission to use the tool in live work. Not as homework. In real meetings, real planning sessions, real handoffs.
Train people on prompts, not features
Most non-technical users do not need a tour of every button. They need examples they can steal.
Create a short starter pack:
Executive prompt: “Show revenue by month for the last year.”
Marketing prompt: “Compare conversions by source this quarter.”
Product prompt: “Which onboarding step has the biggest drop-off?”
That kind of onboarding drives behavior faster than a generic platform demo.
Helpful habit: Save strong prompts from early users and turn them into a shared team library. Good questions spread.
Measure speed, confidence, and actual usage
If you want a business case, track operational change.
Microsoft reports that users completed business tasks 52% faster and 36% more accurately with conversational AI assistance, according to its own research in the Fabric ecosystem. That is a useful benchmark for the kind of efficiency gains teams aim for when they move repetitive analysis into chat.
For your own rollout, focus on measures like:
Time to insight: How long does it take to answer common business questions now?
Analyst interruption load: Are fewer basic requests hitting your BI team?
Adoption outside data roles: Are founders, PMs, and marketers using it?
Decision support: Are charts from the tool showing up in planning and review meetings?
What ROI really looks like
The biggest return is not “we asked the bot many questions.” It is that fewer decisions stall out waiting for analysis, and your analysts spend less time on repetitive pulls.
When chat with your data works, analysts move up the value chain. They do less dashboard babysitting and more definition-setting, model design, and strategic analysis. That is a better operating model for everyone.
Get Started and Key Takeaways
TL;DR
Traditional BI is too slow for daily decisions. Waiting on tickets and dashboard revisions creates drag.
Chat with your data removes that drag. People ask questions in plain English and get answers, charts, and follow-ups quickly.
Grounding matters more than flashy demos. Reliable systems use real business context, metadata, and governed sources.
Implementation is where smart teams win. Security, permissions, metric definitions, and auditability decide whether the tool becomes trusted.
Adoption needs a plan. Start with a small pilot, a few high-value questions, and clear examples users can copy.
The right outcome is operational. Faster answers, fewer analyst interruptions, and broader access to usable insight.
If your team already has the data but still waits too long to use it, this workflow is worth testing. Start small. Connect one trusted source. Ask a question your team asks every week. Then see whether the answer arrives fast enough, clearly enough, and safely enough to change how you work.
Connect your first data source in Statspresso and ask your first question. If you want a practical way to skip the SQL and work from plain-English prompts, it is a straightforward place to test whether a Conversational AI Data Analyst fits your team’s workflow.
Waiting a week for a “quick” metric is still normal in too many companies. By the time the dashboard lands, the question has changed, the campaign has moved on, and your team is back in Slack asking for another pull. Chat with your data fixes that bottleneck. Instead of filing a ticket, you ask a question in plain English and get an answer, chart, or explanation right away. For founders and operators, that changes analytics from a reporting function into a daily decision tool.
What is "Chat with Your Data" Anyway?
Traditional BI asks people to think like databases. Chat with your data flips that around. The software meets the user where they are, in plain language.
A founder asks, “Which channel brought in the highest-value customers last quarter?” A product lead asks, “Did activation improve after the onboarding change?” A marketer asks, “Show paid conversions by campaign as a bar chart.” The system translates that into the right data query and returns the result in a form people can use.
That matters because business teams do not suffer from a lack of dashboards. They suffer from friction. If you want a refresher on how much manual querying still depends on traditional SQL query languages, it is a useful comparison point for why conversational analytics feels so different in practice.
The power of conversational analytics stems from the underlying AI that interprets natural language questions and delivers precise business answers in seconds. If you're interested in how this technology works to transform raw data into actionable intelligence, explore the details of AI-powered insights.
The broader shift is real. Live chat, which helped normalize real-time conversational interfaces, has grown 400% since 2015, and 38% of consumers report making a purchase directly triggered by a chat conversation, according to LiveAgent’s live chat statistics. Different use case, same lesson. When people can ask in the moment and get a relevant answer, they act faster.
It is less like reporting and more like messaging
The simplest analogy is this. Old-school BI is like writing formal letters to your data team. Conversational analytics is like texting your business and getting an answer back.
That does not mean dashboards disappear. It means they stop being the only door into your data.
For teams exploring this category, the move from static reporting to conversational workflows is also part of the broader shift covered in this guide to generative business intelligence.
Old way versus new way
Aspect | The Old Way (Traditional BI) | The New Way (Chat with Your Data) |
|---|---|---|
How questions get asked | Ticket, Slack request, analyst backlog | Plain-English question in a chat box |
Speed | Often delayed by queue time and revisions | Immediate back-and-forth exploration |
Skill required | SQL, dashboard tools, schema knowledge | Business context and a clear question |
Who can use it | Analysts and BI specialists | Founders, PMs, marketers, ops, analysts |
Typical output | Static dashboard or one-off report | Answer, chart, explanation, follow-up prompts |
Best for | Formal reporting and recurring KPIs | Ad hoc analysis and fast decision support |
Practical takeaway: The value is not “AI for AI’s sake.” The value is cutting the distance between a business question and a trusted answer.
What works and what does not
What works:
Specific questions: “Compare this month’s trials to last month by channel.”
Context-rich prompts: “Use closed-won revenue, not booked revenue.”
Follow-up exploration: “Now break that out by region.”
What does not:
Vague prompts: “How’s the business doing?”
Messy metric definitions: If “active user” means three different things internally, the tool cannot rescue that confusion.
Treating it like magic: Good conversational BI still needs good data hygiene.
The big shift is simple. You stop waiting for someone to translate your question into SQL, and start interacting with data the same way you interact with the rest of your software.
How a Conversational AI Data Analyst Works
The interface looks simple. Under the hood, it is not. That is good news, because the complexity should sit in the product, not on your team.

First, it connects to real systems
A conversational analytics tool is only useful if it can reach the data your team already uses. That usually means connectors into systems like Shopify, HubSpot, product databases, warehouses, and Postgres.
In practice, many buyers should slow down and ask sharper questions at this point. Does the tool read directly from source systems? Does it rely on synced copies? Can it work across multiple sources in one workflow? These details shape how current and trustworthy the answers will be.
Then it translates intent into data operations
A user writes, “Show me top-selling products from last month.” The system has to infer several things:
what “top-selling” means in your business
which source holds the canonical orders table
what date field defines “last month”
whether to sort by units, revenue, or margin
how to present the answer
That translation layer is the difference between a toy demo and a useful workflow. Some teams also compare this capability with broader tools such as an AI Assistant, but analytics-specific products live or die on how well they handle business questions, schemas, joins, and metric definitions.
Grounding is the part that matters most
The fastest way to lose trust is to let the model improvise. Reliable systems ground answers in the underlying data and in the business context around that data.
That is why metadata matters. Alation says its specialized chat agent delivers 60% higher accuracy than generic LLMs by using a metadata knowledge layer that understands table joins and business definitions, as described in Alation’s introduction to Chat with Your Data. Put plainly, the AI does better when it knows what your tables mean.
Rule of thumb: If a tool cannot explain where an answer came from, treat the answer as a draft, not a decision.
Good tools do more than wait for questions
The strongest products are not just reactive. They also surface useful patterns before a user knows what to ask.
Here, a Conversational AI Data Analyst becomes more interesting than a chat box. Instead of only responding to prompts, it can flag trends, anomalies, or changes worth a closer look. That turns analytics into an active workflow rather than a passive search problem.
One example in this category is Statspresso, which connects business data sources, lets users ask plain-English questions, and surfaces patterns through an AI Insight Gallery. That combination matters because teams often need both modes: direct answers when they know the question, and discovery support when they do not.
The workflow is simple for the user
From the user’s perspective, it feels like this:
Ask a question
Get an answer or chart
Refine with follow-ups
Share the result
That simplicity is the whole point. The hard parts are schema awareness, data retrieval, and guardrails. If those are solid, the experience feels obvious. If they are not, you get fast nonsense.
Practical Use Cases and Sample Queries
The easiest way to understand chat with your data is to look at the questions people already ask in meetings. Most of them are not complex. They are just urgent.

The appeal of this workflow is not theoretical. Since its launch in 2022, ChatGPT helped popularize no-code exploratory analysis by letting non-technical users upload CSVs, generate summaries, and spot trends without writing code, as shown in this video on using ChatGPT for data analysis. That same behavior now shows up inside business analytics workflows.
For founders
Founders usually want signal, not a dissertation. They need a quick read on performance, momentum, and risk.
Useful prompts:
Try asking: “Show monthly revenue for the last year as a bar chart.”
Try asking: “Which customer segments have the highest average order value?”
Try asking: “Compare churn this quarter versus last quarter.”
Try asking: “What changed in pipeline conversion over the last 30 days?”
What works best for founders is starting broad, then drilling in. Ask for the chart first. Ask “why” second.
For product managers
PMs live in the gap between feature launches and user behavior. Conversational analytics helps them check adoption without opening five tabs and waiting on an analyst.
Examples:
“Show feature adoption by cohort since the new onboarding flow launched.”
“Which steps in onboarding have the highest drop-off?”
“Compare activation rates for users acquired before and after the pricing update.”
“Break weekly active users down by plan type.”
Tip: PMs get better answers when they specify the event names or business definitions they care about. “Activation” is often a debate disguised as a metric.
For marketing leads
Marketers need fast feedback loops. They do not want another dashboard. They want to know what to do next.
Prompts worth copying:
Try asking: “Show conversion rate by channel for this month.”
Try asking: “Which campaigns influenced the most closed-won revenue?”
Try asking: “Compare CAC trends by source over the last six months.”
Try asking: “Plot leads, opportunities, and customers by campaign in one view.”
For operators and finance-minded teams
Operations and finance teams often use chat with your data for exception-finding, trend checks, and board-prep questions.
A few high-value prompts:
“Which regions are missing their sales targets this month?”
“Show refund trends by product line.”
“List customers with declining usage and open support tickets.”
“Compare gross margin by product family.”
What these prompts have in common
They all do three things well:
They ask one business question at a time
They use terms the company already uses
They invite a follow-up
That follow-up is where significant time savings occur. A normal BI process might answer the first question tomorrow. A conversational workflow lets you immediately ask, “Now split that by plan,” or “Show me only enterprise accounts.”
That is the point. Skip the SQL. Just ask your data a question and get a chart in seconds.
Key Implementation Considerations
Smart teams do not get stuck on “Can this work?” They ask, “Can this work safely, consistently, and without creating a governance mess?”

That is the right posture. Conversational analytics is powerful, but sloppy implementation creates risk fast.
Security is not a checkbox
A lot of teams focus on the demo and ignore the permission model. That is backwards.
According to Microsoft Fabric’s discussion of SaaS databases and chat experiences, a 2025 Gartner report found that 75% of enterprises using natural language query tools faced compliance incidents due to poor access controls. That is the stat that should make every buyer ask harder questions about governance and auditability in Microsoft Fabric’s chat with your data discussion.
Questions worth asking vendors:
Access controls: Does the tool respect existing permissions and row-level rules?
Auditability: Can admins review what was asked and how data was accessed?
Data handling: Is the system using read-only connections where appropriate?
Workspace separation: Can one team’s data stay isolated from another’s?
Data modeling still matters
Chat interfaces reduce friction. They do not erase bad data.
If your CRM has duplicate accounts, your event taxonomy is inconsistent, and your “revenue” field means three different things depending on the team, the chat layer will expose those problems quickly. That is not a bug. It is a very efficient truth-telling machine.
Clean naming, documented metrics, and sensible source-of-truth decisions make the experience dramatically better. In real projects, this is usually the hidden lever behind trust.
Practical advice: Before rollout, define a short metric glossary for the questions leaders ask most often. Start with revenue, pipeline, churn, activation, and conversion.
Governance determines whether people trust the answers
Governance sounds boring until the wrong person sees payroll data or the CEO gets two different answers to the same question.
The best implementations do a few things well:
Limit scope early: Start with a handful of trusted data sources.
Publish approved definitions: Make it clear what key business terms mean.
Review query traces: Spot recurring confusion and tighten the model.
Separate exploration from official reporting: Let people ask freely, but keep board metrics governed.
What works in the field
The teams that succeed usually launch with one department, one clear use case, and a narrow set of trusted metrics.
What fails is the “connect everything and let’s see what happens” approach. That sounds fast. It usually creates noise, internal debate, and a trust problem that takes longer to unwind than the initial rollout would have taken.
Driving Adoption and Measuring Your ROI
Buying the tool is easy. Getting people to change habits is the primary project.
A conversational analytics rollout works best when you treat it like a workflow change, not a software install. The goal is not “team has access.” The goal is “team asks better questions, more often, without waiting in line.”
Start with one painful question
Pick a question that currently causes delay, repetition, or meeting churn.
Good pilot examples:
Founder reporting: weekly revenue and pipeline checks
Marketing: campaign performance by channel
Product: feature adoption after launch
Then give a small group permission to use the tool in live work. Not as homework. In real meetings, real planning sessions, real handoffs.
Train people on prompts, not features
Most non-technical users do not need a tour of every button. They need examples they can steal.
Create a short starter pack:
Executive prompt: “Show revenue by month for the last year.”
Marketing prompt: “Compare conversions by source this quarter.”
Product prompt: “Which onboarding step has the biggest drop-off?”
That kind of onboarding drives behavior faster than a generic platform demo.
Helpful habit: Save strong prompts from early users and turn them into a shared team library. Good questions spread.
Measure speed, confidence, and actual usage
If you want a business case, track operational change.
Microsoft reports that users completed business tasks 52% faster and 36% more accurately with conversational AI assistance, according to its own research in the Fabric ecosystem. That is a useful benchmark for the kind of efficiency gains teams aim for when they move repetitive analysis into chat.
For your own rollout, focus on measures like:
Time to insight: How long does it take to answer common business questions now?
Analyst interruption load: Are fewer basic requests hitting your BI team?
Adoption outside data roles: Are founders, PMs, and marketers using it?
Decision support: Are charts from the tool showing up in planning and review meetings?
What ROI really looks like
The biggest return is not “we asked the bot many questions.” It is that fewer decisions stall out waiting for analysis, and your analysts spend less time on repetitive pulls.
When chat with your data works, analysts move up the value chain. They do less dashboard babysitting and more definition-setting, model design, and strategic analysis. That is a better operating model for everyone.
Get Started and Key Takeaways
TL;DR
Traditional BI is too slow for daily decisions. Waiting on tickets and dashboard revisions creates drag.
Chat with your data removes that drag. People ask questions in plain English and get answers, charts, and follow-ups quickly.
Grounding matters more than flashy demos. Reliable systems use real business context, metadata, and governed sources.
Implementation is where smart teams win. Security, permissions, metric definitions, and auditability decide whether the tool becomes trusted.
Adoption needs a plan. Start with a small pilot, a few high-value questions, and clear examples users can copy.
The right outcome is operational. Faster answers, fewer analyst interruptions, and broader access to usable insight.
If your team already has the data but still waits too long to use it, this workflow is worth testing. Start small. Connect one trusted source. Ask a question your team asks every week. Then see whether the answer arrives fast enough, clearly enough, and safely enough to change how you work.
Connect your first data source in Statspresso and ask your first question. If you want a practical way to skip the SQL and work from plain-English prompts, it is a straightforward place to test whether a Conversational AI Data Analyst fits your team’s workflow.