AI-Powered Insights: Business Answers Fast

Waiting a week for one chart is not a reporting process. It is a bottleneck with a calendar invite.
Many teams already have the data. What they do not have is time to file tickets, wait for SQL, open three dashboards, and still leave the meeting with a shrug. AI powered insights fix that by turning a business question into an answer fast enough to still matter.
For teams that need immediate answers without the friction of traditional reporting, conversational analytics offers a powerful solution. Instead of navigating complex dashboards or waiting for data requests, you can simply ask your data questions in plain English and receive instant, actionable insights. To learn more about how this conversational approach transforms data analysis, explore how you can chat with your data and get instant insights, no SQL required.
Stop Waiting for Data and Start Getting Answers
A founder asks, “What was CAC last month?” A marketer asks, “Which campaign started slipping this week?” A PM asks, “Did activation improve after the release?”
None of those should become a mini project.

The old routine is painfully familiar. Someone submits a request. An analyst pulls tables. SQL gets written. A chart gets built. Then the stakeholder asks one follow-up and the whole dance starts again.
That lag is expensive because decisions do not wait politely.
According to Accenture Research, AI-driven models significantly reduce the time required to analyze and generate insights by approximately 90%, compressing work that took days into minutes for faster decisions, as summarized by Sequencr’s roundup of generative AI statistics and trends for 2025.
Why this matters to non-technical teams
If you run growth, product, or operations, you do not need another dashboard graveyard. You need answers.
You want to ask a plain-English question and get back:
A number you can use
A chart you can share
An explanation you can sanity-check
That is the appeal of a Conversational AI Data Analyst. Skip the SQL. Ask the question. Keep moving.
Tip: If an answer takes longer to get than the meeting it is supposed to inform, your reporting workflow is broken.
A better workflow
The practical shift is simple. Instead of building reports first and hunting for insights second, you start with the question.
Try asking an AI analytics tool:
“Show me revenue by month for the last year as a bar chart.”
“Which acquisition channels had the highest conversion rate this quarter?”
“Break down churn by plan type and region.”
That is what speed to value looks like. Not “AI strategy.” Just fewer delays and better questions answered on time.
What Are AI Powered Insights Really
Let’s drop the buzzwords.
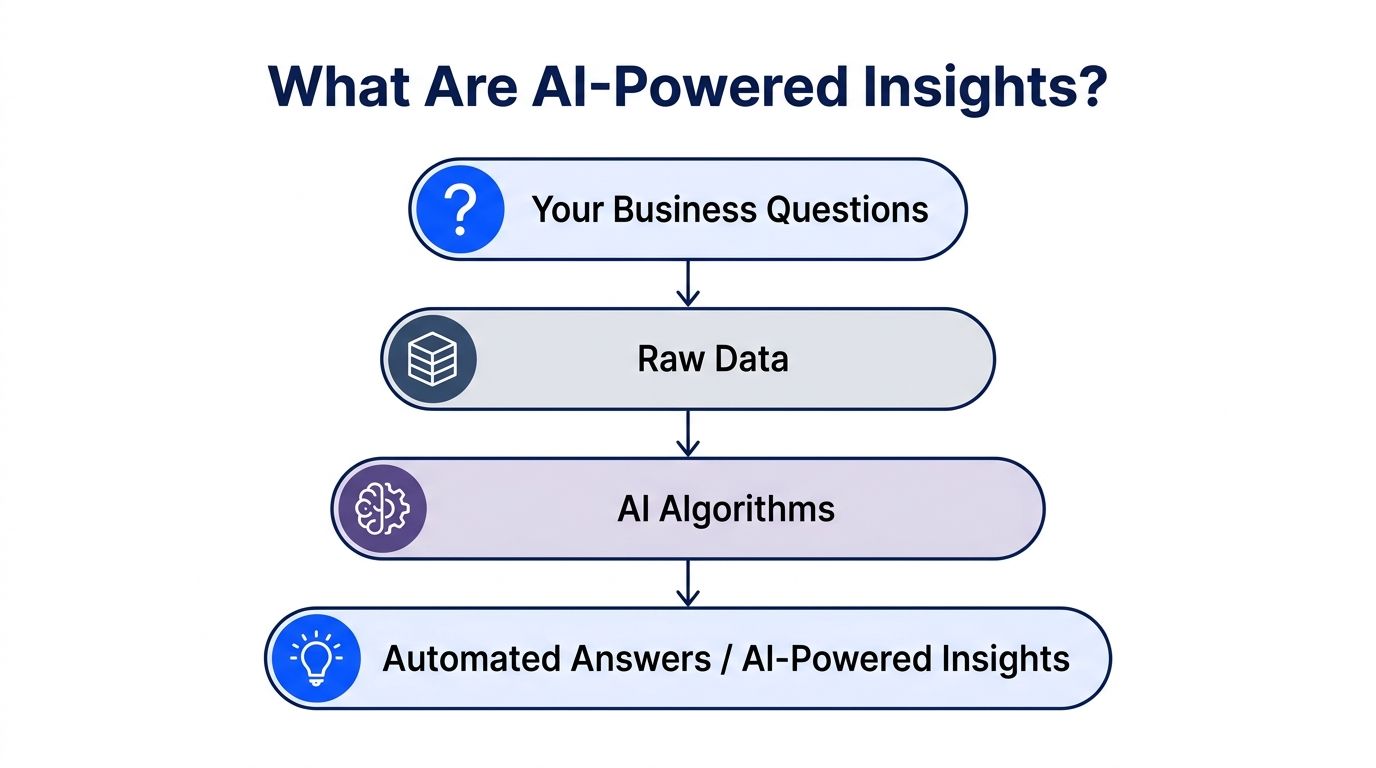
AI powered insights are answers generated from your business data in response to natural-language questions. Not generic internet knowledge. Not magic. Just your numbers, translated into something useful without forcing everyone to think like an analyst.
Traditional BI usually expects you to know where the answer lives before you ask. You need the right dashboard, the right filters, and enough patience to click through tabs named things like “Exec_QBR_Final_v3.”
Conversational analytics flips that. You ask first.
What happens under the hood
A good system combines a few pieces:
Natural language understanding to interpret what you mean
Data connectors to reach tools like Postgres, Shopify, HubSpot, or spreadsheets
Query generation to translate your question into the right logic
Visualization to return a chart, table, or summary
For a non-technical leader, the important part is not the model architecture. The important part is that you stop waiting on a specialist for every routine question.
Why some tools feel smart and others feel clueless
The difference is context.
In advanced systems, the AI agent builds context-aware prompts by analyzing your data structure and metadata. This “zero-query intelligence” helps it understand business semantics such as revenue or churn for your company without requiring constant manual setup, as described in TDengine’s explanation of AI-powered insights.
That matters more than most buyers realize.
If your tool does not understand that “MRR” in your database means monthly recurring revenue, or that “won_at” is your sales close date, the experience gets clumsy fast. You end up doing what the tool was supposed to spare you from. Translating your own business into machine-friendly terms every single time.
The simple mental model
Think of old-school BI as a filing cabinet. Organized, useful, and slow when you are in a hurry.
Think of conversational analytics as a very fast analyst sitting next to the filing cabinet. You ask the question. It pulls the right drawer, finds the right sheet, and hands you the answer in a form you can use.
Try asking:
“Compare new customers and returning customers by month.”
“Show average order value by device type.”
“Which products had the biggest drop in conversion after the last site update?”
Key takeaway: The value of AI powered insights is not that they look futuristic. It is that they reduce the gap between curiosity and evidence.
How Your Business Data Fuels the AI Engine
The “AI” part gets the headlines. Data plumbing performs the essential work.
If your data sits in Postgres, Shopify, HubSpot, Linear, or even a well-kept Google Sheet, an AI analytics tool can use that structure to answer questions. If the data is a swamp of inconsistent naming, duplicate rows, and mystery columns, the tool will struggle. Same as any analyst would.
Good input still matters.
The old way versus the useful way
Here is the practical difference.
Step | The Old Way (Manual SQL & Dashboards) | The New Way (Statspresso) |
|---|---|---|
Question arrives | Stakeholder sends a message or ticket | Stakeholder types a question directly |
Data discovery | Analyst checks schemas, joins, and field names | Tool reads connected source structure |
Query writing | Analyst writes SQL manually | SQL is generated behind the scenes |
Chart creation | Analyst builds chart in BI tool | Chart is returned with the answer |
Follow-up question | New ticket, new query, new wait | Ask a follow-up in the same thread |
Sharing | Export screenshot or dashboard link | Save useful answers to live dashboards |
That table is why so many teams get stuck. The friction is not in any one step. It is in stacking all the steps together for every minor question.
What clean enough looks like
Your data does not need to be perfect. It does need to be understandable.
Helpful signals include:
Consistent field names such as
created_at,customer_id, ororder_totalReasonable table structure with clear relationships
Basic metric definitions that your team agrees on
Fresh data connections so answers reflect reality, not a stale export
Messy data is still workable. Hidden logic is the bigger problem. If only one analyst knows how to calculate activation or net revenue retention, then your reporting process is one vacation away from collapse.
Why this matters for growth teams
This is especially relevant if you rely on data-driven marketing and need quick reads on campaign performance, attribution, or conversion trends without opening five tools and a support thread.
Try prompts like:
“Show pipeline created by source this month.”
“Which landing pages have the lowest signup conversion rate?”
“Compare repeat purchase rate across customer cohorts.”
The lesson is not glamorous. AI powered insights work best when they connect to the systems where your business already runs and when your core metrics are defined clearly enough to survive contact with reality.
Practical Business Use Cases for Growth Teams
Many companies do not need more “AI use cases.” They need one answer before lunch.

That is where AI analytics becomes practical. McKinsey’s 2026 State of AI survey notes that many companies use AI, but fewer achieve measurable profit impact. The value shows up when AI is tied to specific use cases that drive revenue or cut costs, especially in marketing, sales, and product development, according to McKinsey’s State of AI research.
Marketing lead checks campaign quality before the budget burns
A marketing lead notices paid spend rising faster than signups. The old move is to wait for the weekly report and hope the answer is obvious.
The smarter move is to ask right away:
“Break down CAC by campaign over the last 30 days.”
“Show conversion rate from lead to customer by channel.”
“Which ad groups produced high traffic but low trial starts?”
That changes the day. Instead of debating creative opinions, the team sees where cost and conversion parted ways.
If you are mapping a broader rollout, this guide on implementing AI in business is useful background because it frames adoption around workflows, not hype.
Product manager spots behavior changes after a release
A PM launches a feature and wants to know whether users adopted it.
A static dashboard might show total usage. That is not enough. You need follow-up questions in context:
“Show feature adoption by signup cohort.”
“Did activation rate change after the latest release?”
“Compare retention for users who used feature X versus those who did not.”
That thread matters because product questions are rarely one-and-done. You ask one question, then three more. Conversational analytics handles that better than dashboard hopping.
Founder gets a board-level answer without waiting for the board pack
Founders often need simple answers that somehow become difficult answers:
“What drove revenue change this month?”
“Which customer segments are growing fastest?”
“Where are we losing deals in the funnel?”
A tool that returns a chart plus a plain-English explanation is useful because it closes the gap between analysis and action. Fast answers let leaders decide now, not after the “final final” report lands.
Practical rule: Start with recurring questions that already slow your team down. Those are the first places AI analytics earns trust.
What works and what does not
What works:
Focused questions tied to a decision
Connected source data with clear metric definitions
Follow-up exploration in the same conversation
What does not:
Throwing vague prompts at messy data and expecting miracles
Using AI to decorate weak reporting habits
Treating every answer as correct without a quick sanity check
Useful AI powered insights are not abstract. They help growth teams make one better decision at a time.
Getting Started with Conversational Analytics
You do not need a six-month transformation project to stop wasting time on reporting.
You need a short list, a working data source, and a bit of skepticism in the right places.
A simple setup checklist
Start with one source that already matters. Postgres is a common choice. Shopify and HubSpot are too.
Then work through this sequence:
Connect one trusted source
Pick the system that answers the most recurring questions.Define a few core metrics
Revenue, signups, activation, pipeline, churn. Keep it boring and clear.Ask five questions your team already asks weekly
If the tool cannot handle routine business questions, it will not save you later.Check the generated answer against known numbers
Early trust comes from verification, not marketing copy.Save the useful outputs
Turn repeated answers into shareable dashboards or recurring views.
What to look for in a tool
When evaluating tools, ask about validation. Best-in-class platforms aim for over 95% accuracy on financial data and provide audit trails so you can trace an insight back to the source query and data, as outlined in ThoughtSpot’s guide to AI-generated insights.
That one point filters out a lot of flashy demos.
A serious tool should give you:
Traceability so you can inspect the underlying query
Clarity so business users understand what they are seeing
Speed so answers arrive while the question still matters
Flexibility for follow-up questions without rebuilding reports
One option in this category is Statspresso, a conversational AI data analyst that connects to business data sources and returns charts and answers from plain-English questions.
For a useful primer on the category, read what is an AI data assistant.
Tip: Do not buy based on dashboard screenshots. Buy based on how quickly a real stakeholder can get a trusted answer to a real question.
Questions to ask during a trial
Use the trial to pressure-test the workflow:
“Can a marketer use this without learning SQL?”
“Can a PM ask follow-up questions naturally?”
“Can finance inspect how a number was produced?”
“Can we save useful charts without turning the tool into another dashboard maze?”
The right platform should feel less like software procurement and more like removing a daily annoyance.
From First Question to First Dashboard in Minutes
A product manager connects a Postgres database. No ceremony. Just the normal connection form and a quick schema read.
Now the useful part begins.

Step one asks the broad question
Start wide enough to orient yourself.
Try:
“Show daily active users for the last 90 days.”
“Chart feature usage by week.”
“Compare activation rate before and after the latest release.”
The first answer gives shape to the problem. Maybe usage is flat. Maybe there is a spike after launch. Maybe activation improved for one segment and dipped for another.
Step two drills into the anomaly
Here, conversational analytics surpasses static reporting.
The PM follows up:
“Break that down by signup cohort.”
“Show this by device type.”
“Which accounts had the largest drop after release day?”
No new ticket. No moving to another dashboard. No asking someone to “pull a quick cut” that is never quick.
Step three saves the answer for the team
Once the chart is useful, save it.
Now the PM has a live view that can be shared with engineering, growth, and leadership. The chart updates with the connected data source instead of living its short life as a screenshot in Slack.
Key takeaway: The first win is not the dashboard. The first win is answering one important question fast enough to change what your team does next.
Try asking:
“Show new user retention by week.”
“What actions correlate with activation?”
“Create a dashboard with DAU, activation rate, and feature adoption.”
That workflow is the point. Question, chart, follow-up, shared view. Minutes, not meetings.
Your Data Has Answers Just Ask
The reporting bottleneck is no longer technical skill alone. It is access.
Your data already contains the answers. Sales trends. Conversion leaks. Feature adoption. Churn signals. The problem is that many teams still reach those answers through a clunky path built for specialists and patience.
AI powered insights remove that delay. You ask in plain English. The system queries your data. You get back a number, a chart, and something concrete enough to act on.
TL DR
Slow reporting is optional now
Routine business questions do not need a queue.Plain English is enough
You should not need SQL just to inspect your own metrics.Connected data beats exported spreadsheets
Fresh answers are more useful than stale decks.Trust still matters
Validation and traceability are not “nice to have.”Speed changes decisions
Fast answers let teams correct course before the week is gone.
If your team is still waiting around for simple numbers, the issue is not a lack of data. It is the workflow wrapped around it.
Frequently Asked Questions About AI Analytics
Skepticism is healthy. Many teams have already bought at least one “easy analytics” tool that turned out to be easy only for the demo person.
Is this just another dashboard tool
No. A dashboard shows predefined views. An AI analytics tool answers a question you have right now.
That distinction matters. Dashboards are useful for monitoring. Conversational analytics is useful for investigation.
If a stakeholder asks, “Why did conversion drop this week?” a static dashboard may or may not contain the answer. An AI tool lets you ask the question directly, then keep drilling.
How can I trust the AI’s answers
Trust comes from traceability, not confidence theater.
Reliable tools should show how the answer was produced, including the source query and the data behind it. That turns the system from a black box into something you can inspect like any other analytical workflow.
A good habit is simple. Trust, then verify. Especially for financial metrics, board reporting, or anything likely to trigger a tense meeting.
What if my data is messy or specific to my region
That is common, especially for startups and SMBs using a stack assembled under pressure.
A key challenge for AI is context-specific adaptation. Studies show that AI models often need local data adaptation to perform well. For business analytics, that means tools need to learn the nuances of your specific data, which is a gap conversational analytics is beginning to address, as discussed in this analysis on bridging AI inequities.
In plain terms, your tool should handle the fact that your data may not look like a pristine enterprise warehouse. It should still help you ask useful questions without forcing a full rebuild first.
Connect your first data source with Statspresso and ask a real business question today. Skip the SQL, get a chart in seconds, and see whether conversational analytics can remove the slowest part of your reporting workflow.
Waiting a week for one chart is not a reporting process. It is a bottleneck with a calendar invite.
Many teams already have the data. What they do not have is time to file tickets, wait for SQL, open three dashboards, and still leave the meeting with a shrug. AI powered insights fix that by turning a business question into an answer fast enough to still matter.
For teams that need immediate answers without the friction of traditional reporting, conversational analytics offers a powerful solution. Instead of navigating complex dashboards or waiting for data requests, you can simply ask your data questions in plain English and receive instant, actionable insights. To learn more about how this conversational approach transforms data analysis, explore how you can chat with your data and get instant insights, no SQL required.
Stop Waiting for Data and Start Getting Answers
A founder asks, “What was CAC last month?” A marketer asks, “Which campaign started slipping this week?” A PM asks, “Did activation improve after the release?”
None of those should become a mini project.
The old routine is painfully familiar. Someone submits a request. An analyst pulls tables. SQL gets written. A chart gets built. Then the stakeholder asks one follow-up and the whole dance starts again.
That lag is expensive because decisions do not wait politely.
According to Accenture Research, AI-driven models significantly reduce the time required to analyze and generate insights by approximately 90%, compressing work that took days into minutes for faster decisions, as summarized by Sequencr’s roundup of generative AI statistics and trends for 2025.
Why this matters to non-technical teams
If you run growth, product, or operations, you do not need another dashboard graveyard. You need answers.
You want to ask a plain-English question and get back:
A number you can use
A chart you can share
An explanation you can sanity-check
That is the appeal of a Conversational AI Data Analyst. Skip the SQL. Ask the question. Keep moving.
Tip: If an answer takes longer to get than the meeting it is supposed to inform, your reporting workflow is broken.
A better workflow
The practical shift is simple. Instead of building reports first and hunting for insights second, you start with the question.
Try asking an AI analytics tool:
“Show me revenue by month for the last year as a bar chart.”
“Which acquisition channels had the highest conversion rate this quarter?”
“Break down churn by plan type and region.”
That is what speed to value looks like. Not “AI strategy.” Just fewer delays and better questions answered on time.
What Are AI Powered Insights Really
Let’s drop the buzzwords.
AI powered insights are answers generated from your business data in response to natural-language questions. Not generic internet knowledge. Not magic. Just your numbers, translated into something useful without forcing everyone to think like an analyst.
Traditional BI usually expects you to know where the answer lives before you ask. You need the right dashboard, the right filters, and enough patience to click through tabs named things like “Exec_QBR_Final_v3.”
Conversational analytics flips that. You ask first.
What happens under the hood
A good system combines a few pieces:
Natural language understanding to interpret what you mean
Data connectors to reach tools like Postgres, Shopify, HubSpot, or spreadsheets
Query generation to translate your question into the right logic
Visualization to return a chart, table, or summary
For a non-technical leader, the important part is not the model architecture. The important part is that you stop waiting on a specialist for every routine question.
Why some tools feel smart and others feel clueless
The difference is context.
In advanced systems, the AI agent builds context-aware prompts by analyzing your data structure and metadata. This “zero-query intelligence” helps it understand business semantics such as revenue or churn for your company without requiring constant manual setup, as described in TDengine’s explanation of AI-powered insights.
That matters more than most buyers realize.
If your tool does not understand that “MRR” in your database means monthly recurring revenue, or that “won_at” is your sales close date, the experience gets clumsy fast. You end up doing what the tool was supposed to spare you from. Translating your own business into machine-friendly terms every single time.
The simple mental model
Think of old-school BI as a filing cabinet. Organized, useful, and slow when you are in a hurry.
Think of conversational analytics as a very fast analyst sitting next to the filing cabinet. You ask the question. It pulls the right drawer, finds the right sheet, and hands you the answer in a form you can use.
Try asking:
“Compare new customers and returning customers by month.”
“Show average order value by device type.”
“Which products had the biggest drop in conversion after the last site update?”
Key takeaway: The value of AI powered insights is not that they look futuristic. It is that they reduce the gap between curiosity and evidence.
How Your Business Data Fuels the AI Engine
The “AI” part gets the headlines. Data plumbing performs the essential work.
If your data sits in Postgres, Shopify, HubSpot, Linear, or even a well-kept Google Sheet, an AI analytics tool can use that structure to answer questions. If the data is a swamp of inconsistent naming, duplicate rows, and mystery columns, the tool will struggle. Same as any analyst would.
Good input still matters.
The old way versus the useful way
Here is the practical difference.
Step | The Old Way (Manual SQL & Dashboards) | The New Way (Statspresso) |
|---|---|---|
Question arrives | Stakeholder sends a message or ticket | Stakeholder types a question directly |
Data discovery | Analyst checks schemas, joins, and field names | Tool reads connected source structure |
Query writing | Analyst writes SQL manually | SQL is generated behind the scenes |
Chart creation | Analyst builds chart in BI tool | Chart is returned with the answer |
Follow-up question | New ticket, new query, new wait | Ask a follow-up in the same thread |
Sharing | Export screenshot or dashboard link | Save useful answers to live dashboards |
That table is why so many teams get stuck. The friction is not in any one step. It is in stacking all the steps together for every minor question.
What clean enough looks like
Your data does not need to be perfect. It does need to be understandable.
Helpful signals include:
Consistent field names such as
created_at,customer_id, ororder_totalReasonable table structure with clear relationships
Basic metric definitions that your team agrees on
Fresh data connections so answers reflect reality, not a stale export
Messy data is still workable. Hidden logic is the bigger problem. If only one analyst knows how to calculate activation or net revenue retention, then your reporting process is one vacation away from collapse.
Why this matters for growth teams
This is especially relevant if you rely on data-driven marketing and need quick reads on campaign performance, attribution, or conversion trends without opening five tools and a support thread.
Try prompts like:
“Show pipeline created by source this month.”
“Which landing pages have the lowest signup conversion rate?”
“Compare repeat purchase rate across customer cohorts.”
The lesson is not glamorous. AI powered insights work best when they connect to the systems where your business already runs and when your core metrics are defined clearly enough to survive contact with reality.
Practical Business Use Cases for Growth Teams
Many companies do not need more “AI use cases.” They need one answer before lunch.
That is where AI analytics becomes practical. McKinsey’s 2026 State of AI survey notes that many companies use AI, but fewer achieve measurable profit impact. The value shows up when AI is tied to specific use cases that drive revenue or cut costs, especially in marketing, sales, and product development, according to McKinsey’s State of AI research.
Marketing lead checks campaign quality before the budget burns
A marketing lead notices paid spend rising faster than signups. The old move is to wait for the weekly report and hope the answer is obvious.
The smarter move is to ask right away:
“Break down CAC by campaign over the last 30 days.”
“Show conversion rate from lead to customer by channel.”
“Which ad groups produced high traffic but low trial starts?”
That changes the day. Instead of debating creative opinions, the team sees where cost and conversion parted ways.
If you are mapping a broader rollout, this guide on implementing AI in business is useful background because it frames adoption around workflows, not hype.
Product manager spots behavior changes after a release
A PM launches a feature and wants to know whether users adopted it.
A static dashboard might show total usage. That is not enough. You need follow-up questions in context:
“Show feature adoption by signup cohort.”
“Did activation rate change after the latest release?”
“Compare retention for users who used feature X versus those who did not.”
That thread matters because product questions are rarely one-and-done. You ask one question, then three more. Conversational analytics handles that better than dashboard hopping.
Founder gets a board-level answer without waiting for the board pack
Founders often need simple answers that somehow become difficult answers:
“What drove revenue change this month?”
“Which customer segments are growing fastest?”
“Where are we losing deals in the funnel?”
A tool that returns a chart plus a plain-English explanation is useful because it closes the gap between analysis and action. Fast answers let leaders decide now, not after the “final final” report lands.
Practical rule: Start with recurring questions that already slow your team down. Those are the first places AI analytics earns trust.
What works and what does not
What works:
Focused questions tied to a decision
Connected source data with clear metric definitions
Follow-up exploration in the same conversation
What does not:
Throwing vague prompts at messy data and expecting miracles
Using AI to decorate weak reporting habits
Treating every answer as correct without a quick sanity check
Useful AI powered insights are not abstract. They help growth teams make one better decision at a time.
Getting Started with Conversational Analytics
You do not need a six-month transformation project to stop wasting time on reporting.
You need a short list, a working data source, and a bit of skepticism in the right places.
A simple setup checklist
Start with one source that already matters. Postgres is a common choice. Shopify and HubSpot are too.
Then work through this sequence:
Connect one trusted source
Pick the system that answers the most recurring questions.Define a few core metrics
Revenue, signups, activation, pipeline, churn. Keep it boring and clear.Ask five questions your team already asks weekly
If the tool cannot handle routine business questions, it will not save you later.Check the generated answer against known numbers
Early trust comes from verification, not marketing copy.Save the useful outputs
Turn repeated answers into shareable dashboards or recurring views.
What to look for in a tool
When evaluating tools, ask about validation. Best-in-class platforms aim for over 95% accuracy on financial data and provide audit trails so you can trace an insight back to the source query and data, as outlined in ThoughtSpot’s guide to AI-generated insights.
That one point filters out a lot of flashy demos.
A serious tool should give you:
Traceability so you can inspect the underlying query
Clarity so business users understand what they are seeing
Speed so answers arrive while the question still matters
Flexibility for follow-up questions without rebuilding reports
One option in this category is Statspresso, a conversational AI data analyst that connects to business data sources and returns charts and answers from plain-English questions.
For a useful primer on the category, read what is an AI data assistant.
Tip: Do not buy based on dashboard screenshots. Buy based on how quickly a real stakeholder can get a trusted answer to a real question.
Questions to ask during a trial
Use the trial to pressure-test the workflow:
“Can a marketer use this without learning SQL?”
“Can a PM ask follow-up questions naturally?”
“Can finance inspect how a number was produced?”
“Can we save useful charts without turning the tool into another dashboard maze?”
The right platform should feel less like software procurement and more like removing a daily annoyance.
From First Question to First Dashboard in Minutes
A product manager connects a Postgres database. No ceremony. Just the normal connection form and a quick schema read.
Now the useful part begins.
Step one asks the broad question
Start wide enough to orient yourself.
Try:
“Show daily active users for the last 90 days.”
“Chart feature usage by week.”
“Compare activation rate before and after the latest release.”
The first answer gives shape to the problem. Maybe usage is flat. Maybe there is a spike after launch. Maybe activation improved for one segment and dipped for another.
Step two drills into the anomaly
Here, conversational analytics surpasses static reporting.
The PM follows up:
“Break that down by signup cohort.”
“Show this by device type.”
“Which accounts had the largest drop after release day?”
No new ticket. No moving to another dashboard. No asking someone to “pull a quick cut” that is never quick.
Step three saves the answer for the team
Once the chart is useful, save it.
Now the PM has a live view that can be shared with engineering, growth, and leadership. The chart updates with the connected data source instead of living its short life as a screenshot in Slack.
Key takeaway: The first win is not the dashboard. The first win is answering one important question fast enough to change what your team does next.
Try asking:
“Show new user retention by week.”
“What actions correlate with activation?”
“Create a dashboard with DAU, activation rate, and feature adoption.”
That workflow is the point. Question, chart, follow-up, shared view. Minutes, not meetings.
Your Data Has Answers Just Ask
The reporting bottleneck is no longer technical skill alone. It is access.
Your data already contains the answers. Sales trends. Conversion leaks. Feature adoption. Churn signals. The problem is that many teams still reach those answers through a clunky path built for specialists and patience.
AI powered insights remove that delay. You ask in plain English. The system queries your data. You get back a number, a chart, and something concrete enough to act on.
TL DR
Slow reporting is optional now
Routine business questions do not need a queue.Plain English is enough
You should not need SQL just to inspect your own metrics.Connected data beats exported spreadsheets
Fresh answers are more useful than stale decks.Trust still matters
Validation and traceability are not “nice to have.”Speed changes decisions
Fast answers let teams correct course before the week is gone.
If your team is still waiting around for simple numbers, the issue is not a lack of data. It is the workflow wrapped around it.
Frequently Asked Questions About AI Analytics
Skepticism is healthy. Many teams have already bought at least one “easy analytics” tool that turned out to be easy only for the demo person.
Is this just another dashboard tool
No. A dashboard shows predefined views. An AI analytics tool answers a question you have right now.
That distinction matters. Dashboards are useful for monitoring. Conversational analytics is useful for investigation.
If a stakeholder asks, “Why did conversion drop this week?” a static dashboard may or may not contain the answer. An AI tool lets you ask the question directly, then keep drilling.
How can I trust the AI’s answers
Trust comes from traceability, not confidence theater.
Reliable tools should show how the answer was produced, including the source query and the data behind it. That turns the system from a black box into something you can inspect like any other analytical workflow.
A good habit is simple. Trust, then verify. Especially for financial metrics, board reporting, or anything likely to trigger a tense meeting.
What if my data is messy or specific to my region
That is common, especially for startups and SMBs using a stack assembled under pressure.
A key challenge for AI is context-specific adaptation. Studies show that AI models often need local data adaptation to perform well. For business analytics, that means tools need to learn the nuances of your specific data, which is a gap conversational analytics is beginning to address, as discussed in this analysis on bridging AI inequities.
In plain terms, your tool should handle the fact that your data may not look like a pristine enterprise warehouse. It should still help you ask useful questions without forcing a full rebuild first.
Connect your first data source with Statspresso and ask a real business question today. Skip the SQL, get a chart in seconds, and see whether conversational analytics can remove the slowest part of your reporting workflow.