Using AI to Analyze Data (2026 Guide)

You know the answer to your most pressing question is hiding somewhere in your data. It's scattered across Shopify, HubSpot, and a dozen Postgres tables. Getting a simple chart often means waiting weeks for a data analyst, fighting a clunky dashboard, or—even worse—trying to write SQL yourself. That data logjam is a relic of the past. Skip the SQL. Just ask your data a question and get a chart in seconds.
The Core Problem: Your Data Holds Answers, If You Could Just Ask
For too long, the people with the questions—the ones steering the ship—have been cut off from the data that holds the answers. The whole process is slow, expensive, and frankly, frustrating.
But that old way of doing things is finally over. The bottleneck is gone.
As a BI consultant, I've seen it firsthand. Teams spend more time trying to get data than actually using it. The revolution today is that you can skip the middleman and the code. You can just ask your data a question and get a chart back in seconds.
The Shift: From Manual Reports to Instant Answers
This move toward conversational analytics isn't just a niche trend; it’s a market-wide overhaul. It's about moving from static, historical reports to predictive insights that help you decide what to do next.
The numbers back this up. A recent report projects the AI market will reach nearly $2 trillion by 2030. This growth isn't just about cool tech; it's driven by businesses demanding smarter, more accessible tools. You can read more about these AI market trends to see where the industry is headed.
This shift points to a simple truth: businesses need to move faster. They need tools that empower the whole team, not just the data experts. Instead of building complex reports, teams are turning to tools like Statspresso, a Conversational AI Data Analyst, to ask direct questions and get immediate visualizations.
For anyone who's ever had to export a CSV, the difference is night and day.
The Old Way vs. The AI Way
Action | Old Way (Manual SQL & BI Tools) | New Way (Statspresso's Conversational AI) |
|---|---|---|
Asking a Question | Submit a ticket to the data team; wait in a queue. | Type a question in plain English, like you're talking to a colleague. |
Getting an Answer | Wait days (or weeks) for a custom SQL query and a static dashboard. | Receive an interactive chart and insights in seconds. |
Follow-Up Questions | Submit a new ticket and start the process all over again. | Ask a follow-up question immediately to refine your analysis. |
Who Can Do It? | Only data analysts or SQL experts. | Anyone on the team—founders, marketers, product managers. |
This table just scratches the surface. The new approach isn't just faster; it fosters a curious, data-driven culture because the barrier to entry is gone.
Imagine a founder prepping for a board meeting. Instead of requesting a report, they connect their data and find what they need on the spot.
Try asking Statspresso: "Show me my revenue by month for the last year as a bar chart."
That simple prompt replaces what used to be hours, or even days, of work. This frees your team to focus on making smart decisions, not wrestling with tools. This is the new standard.
Connect Scattered Data Without an Engineering Degree
If your company's data feels like a tangled mess, you’re not alone. Key information is almost always spread thin—sales figures in Shopify, marketing analytics in HubSpot, product usage in a Postgres database, and a critical report in a Google Sheet someone usually remembers to update.
Just a few years ago, untangling this meant a massive, costly engineering project to build a central data warehouse. That approach is a dinosaur.
From Data Silos to Unified Views
Today, it's much simpler. Modern AI data analysis platforms are built with native, pre-built connectors that do the technical grunt work. This isn't about writing code; it's a 'click-and-connect' setup that takes minutes, not months.
By linking your apps and databases, you give a Conversational AI Data Analyst like Statspresso a 360-degree view of your business. The goal is to get you from disconnected data to a unified perspective, fast.
This shift from clunky, manual analysis to a direct, AI-powered conversation with your data is a game-changer.
As the diagram shows, AI removes the traditional gatekeepers and technical hurdles, giving you a direct line from raw data to real answers.
The Power of Native Connectors
This 'click-and-connect' model is why the AI software market is projected to skyrocket to $1.2 trillion by 2026. This explosive growth is fueled by tools that put sophisticated analysis into the hands of non-technical teams. You can read more about the growth of the AI software market and what it means for business intelligence.
What does this actually look like for your team? It means you can finally connect the dots without needing to become a data engineer.
Shopify: Pull in sales trends, product performance, and customer lifetime value.
HubSpot: Link marketing and sales data to see which campaigns actually drive revenue.
Postgres: Plug directly into your product's database to watch user behavior in real-time.
Google Sheets: Yes, even that spreadsheet can be seamlessly integrated.
Once connected, you can start using AI to analyze data across all sources at once. A founder can finally get a straight answer to a critical question that used to take weeks.
Try asking Statspresso: “Which marketing channel drove the most signups for customers who purchased our top-selling product last month?”
That single question taps into HubSpot, Shopify, and your product database simultaneously. No support tickets, no SQL, and no waiting. You get a chart in seconds.
Get Powerful Answers with Simple Questions
Okay, your data is connected. Now the magic happens. In the past, getting answers meant wrestling with SQL, fighting pivot tables, or waiting for your data team. This is the bottleneck that using AI to analyze data shatters.
The secret sauce is a Conversational AI Data Analyst like Statspresso, which understands plain English. When you ask a question, a powerful Large Language Model (LLM) acts as an expert translator. It converts your everyday language into a perfect, machine-readable query on the fly. It's like having a senior data analyst write flawless code in an instant.
This process skips the SQL step entirely, taking you straight from a question to a finished visualization. No more waiting, no more confusing code.
From Vague Ideas to Specific Insights
The true power here is how it handles role-specific questions. Your founder and marketing lead care about very different metrics, and a good AI data analyst serves them both. This is why it’s worth exploring various AI data analysis tools to find the one that fits your team's needs.
Here’s what this looks like for different roles:
For the Founder: You need the 30,000-foot view. Instead of sifting through spreadsheets, get a snapshot instantly.
Try asking Statspresso: "Plot our monthly recurring revenue growth as a line chart."
For the Product Manager: Your world revolves around user behavior. Cohort analysis, once a manual headache, is now a simple request.
Try asking Statspresso: "Show me user retention by cohort for the last 6 months as a table."
For the Marketing Lead: You live and breathe campaign ROI. Comparing channel effectiveness used to mean merging exports. Now, it’s one question.
Try asking Statspresso: "What is the conversion rate from our latest Facebook campaign compared to our Google Ads?"
This isn't just about moving faster; it changes your company's culture. When anyone can get answers this quickly, you foster genuine curiosity and data-backed decision-making. The barrier to meaningful analysis has been torn down.
The AI doesn't just pull numbers; it understands intent. It knows "last year" means the previous 12 months and that "revenue" is a core metric. This is what makes a conversational AI feel less like a rigid tool and more like a brilliant colleague.
Discover Insights You Weren’t Even Looking For
The best analysis doesn’t just answer the questions you already have. It uncovers the critical trends you didn't even know to look for—those "unknown unknowns" that can define a business's success. This is where using AI to analyze data shifts from a simple query tool into a proactive, strategic partner.

Think of it as having a dedicated analyst who never sleeps. Automated anomaly detection and insight engines constantly scan your data, 24/7, hunting for statistically significant changes a human analyst would almost certainly miss.
Your AI Analyst Never Sleeps
Imagine getting an alert that a product just saw an unexpected sales spike in a new region. Or being notified about a sudden drop in engagement from your most valuable customers. This is the reality of automated business intelligence.
A tool like Statspresso, a Conversational AI Data Analyst, doesn't just wait for you to ask questions. Its 'AI Insight Gallery' acts as a real-time feed of crucial discoveries, flagging insights that help you get ahead of problems and opportunities. This is forward-looking intelligence, not backward-looking reports.
This proactive approach is backed by serious industry investment. The predictive analytics market is projected to soar past $109 billion by 2026, for one reason: organizations see a clear return by moving from reactive reporting to AI-driven foresight. You can read more about the business case for AI-driven data analysis to see just how big the impact can be.
From Raw Data to Proactive Alerts
Once your data is connected, the AI gets to work. It learns the rhythm of your business, establishing a baseline for key metrics to understand what "normal" looks like. From there, it watches for any deviation.
The real value isn't just finding an anomaly; it's understanding why it happened. An AI can instantly correlate a dip in sales with a new marketing campaign or a website change, giving you the context needed to act.
For example, a traditional dashboard might show sales are flat. An automated insight tool, on the other hand, could flag that:
Sales in North America are down 15% week-over-week.
But sales in Europe have simultaneously spiked by 30%.
The spike is driven by a single product that was recently discounted.
This level of detail moves you from a vague feeling that "something is off" to a specific, actionable insight. As explained in Mastering Data Parsing to Transform Unstructured Data into Business Insights, you can find surprising opportunities in data you previously thought was just noise.
You can even direct the AI to hunt for these shifts on your behalf.
Try asking Statspresso: “Find the most significant changes in my sales data this week.”
That simple prompt kicks off a sophisticated analysis that would take a human analyst hours. It delivers critical takeaways in seconds. You get to skip the SQL and go straight to the "so what?"
Get Answers You Can Actually Trust
Let’s be direct: an answer from an AI is useless if your team doesn't trust it. For any business leader, a fast answer is worthless if it's the wrong answer.
This is why validation and governance are critical when using AI to analyze data. Confidence starts with knowing exactly where your numbers came from.
"Show Your Work": Why Transparency is Everything
You can't just take an AI's word for it. True trust is built on data lineage and transparency. A reliable AI analytics tool has to show its work, giving you a clear trail from the final number back to the source tables it pulled from.
The best tools aren’t mysterious black boxes. For instance, a Conversational AI Data Analyst like Statspresso is built on this principle. It lets you:
Inspect the query: The main draw is to skip writing SQL, but the ability to see the SQL query the AI wrote is priceless. This lets a technical user quickly verify the AI understood the question correctly.
Trace the data: You can instantly see which tables from your Postgres database or which fields from Shopify were used, eliminating all ambiguity.
Refine and correct: If an answer seems off, you can give the AI feedback. This helps it learn and sharpens its accuracy over time.
This level of trust is critical as we enter the AI Revolution. Without it, the whole system falls apart.
From Insight to Action
Once you have answers you can rely on, the final piece is turning them into action. This is where you see the real return—closing the loop between a question and a decision almost instantly.
The goal isn't just faster charts. It's accelerating your entire decision-making cycle by embedding real-time data directly into your team's workflow.
Imagine you’re in a marketing meeting. Instead of the usual "I'll pull those numbers and get back to you," you get the answer on the spot.
Just ask Statspresso: “Compare our sign-up conversion rates for our Google Ads and Facebook Ads campaigns over the last 30 days.”
A chart pops up. The conversation shifts from guessing to strategizing based on hard data. You can pin these insights to a shared dashboard, creating a single source of truth. This is how you stop debating opinions and start acting on facts.
TL;DR: The Key Takeaways for Busy Leaders
Here’s the bottom line on using AI to analyze data:
Connect Your Data in Minutes: Modern AI platforms use simple connectors to link sources like Shopify, HubSpot, and Postgres without a massive engineering project.
Plain English is the New SQL: Skip the SQL. If you can ask a question, you can get a chart in seconds. This opens up data analysis to your entire team.
AI Finds What You Miss: Automated insights and anomaly detection work 24/7 to find significant trends and issues you weren't even looking for.
Trust Through Transparency: The best AI tools show their work, revealing the exact data and query used to generate an answer so you can trust the results.
This is the real solution to being data-rich but insight-poor. You don't need another confusing dashboard. You need a Conversational AI Data Analyst like Statspresso.
Stop waiting for answers. Connect your first data source for free and ask your first question in the next five minutes.
You know the answer to your most pressing question is hiding somewhere in your data. It's scattered across Shopify, HubSpot, and a dozen Postgres tables. Getting a simple chart often means waiting weeks for a data analyst, fighting a clunky dashboard, or—even worse—trying to write SQL yourself. That data logjam is a relic of the past. Skip the SQL. Just ask your data a question and get a chart in seconds.
The Core Problem: Your Data Holds Answers, If You Could Just Ask
For too long, the people with the questions—the ones steering the ship—have been cut off from the data that holds the answers. The whole process is slow, expensive, and frankly, frustrating.
But that old way of doing things is finally over. The bottleneck is gone.
As a BI consultant, I've seen it firsthand. Teams spend more time trying to get data than actually using it. The revolution today is that you can skip the middleman and the code. You can just ask your data a question and get a chart back in seconds.
The Shift: From Manual Reports to Instant Answers
This move toward conversational analytics isn't just a niche trend; it’s a market-wide overhaul. It's about moving from static, historical reports to predictive insights that help you decide what to do next.
The numbers back this up. A recent report projects the AI market will reach nearly $2 trillion by 2030. This growth isn't just about cool tech; it's driven by businesses demanding smarter, more accessible tools. You can read more about these AI market trends to see where the industry is headed.
This shift points to a simple truth: businesses need to move faster. They need tools that empower the whole team, not just the data experts. Instead of building complex reports, teams are turning to tools like Statspresso, a Conversational AI Data Analyst, to ask direct questions and get immediate visualizations.
For anyone who's ever had to export a CSV, the difference is night and day.
The Old Way vs. The AI Way
Action | Old Way (Manual SQL & BI Tools) | New Way (Statspresso's Conversational AI) |
|---|---|---|
Asking a Question | Submit a ticket to the data team; wait in a queue. | Type a question in plain English, like you're talking to a colleague. |
Getting an Answer | Wait days (or weeks) for a custom SQL query and a static dashboard. | Receive an interactive chart and insights in seconds. |
Follow-Up Questions | Submit a new ticket and start the process all over again. | Ask a follow-up question immediately to refine your analysis. |
Who Can Do It? | Only data analysts or SQL experts. | Anyone on the team—founders, marketers, product managers. |
This table just scratches the surface. The new approach isn't just faster; it fosters a curious, data-driven culture because the barrier to entry is gone.
Imagine a founder prepping for a board meeting. Instead of requesting a report, they connect their data and find what they need on the spot.
Try asking Statspresso: "Show me my revenue by month for the last year as a bar chart."
That simple prompt replaces what used to be hours, or even days, of work. This frees your team to focus on making smart decisions, not wrestling with tools. This is the new standard.
Connect Scattered Data Without an Engineering Degree
If your company's data feels like a tangled mess, you’re not alone. Key information is almost always spread thin—sales figures in Shopify, marketing analytics in HubSpot, product usage in a Postgres database, and a critical report in a Google Sheet someone usually remembers to update.
Just a few years ago, untangling this meant a massive, costly engineering project to build a central data warehouse. That approach is a dinosaur.
From Data Silos to Unified Views
Today, it's much simpler. Modern AI data analysis platforms are built with native, pre-built connectors that do the technical grunt work. This isn't about writing code; it's a 'click-and-connect' setup that takes minutes, not months.
By linking your apps and databases, you give a Conversational AI Data Analyst like Statspresso a 360-degree view of your business. The goal is to get you from disconnected data to a unified perspective, fast.
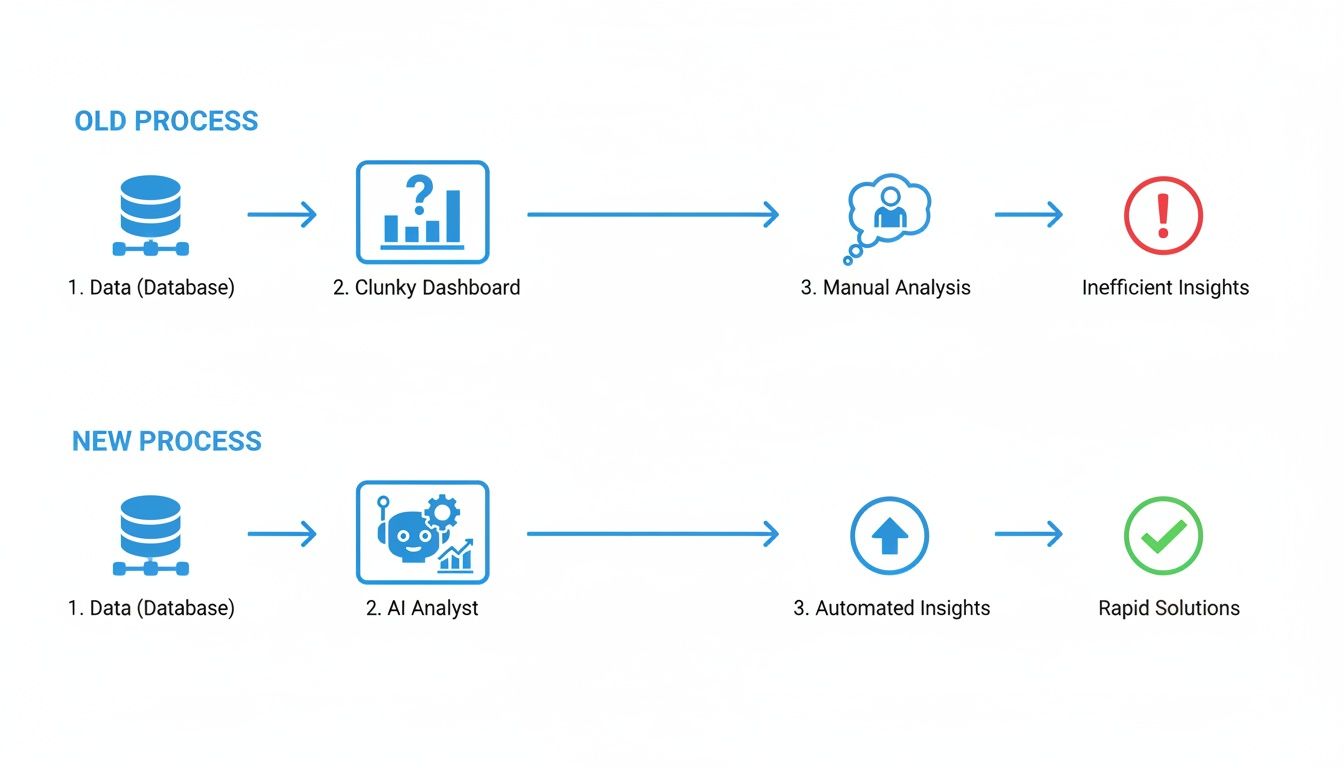
This shift from clunky, manual analysis to a direct, AI-powered conversation with your data is a game-changer.
As the diagram shows, AI removes the traditional gatekeepers and technical hurdles, giving you a direct line from raw data to real answers.
The Power of Native Connectors
This 'click-and-connect' model is why the AI software market is projected to skyrocket to $1.2 trillion by 2026. This explosive growth is fueled by tools that put sophisticated analysis into the hands of non-technical teams. You can read more about the growth of the AI software market and what it means for business intelligence.
What does this actually look like for your team? It means you can finally connect the dots without needing to become a data engineer.
Shopify: Pull in sales trends, product performance, and customer lifetime value.
HubSpot: Link marketing and sales data to see which campaigns actually drive revenue.
Postgres: Plug directly into your product's database to watch user behavior in real-time.
Google Sheets: Yes, even that spreadsheet can be seamlessly integrated.
Once connected, you can start using AI to analyze data across all sources at once. A founder can finally get a straight answer to a critical question that used to take weeks.
Try asking Statspresso: “Which marketing channel drove the most signups for customers who purchased our top-selling product last month?”
That single question taps into HubSpot, Shopify, and your product database simultaneously. No support tickets, no SQL, and no waiting. You get a chart in seconds.
Get Powerful Answers with Simple Questions
Okay, your data is connected. Now the magic happens. In the past, getting answers meant wrestling with SQL, fighting pivot tables, or waiting for your data team. This is the bottleneck that using AI to analyze data shatters.
The secret sauce is a Conversational AI Data Analyst like Statspresso, which understands plain English. When you ask a question, a powerful Large Language Model (LLM) acts as an expert translator. It converts your everyday language into a perfect, machine-readable query on the fly. It's like having a senior data analyst write flawless code in an instant.
This process skips the SQL step entirely, taking you straight from a question to a finished visualization. No more waiting, no more confusing code.
From Vague Ideas to Specific Insights
The true power here is how it handles role-specific questions. Your founder and marketing lead care about very different metrics, and a good AI data analyst serves them both. This is why it’s worth exploring various AI data analysis tools to find the one that fits your team's needs.
Here’s what this looks like for different roles:
For the Founder: You need the 30,000-foot view. Instead of sifting through spreadsheets, get a snapshot instantly.
Try asking Statspresso: "Plot our monthly recurring revenue growth as a line chart."
For the Product Manager: Your world revolves around user behavior. Cohort analysis, once a manual headache, is now a simple request.
Try asking Statspresso: "Show me user retention by cohort for the last 6 months as a table."
For the Marketing Lead: You live and breathe campaign ROI. Comparing channel effectiveness used to mean merging exports. Now, it’s one question.
Try asking Statspresso: "What is the conversion rate from our latest Facebook campaign compared to our Google Ads?"
This isn't just about moving faster; it changes your company's culture. When anyone can get answers this quickly, you foster genuine curiosity and data-backed decision-making. The barrier to meaningful analysis has been torn down.
The AI doesn't just pull numbers; it understands intent. It knows "last year" means the previous 12 months and that "revenue" is a core metric. This is what makes a conversational AI feel less like a rigid tool and more like a brilliant colleague.
Discover Insights You Weren’t Even Looking For
The best analysis doesn’t just answer the questions you already have. It uncovers the critical trends you didn't even know to look for—those "unknown unknowns" that can define a business's success. This is where using AI to analyze data shifts from a simple query tool into a proactive, strategic partner.
Think of it as having a dedicated analyst who never sleeps. Automated anomaly detection and insight engines constantly scan your data, 24/7, hunting for statistically significant changes a human analyst would almost certainly miss.
Your AI Analyst Never Sleeps
Imagine getting an alert that a product just saw an unexpected sales spike in a new region. Or being notified about a sudden drop in engagement from your most valuable customers. This is the reality of automated business intelligence.
A tool like Statspresso, a Conversational AI Data Analyst, doesn't just wait for you to ask questions. Its 'AI Insight Gallery' acts as a real-time feed of crucial discoveries, flagging insights that help you get ahead of problems and opportunities. This is forward-looking intelligence, not backward-looking reports.
This proactive approach is backed by serious industry investment. The predictive analytics market is projected to soar past $109 billion by 2026, for one reason: organizations see a clear return by moving from reactive reporting to AI-driven foresight. You can read more about the business case for AI-driven data analysis to see just how big the impact can be.
From Raw Data to Proactive Alerts
Once your data is connected, the AI gets to work. It learns the rhythm of your business, establishing a baseline for key metrics to understand what "normal" looks like. From there, it watches for any deviation.
The real value isn't just finding an anomaly; it's understanding why it happened. An AI can instantly correlate a dip in sales with a new marketing campaign or a website change, giving you the context needed to act.
For example, a traditional dashboard might show sales are flat. An automated insight tool, on the other hand, could flag that:
Sales in North America are down 15% week-over-week.
But sales in Europe have simultaneously spiked by 30%.
The spike is driven by a single product that was recently discounted.
This level of detail moves you from a vague feeling that "something is off" to a specific, actionable insight. As explained in Mastering Data Parsing to Transform Unstructured Data into Business Insights, you can find surprising opportunities in data you previously thought was just noise.
You can even direct the AI to hunt for these shifts on your behalf.
Try asking Statspresso: “Find the most significant changes in my sales data this week.”
That simple prompt kicks off a sophisticated analysis that would take a human analyst hours. It delivers critical takeaways in seconds. You get to skip the SQL and go straight to the "so what?"
Get Answers You Can Actually Trust
Let’s be direct: an answer from an AI is useless if your team doesn't trust it. For any business leader, a fast answer is worthless if it's the wrong answer.
This is why validation and governance are critical when using AI to analyze data. Confidence starts with knowing exactly where your numbers came from.
"Show Your Work": Why Transparency is Everything
You can't just take an AI's word for it. True trust is built on data lineage and transparency. A reliable AI analytics tool has to show its work, giving you a clear trail from the final number back to the source tables it pulled from.
The best tools aren’t mysterious black boxes. For instance, a Conversational AI Data Analyst like Statspresso is built on this principle. It lets you:
Inspect the query: The main draw is to skip writing SQL, but the ability to see the SQL query the AI wrote is priceless. This lets a technical user quickly verify the AI understood the question correctly.
Trace the data: You can instantly see which tables from your Postgres database or which fields from Shopify were used, eliminating all ambiguity.
Refine and correct: If an answer seems off, you can give the AI feedback. This helps it learn and sharpens its accuracy over time.
This level of trust is critical as we enter the AI Revolution. Without it, the whole system falls apart.
From Insight to Action
Once you have answers you can rely on, the final piece is turning them into action. This is where you see the real return—closing the loop between a question and a decision almost instantly.
The goal isn't just faster charts. It's accelerating your entire decision-making cycle by embedding real-time data directly into your team's workflow.
Imagine you’re in a marketing meeting. Instead of the usual "I'll pull those numbers and get back to you," you get the answer on the spot.
Just ask Statspresso: “Compare our sign-up conversion rates for our Google Ads and Facebook Ads campaigns over the last 30 days.”
A chart pops up. The conversation shifts from guessing to strategizing based on hard data. You can pin these insights to a shared dashboard, creating a single source of truth. This is how you stop debating opinions and start acting on facts.
TL;DR: The Key Takeaways for Busy Leaders
Here’s the bottom line on using AI to analyze data:
Connect Your Data in Minutes: Modern AI platforms use simple connectors to link sources like Shopify, HubSpot, and Postgres without a massive engineering project.
Plain English is the New SQL: Skip the SQL. If you can ask a question, you can get a chart in seconds. This opens up data analysis to your entire team.
AI Finds What You Miss: Automated insights and anomaly detection work 24/7 to find significant trends and issues you weren't even looking for.
Trust Through Transparency: The best AI tools show their work, revealing the exact data and query used to generate an answer so you can trust the results.
This is the real solution to being data-rich but insight-poor. You don't need another confusing dashboard. You need a Conversational AI Data Analyst like Statspresso.
Stop waiting for answers. Connect your first data source for free and ask your first question in the next five minutes.
You know the answer to your most pressing question is hiding somewhere in your data. It's scattered across Shopify, HubSpot, and a dozen Postgres tables. Getting a simple chart often means waiting weeks for a data analyst, fighting a clunky dashboard, or—even worse—trying to write SQL yourself. That data logjam is a relic of the past. Skip the SQL. Just ask your data a question and get a chart in seconds.
The Core Problem: Your Data Holds Answers, If You Could Just Ask
For too long, the people with the questions—the ones steering the ship—have been cut off from the data that holds the answers. The whole process is slow, expensive, and frankly, frustrating.
But that old way of doing things is finally over. The bottleneck is gone.
As a BI consultant, I've seen it firsthand. Teams spend more time trying to get data than actually using it. The revolution today is that you can skip the middleman and the code. You can just ask your data a question and get a chart back in seconds.
The Shift: From Manual Reports to Instant Answers
This move toward conversational analytics isn't just a niche trend; it’s a market-wide overhaul. It's about moving from static, historical reports to predictive insights that help you decide what to do next.
The numbers back this up. A recent report projects the AI market will reach nearly $2 trillion by 2030. This growth isn't just about cool tech; it's driven by businesses demanding smarter, more accessible tools. You can read more about these AI market trends to see where the industry is headed.
This shift points to a simple truth: businesses need to move faster. They need tools that empower the whole team, not just the data experts. Instead of building complex reports, teams are turning to tools like Statspresso, a Conversational AI Data Analyst, to ask direct questions and get immediate visualizations.
For anyone who's ever had to export a CSV, the difference is night and day.
The Old Way vs. The AI Way
Action | Old Way (Manual SQL & BI Tools) | New Way (Statspresso's Conversational AI) |
|---|---|---|
Asking a Question | Submit a ticket to the data team; wait in a queue. | Type a question in plain English, like you're talking to a colleague. |
Getting an Answer | Wait days (or weeks) for a custom SQL query and a static dashboard. | Receive an interactive chart and insights in seconds. |
Follow-Up Questions | Submit a new ticket and start the process all over again. | Ask a follow-up question immediately to refine your analysis. |
Who Can Do It? | Only data analysts or SQL experts. | Anyone on the team—founders, marketers, product managers. |
This table just scratches the surface. The new approach isn't just faster; it fosters a curious, data-driven culture because the barrier to entry is gone.
Imagine a founder prepping for a board meeting. Instead of requesting a report, they connect their data and find what they need on the spot.
Try asking Statspresso: "Show me my revenue by month for the last year as a bar chart."
That simple prompt replaces what used to be hours, or even days, of work. This frees your team to focus on making smart decisions, not wrestling with tools. This is the new standard.
Connect Scattered Data Without an Engineering Degree
If your company's data feels like a tangled mess, you’re not alone. Key information is almost always spread thin—sales figures in Shopify, marketing analytics in HubSpot, product usage in a Postgres database, and a critical report in a Google Sheet someone usually remembers to update.
Just a few years ago, untangling this meant a massive, costly engineering project to build a central data warehouse. That approach is a dinosaur.
From Data Silos to Unified Views
Today, it's much simpler. Modern AI data analysis platforms are built with native, pre-built connectors that do the technical grunt work. This isn't about writing code; it's a 'click-and-connect' setup that takes minutes, not months.
By linking your apps and databases, you give a Conversational AI Data Analyst like Statspresso a 360-degree view of your business. The goal is to get you from disconnected data to a unified perspective, fast.
This shift from clunky, manual analysis to a direct, AI-powered conversation with your data is a game-changer.
As the diagram shows, AI removes the traditional gatekeepers and technical hurdles, giving you a direct line from raw data to real answers.
The Power of Native Connectors
This 'click-and-connect' model is why the AI software market is projected to skyrocket to $1.2 trillion by 2026. This explosive growth is fueled by tools that put sophisticated analysis into the hands of non-technical teams. You can read more about the growth of the AI software market and what it means for business intelligence.
What does this actually look like for your team? It means you can finally connect the dots without needing to become a data engineer.
Shopify: Pull in sales trends, product performance, and customer lifetime value.
HubSpot: Link marketing and sales data to see which campaigns actually drive revenue.
Postgres: Plug directly into your product's database to watch user behavior in real-time.
Google Sheets: Yes, even that spreadsheet can be seamlessly integrated.
Once connected, you can start using AI to analyze data across all sources at once. A founder can finally get a straight answer to a critical question that used to take weeks.
Try asking Statspresso: “Which marketing channel drove the most signups for customers who purchased our top-selling product last month?”
That single question taps into HubSpot, Shopify, and your product database simultaneously. No support tickets, no SQL, and no waiting. You get a chart in seconds.
Get Powerful Answers with Simple Questions
Okay, your data is connected. Now the magic happens. In the past, getting answers meant wrestling with SQL, fighting pivot tables, or waiting for your data team. This is the bottleneck that using AI to analyze data shatters.
The secret sauce is a Conversational AI Data Analyst like Statspresso, which understands plain English. When you ask a question, a powerful Large Language Model (LLM) acts as an expert translator. It converts your everyday language into a perfect, machine-readable query on the fly. It's like having a senior data analyst write flawless code in an instant.
This process skips the SQL step entirely, taking you straight from a question to a finished visualization. No more waiting, no more confusing code.
From Vague Ideas to Specific Insights
The true power here is how it handles role-specific questions. Your founder and marketing lead care about very different metrics, and a good AI data analyst serves them both. This is why it’s worth exploring various AI data analysis tools to find the one that fits your team's needs.
Here’s what this looks like for different roles:
For the Founder: You need the 30,000-foot view. Instead of sifting through spreadsheets, get a snapshot instantly.
Try asking Statspresso: "Plot our monthly recurring revenue growth as a line chart."
For the Product Manager: Your world revolves around user behavior. Cohort analysis, once a manual headache, is now a simple request.
Try asking Statspresso: "Show me user retention by cohort for the last 6 months as a table."
For the Marketing Lead: You live and breathe campaign ROI. Comparing channel effectiveness used to mean merging exports. Now, it’s one question.
Try asking Statspresso: "What is the conversion rate from our latest Facebook campaign compared to our Google Ads?"
This isn't just about moving faster; it changes your company's culture. When anyone can get answers this quickly, you foster genuine curiosity and data-backed decision-making. The barrier to meaningful analysis has been torn down.
The AI doesn't just pull numbers; it understands intent. It knows "last year" means the previous 12 months and that "revenue" is a core metric. This is what makes a conversational AI feel less like a rigid tool and more like a brilliant colleague.
Discover Insights You Weren’t Even Looking For
The best analysis doesn’t just answer the questions you already have. It uncovers the critical trends you didn't even know to look for—those "unknown unknowns" that can define a business's success. This is where using AI to analyze data shifts from a simple query tool into a proactive, strategic partner.
Think of it as having a dedicated analyst who never sleeps. Automated anomaly detection and insight engines constantly scan your data, 24/7, hunting for statistically significant changes a human analyst would almost certainly miss.
Your AI Analyst Never Sleeps
Imagine getting an alert that a product just saw an unexpected sales spike in a new region. Or being notified about a sudden drop in engagement from your most valuable customers. This is the reality of automated business intelligence.
A tool like Statspresso, a Conversational AI Data Analyst, doesn't just wait for you to ask questions. Its 'AI Insight Gallery' acts as a real-time feed of crucial discoveries, flagging insights that help you get ahead of problems and opportunities. This is forward-looking intelligence, not backward-looking reports.
This proactive approach is backed by serious industry investment. The predictive analytics market is projected to soar past $109 billion by 2026, for one reason: organizations see a clear return by moving from reactive reporting to AI-driven foresight. You can read more about the business case for AI-driven data analysis to see just how big the impact can be.
From Raw Data to Proactive Alerts
Once your data is connected, the AI gets to work. It learns the rhythm of your business, establishing a baseline for key metrics to understand what "normal" looks like. From there, it watches for any deviation.
The real value isn't just finding an anomaly; it's understanding why it happened. An AI can instantly correlate a dip in sales with a new marketing campaign or a website change, giving you the context needed to act.
For example, a traditional dashboard might show sales are flat. An automated insight tool, on the other hand, could flag that:
Sales in North America are down 15% week-over-week.
But sales in Europe have simultaneously spiked by 30%.
The spike is driven by a single product that was recently discounted.
This level of detail moves you from a vague feeling that "something is off" to a specific, actionable insight. As explained in Mastering Data Parsing to Transform Unstructured Data into Business Insights, you can find surprising opportunities in data you previously thought was just noise.
You can even direct the AI to hunt for these shifts on your behalf.
Try asking Statspresso: “Find the most significant changes in my sales data this week.”
That simple prompt kicks off a sophisticated analysis that would take a human analyst hours. It delivers critical takeaways in seconds. You get to skip the SQL and go straight to the "so what?"
Get Answers You Can Actually Trust
Let’s be direct: an answer from an AI is useless if your team doesn't trust it. For any business leader, a fast answer is worthless if it's the wrong answer.
This is why validation and governance are critical when using AI to analyze data. Confidence starts with knowing exactly where your numbers came from.
"Show Your Work": Why Transparency is Everything
You can't just take an AI's word for it. True trust is built on data lineage and transparency. A reliable AI analytics tool has to show its work, giving you a clear trail from the final number back to the source tables it pulled from.
The best tools aren’t mysterious black boxes. For instance, a Conversational AI Data Analyst like Statspresso is built on this principle. It lets you:
Inspect the query: The main draw is to skip writing SQL, but the ability to see the SQL query the AI wrote is priceless. This lets a technical user quickly verify the AI understood the question correctly.
Trace the data: You can instantly see which tables from your Postgres database or which fields from Shopify were used, eliminating all ambiguity.
Refine and correct: If an answer seems off, you can give the AI feedback. This helps it learn and sharpens its accuracy over time.
This level of trust is critical as we enter the AI Revolution. Without it, the whole system falls apart.
From Insight to Action
Once you have answers you can rely on, the final piece is turning them into action. This is where you see the real return—closing the loop between a question and a decision almost instantly.
The goal isn't just faster charts. It's accelerating your entire decision-making cycle by embedding real-time data directly into your team's workflow.
Imagine you’re in a marketing meeting. Instead of the usual "I'll pull those numbers and get back to you," you get the answer on the spot.
Just ask Statspresso: “Compare our sign-up conversion rates for our Google Ads and Facebook Ads campaigns over the last 30 days.”
A chart pops up. The conversation shifts from guessing to strategizing based on hard data. You can pin these insights to a shared dashboard, creating a single source of truth. This is how you stop debating opinions and start acting on facts.
TL;DR: The Key Takeaways for Busy Leaders
Here’s the bottom line on using AI to analyze data:
Connect Your Data in Minutes: Modern AI platforms use simple connectors to link sources like Shopify, HubSpot, and Postgres without a massive engineering project.
Plain English is the New SQL: Skip the SQL. If you can ask a question, you can get a chart in seconds. This opens up data analysis to your entire team.
AI Finds What You Miss: Automated insights and anomaly detection work 24/7 to find significant trends and issues you weren't even looking for.
Trust Through Transparency: The best AI tools show their work, revealing the exact data and query used to generate an answer so you can trust the results.
This is the real solution to being data-rich but insight-poor. You don't need another confusing dashboard. You need a Conversational AI Data Analyst like Statspresso.
Stop waiting for answers. Connect your first data source for free and ask your first question in the next five minutes.