Stop Manual Data Pulls: The 2026 Playbook

You asked for a “quick number” on Monday. By Wednesday, someone has exported a CSV from HubSpot, someone else has patched it with Shopify data, and your analyst is still cleaning column names in a spreadsheet. Meanwhile, you’re deciding budget, roadmap, or hiring from stale data.
That’s not a talent problem. It’s a workflow problem.
Waiting on manual exports and ad hoc SQL is old-school BI. The fix is simpler than it seems. If you want to stop manual data pulls, you need a workflow where business people can ask plain-English questions and get answers instantly. The same logic that makes AI-powered sales research useful for go-to-market teams applies here too. Remove repetitive grunt work, keep humans focused on judgment, and stop pretending CSV wrangling is strategy.
Your Last Manual Data Pull Was Yesterday
Founders usually notice the problem in small moments. A board question. A campaign review. A product meeting where nobody agrees on “active users” because three people pulled the number three different ways.
The ugly part is how normal this becomes. Teams start treating delays, spreadsheet version confusion, and “let me get back to you” as standard operating procedure. They build workarounds instead of fixing the pipe.
Manual pulls feel harmless because each one is small. The damage comes from repetition.
If your marketing lead exports from HubSpot every week, your ops lead cleans data in Sheets, and your analyst rewrites the same SQL every Friday, you don’t have reporting. You have a recurring manual labor system with a reporting label slapped on top.
The better model is self-serve analytics that business people can readily use. A Conversational AI Data Analyst changes the job from “prepare the data by hand” to “ask a good question.” That’s the shift that matters. Skip the SQL. Just ask your data a question and get a chart in seconds.
The True Cost of Your Weekly CSV Export
The weekly CSV ritual looks cheap because it hides its cost in small chunks. Ten minutes here. Half an hour there. A late-night Slack message to “double check the numbers.” Add enough of those together and your team is spending serious energy just moving data around.

The time cost is obvious
Manual pulls steal attention from work that changes the business. Instead of analyzing why conversion dropped, someone is fixing date formats. Instead of spotting churn risk, someone is matching customer IDs across tools.
That’s bad enough. But time isn’t the biggest problem.
The error cost is worse
Manual data entry and pulls have error rates ranging from 18% to 40%, according to Parseur’s analysis of manual work reduction. That same analysis notes the source of the problem is simple and familiar. Repetitive, fatigue-heavy work like copying invoice fields or customer information creates mistakes that then bleed into reporting and billing.
Those errors don’t stay contained in a spreadsheet. They move downstream into dashboards, reviews, forecasts, and customer conversations.
A bad formula can survive for weeks because it “looks about right.” A mismatched export can distort campaign performance. A duplicated row can make a channel seem better than it is. None of this is dramatic in the moment. It’s just enough to make your decisions worse.
The opportunity cost is what founders underestimate
If your team spends the week collecting data, they aren’t spending the week interpreting it. That’s the primary loss. Manual reporting delays the answer and lowers confidence in the answer once you finally get it.
Here’s what that usually looks like:
Marketing waits to adjust spend because acquisition data is still being reconciled.
Product delays a release call because retention numbers don’t match across tools.
Sales leaders argue over pipeline quality because exports were pulled at different times.
Founders default to instinct because the “real number” won’t be ready until tomorrow.
Practical rule: If a metric takes multiple people and multiple files to produce, it’s too fragile to run the business on.
This gets worse in SaaS and ecommerce teams because the data lives everywhere. Shopify, HubSpot, Postgres, Stripe, support tools, product analytics, maybe a warehouse if you’re lucky. Every extra source creates another chance for a manual mismatch.
The lesson is blunt. Manual reporting isn’t a minor annoyance. It’s an operating risk. If you want to stop manual data pulls, stop treating them like harmless admin work.
Your Two Paths Away from Spreadsheet Hell
You have two ways out. One is traditional BI. The other is the practical route for most non-technical leaders.
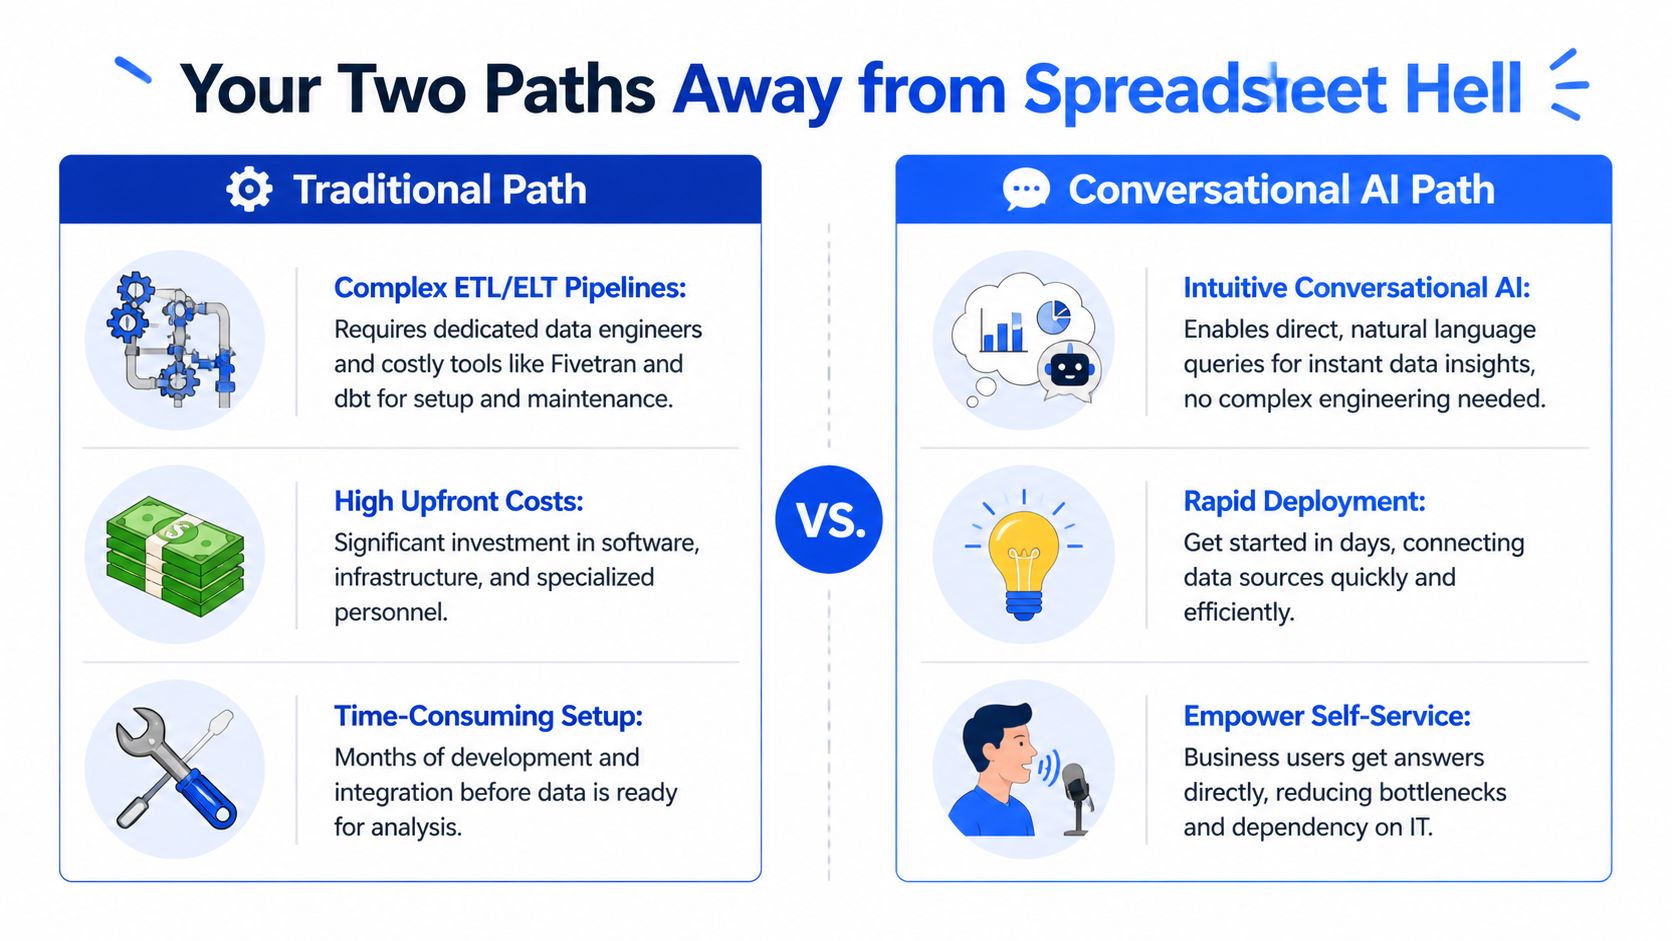
Path one is build the full stack
This is the classic answer. Stand up connectors, define transformations, centralize everything in a warehouse, model metrics, then layer BI on top. On paper, it’s clean. In practice, it often means engineering tickets, tool sprawl, and a long setup cycle before business teams see anything useful.
The architecture can make sense for large organizations with dedicated data teams. It’s often overkill for a founder, PM, or growth lead who just needs trustworthy answers now.
You’ll hear names like Airflow, dbt, Snowflake, Great Expectations, CDC, semantic models. Those tools are real and useful. They’re also not what most busy operators want to become experts in.
Path two is leapfrog to conversational analytics
This is the path most SMB teams should seriously consider first. Connect your sources, define trusted metrics, and let business users query the data in plain English through a semantic layer. No waiting for ad hoc SQL. No weekly export ritual.
That matters because a 2024 O’Reilly survey summarized by Slingr found 68% of SMB data practitioners spend over 20 hours weekly on manual extraction, with 25% error rates in reports, while only 15% have adopted no-code automation, largely because integration complexity blocks them. That’s the trap. Teams know manual work is bad, but the traditional alternative feels too heavy.
A conversational setup bypasses a lot of that complexity. You’re not building a mini data engineering department just to answer “Which channel drove the highest-value customers last month?”
Old way vs new way
Metric | Old Way (Manual Pulls & Traditional BI) | New Way (Statspresso Conversational AI) |
|---|---|---|
Getting the data | Export from Shopify, HubSpot, Postgres, then clean and combine manually | Connect sources once and query connected data in plain English |
Who can answer questions | Analyst, engineer, or spreadsheet power user | Founders, PMs, marketers, and analysts |
Speed to first insight | Delayed by requests, cleanup, and revisions | Immediate question-and-answer workflow |
Metric consistency | Definitions drift across files and teams | Central definitions in a governed layer |
Follow-up questions | Usually another ticket or another spreadsheet | Ask another question in the same thread |
Team dependency | High dependence on technical staff | Self-serve for business users |
What I’d recommend if you’re not technical
Don’t start by buying five tools and planning a giant rebuild. Start by identifying the handful of questions your team asks constantly, then choose the shortest route to reliable answers.
For example:
A founder usually needs revenue, pipeline, retention, and burn-related visibility.
A product manager wants activation, engagement, and cohort behavior.
A marketing lead needs spend efficiency, conversion trends, and campaign attribution.
An agency lead needs repeatable client reporting without spreadsheet gymnastics.
If your organization needs stronger financial process discipline too, this guide to nonprofit financial clarity is a useful example of how structured systems replace patchwork admin habits. Different category, same principle. Better systems beat heroic manual effort.
Buy the minimum system that gives you trusted answers fast. Complexity is not maturity.
For many teams, that means using a Conversational AI Data Analyst instead of rebuilding the entire traditional BI stack from scratch.
The Conversational Analytics Playbook in Action
The appeal of conversational analytics isn’t the AI itself. It’s the removal of friction between a business question and a usable answer.

Connect the sources you already use
Start with the systems your team already lives in. Shopify. HubSpot. Postgres. Maybe a Google Sheet if that’s where some operational reality still sits. The point is not to redesign your business before you start. The point is to remove the export loop.
Once connected, the data becomes queryable without forcing the user to write SQL or know the schema by heart.
Define the metrics once
The semantic layer is critical. Metric definitions like MRR or churn are centrally defined so the system knows what those terms mean. That structure is what lets natural language work without turning into guesswork.
According to Switchboard’s write-up on the move away from manual pipelines, conversational analytics platforms use that semantic layer so AI can translate natural-language questions into accurate results, and Gartner forecasts that 60% of AI initiatives are predicted to fail by 2026 without proper data quality and automation. The practical takeaway is simple. AI analytics is only useful when the underlying metric logic is controlled.
If you want a quick primer on how that interaction works in practice, read how to chat with your data.
Ask business questions, not database questions
This is the essential mindset shift. Don’t think in tables and joins. Think in decisions.
Try prompts like these:
Try asking a Conversational AI Data Analyst: “Show me my revenue by month for the last year as a bar chart.”
For product: “What’s our 30-day retention rate for users who signed up last quarter?”
For marketing: “Break down paid conversions by channel and campaign for the last 90 days.”
For sales: “Show average deal cycle length by segment.”
For operations: “Which customers had the highest ticket volume this month?”
Good questions produce useful charts. Better follow-up questions produce decisions.
Turn answers into a repeatable workflow
Once a chart answers a recurring question, save it somewhere the team can use it. Add it to a dashboard. Share it in Slack. Put it in Notion. Use it in a weekly review. The point is to stop rebuilding the same answer every week.
A practical playbook looks like this:
Start with one painful question your team asks all the time.
Connect the source systems behind that question.
Confirm the metric definition so everyone uses the same logic.
Ask the question in plain English and review the chart.
Refine with follow-up prompts until the output is decision-ready.
Save and share the insight so it becomes part of operating cadence.
If a PM can ask “why did activation drop last week?” and get a usable chart immediately, you’ve removed a real business bottleneck.
One mention worth making here: Statspresso is one example of a Conversational AI Data Analyst that connects sources like Shopify, HubSpot, Linear, and Postgres so teams can ask plain-English questions and get charts without SQL.
That’s the leapfrog move. You skip a lot of the ceremony and go straight to answers.
Making Your New Data Workflow Stick
Tools don’t fail because the dashboard was ugly. They fail because people don’t trust the numbers or don’t change their habits.

Resistance usually sounds reasonable
The pushback is rarely dramatic. It sounds sensible.
“We just want to double-check it manually.”
“Excel gives us more control.”
“I trust a number more when I can see exactly how it was pulled.”
That mindset is common. Regure’s summary of Gartner’s Q4 2025 Magic Quadrant says SMBs saw a 45% rise in AI adoption hesitation, and 62% of executives preferred manual oversight for ‘trustworthy metrics.’ That doesn’t mean those leaders are wrong. It means they’re worried about losing visibility into how numbers are produced.
Trust comes from visibility, not manual labor
Your job isn’t to tell the team to “trust the AI.” That’s lazy change management. Your job is to make the system easier to verify than the old spreadsheet process.
A workflow sticks when people can see:
Where the data comes from
How the core metrics are defined
Who owns those definitions
What changed when a result looks off
How to ask a follow-up question without filing a ticket
That creates more control, not less.
Roll it out in phases
Don’t try to automate every metric in one shot. Pick one use case that hurts enough to matter and is simple enough to prove quickly.
Good starter use cases:
Weekly revenue review for founders
Campaign performance for marketing leads
Activation and retention snapshots for product teams
Client reporting packs for agencies
Then formalize the habits around it.
Pick a single owner for metric definitions. Somebody must decide what counts as churn, MRR, or qualified lead.
Replace one recurring spreadsheet with one shared workflow.
Review the output in the same meeting every week so the team builds muscle memory.
Encourage follow-up questions live instead of offline report requests.
Archive approved insights so the team stops recreating the same charts.
The goal isn’t to remove humans. It’s to remove repetitive handling so humans can spend their time challenging the result, not assembling it.
If you do this right, the cultural shift is straightforward. Teams stop asking, “Who can pull this?” and start asking, “What do we want to know?”
TLDR Your Blueprint for Automated Insights
If you want to stop manual data pulls, don’t overcomplicate it. Replace the weekly export routine with a system that gives business teams direct access to trusted answers.
Here’s the blueprint:
Audit the repeat questions. List the questions your team asks every week. Revenue trend. CAC by channel. Churn by segment. Pipeline by owner.
Kill one spreadsheet first. Don’t launch a giant BI project. Replace the most painful recurring manual report.
Connect source systems once. Pull from the tools you already use instead of exporting files every time.
Define metrics clearly. Decide what terms like MRR, churn, retention, and qualified lead mean.
Use conversational analytics. Let non-technical users ask plain-English questions and get charts immediately.
Build trust in the workflow. Show where data comes from and how metrics are calculated.
Turn answers into operating habits. Save the useful charts, share them, and review them in regular meetings.
For leaders trying to tie better analytics to better spend decisions, this explainer on maximize profit with ROAS and ROI is a good reminder that the point of better reporting isn’t prettier dashboards. It’s sharper decisions.
Manual pulls create delay, confusion, and rework. Automated insights create speed and confidence.
Your Questions About Conversational AI Answered
Is it secure
It should be, or you shouldn’t use it.
The baseline to look for is read-only access, clear permissions, and encryption in transit and at rest. You want a system that can answer questions from your data without changing the source data itself. You also want workspace controls so people only see the data they’re supposed to see.
Ask direct questions during evaluation. Who can access what. How are credentials handled. Can the system operate with least-privilege access. If a vendor gets slippery here, move on.
What if my data is messy
It probably is. That’s normal.
You do not need perfect data to get started. You need data that’s good enough for a narrow, useful use case. Start with a metric you can define cleanly and a source you trust reasonably well. Then improve from there.
Messy data is not an argument for manual pulls. It’s usually an argument for better definitions and less spreadsheet handling.
How does pricing usually work
Most modern analytics tools scale by seats, workspaces, connected sources, usage, or some mix of those. The important question isn’t just price. It’s whether the tool replaces enough recurring manual work to justify itself quickly.
A bloated BI stack can be expensive in software and labor. A simpler conversational model often makes more sense for founders and lean teams because it reduces dependence on specialists for everyday questions.
If you’re evaluating options, keep the buying test brutally simple. Can a non-technical person connect a source, ask a real business question, and trust the answer without waiting on an analyst? If yes, you’re close.
If you’re done babysitting CSVs, connect your first data source in Statspresso and ask your first question. That’s the fastest route from spreadsheet hell to instant answers.
You asked for a “quick number” on Monday. By Wednesday, someone has exported a CSV from HubSpot, someone else has patched it with Shopify data, and your analyst is still cleaning column names in a spreadsheet. Meanwhile, you’re deciding budget, roadmap, or hiring from stale data.
That’s not a talent problem. It’s a workflow problem.
Waiting on manual exports and ad hoc SQL is old-school BI. The fix is simpler than it seems. If you want to stop manual data pulls, you need a workflow where business people can ask plain-English questions and get answers instantly. The same logic that makes AI-powered sales research useful for go-to-market teams applies here too. Remove repetitive grunt work, keep humans focused on judgment, and stop pretending CSV wrangling is strategy.
Your Last Manual Data Pull Was Yesterday
Founders usually notice the problem in small moments. A board question. A campaign review. A product meeting where nobody agrees on “active users” because three people pulled the number three different ways.
The ugly part is how normal this becomes. Teams start treating delays, spreadsheet version confusion, and “let me get back to you” as standard operating procedure. They build workarounds instead of fixing the pipe.
Manual pulls feel harmless because each one is small. The damage comes from repetition.
If your marketing lead exports from HubSpot every week, your ops lead cleans data in Sheets, and your analyst rewrites the same SQL every Friday, you don’t have reporting. You have a recurring manual labor system with a reporting label slapped on top.
The better model is self-serve analytics that business people can readily use. A Conversational AI Data Analyst changes the job from “prepare the data by hand” to “ask a good question.” That’s the shift that matters. Skip the SQL. Just ask your data a question and get a chart in seconds.
The True Cost of Your Weekly CSV Export
The weekly CSV ritual looks cheap because it hides its cost in small chunks. Ten minutes here. Half an hour there. A late-night Slack message to “double check the numbers.” Add enough of those together and your team is spending serious energy just moving data around.
The time cost is obvious
Manual pulls steal attention from work that changes the business. Instead of analyzing why conversion dropped, someone is fixing date formats. Instead of spotting churn risk, someone is matching customer IDs across tools.
That’s bad enough. But time isn’t the biggest problem.
The error cost is worse
Manual data entry and pulls have error rates ranging from 18% to 40%, according to Parseur’s analysis of manual work reduction. That same analysis notes the source of the problem is simple and familiar. Repetitive, fatigue-heavy work like copying invoice fields or customer information creates mistakes that then bleed into reporting and billing.
Those errors don’t stay contained in a spreadsheet. They move downstream into dashboards, reviews, forecasts, and customer conversations.
A bad formula can survive for weeks because it “looks about right.” A mismatched export can distort campaign performance. A duplicated row can make a channel seem better than it is. None of this is dramatic in the moment. It’s just enough to make your decisions worse.
The opportunity cost is what founders underestimate
If your team spends the week collecting data, they aren’t spending the week interpreting it. That’s the primary loss. Manual reporting delays the answer and lowers confidence in the answer once you finally get it.
Here’s what that usually looks like:
Marketing waits to adjust spend because acquisition data is still being reconciled.
Product delays a release call because retention numbers don’t match across tools.
Sales leaders argue over pipeline quality because exports were pulled at different times.
Founders default to instinct because the “real number” won’t be ready until tomorrow.
Practical rule: If a metric takes multiple people and multiple files to produce, it’s too fragile to run the business on.
This gets worse in SaaS and ecommerce teams because the data lives everywhere. Shopify, HubSpot, Postgres, Stripe, support tools, product analytics, maybe a warehouse if you’re lucky. Every extra source creates another chance for a manual mismatch.
The lesson is blunt. Manual reporting isn’t a minor annoyance. It’s an operating risk. If you want to stop manual data pulls, stop treating them like harmless admin work.
Your Two Paths Away from Spreadsheet Hell
You have two ways out. One is traditional BI. The other is the practical route for most non-technical leaders.
Path one is build the full stack
This is the classic answer. Stand up connectors, define transformations, centralize everything in a warehouse, model metrics, then layer BI on top. On paper, it’s clean. In practice, it often means engineering tickets, tool sprawl, and a long setup cycle before business teams see anything useful.
The architecture can make sense for large organizations with dedicated data teams. It’s often overkill for a founder, PM, or growth lead who just needs trustworthy answers now.
You’ll hear names like Airflow, dbt, Snowflake, Great Expectations, CDC, semantic models. Those tools are real and useful. They’re also not what most busy operators want to become experts in.
Path two is leapfrog to conversational analytics
This is the path most SMB teams should seriously consider first. Connect your sources, define trusted metrics, and let business users query the data in plain English through a semantic layer. No waiting for ad hoc SQL. No weekly export ritual.
That matters because a 2024 O’Reilly survey summarized by Slingr found 68% of SMB data practitioners spend over 20 hours weekly on manual extraction, with 25% error rates in reports, while only 15% have adopted no-code automation, largely because integration complexity blocks them. That’s the trap. Teams know manual work is bad, but the traditional alternative feels too heavy.
A conversational setup bypasses a lot of that complexity. You’re not building a mini data engineering department just to answer “Which channel drove the highest-value customers last month?”
Old way vs new way
Metric | Old Way (Manual Pulls & Traditional BI) | New Way (Statspresso Conversational AI) |
|---|---|---|
Getting the data | Export from Shopify, HubSpot, Postgres, then clean and combine manually | Connect sources once and query connected data in plain English |
Who can answer questions | Analyst, engineer, or spreadsheet power user | Founders, PMs, marketers, and analysts |
Speed to first insight | Delayed by requests, cleanup, and revisions | Immediate question-and-answer workflow |
Metric consistency | Definitions drift across files and teams | Central definitions in a governed layer |
Follow-up questions | Usually another ticket or another spreadsheet | Ask another question in the same thread |
Team dependency | High dependence on technical staff | Self-serve for business users |
What I’d recommend if you’re not technical
Don’t start by buying five tools and planning a giant rebuild. Start by identifying the handful of questions your team asks constantly, then choose the shortest route to reliable answers.
For example:
A founder usually needs revenue, pipeline, retention, and burn-related visibility.
A product manager wants activation, engagement, and cohort behavior.
A marketing lead needs spend efficiency, conversion trends, and campaign attribution.
An agency lead needs repeatable client reporting without spreadsheet gymnastics.
If your organization needs stronger financial process discipline too, this guide to nonprofit financial clarity is a useful example of how structured systems replace patchwork admin habits. Different category, same principle. Better systems beat heroic manual effort.
Buy the minimum system that gives you trusted answers fast. Complexity is not maturity.
For many teams, that means using a Conversational AI Data Analyst instead of rebuilding the entire traditional BI stack from scratch.
The Conversational Analytics Playbook in Action
The appeal of conversational analytics isn’t the AI itself. It’s the removal of friction between a business question and a usable answer.
Connect the sources you already use
Start with the systems your team already lives in. Shopify. HubSpot. Postgres. Maybe a Google Sheet if that’s where some operational reality still sits. The point is not to redesign your business before you start. The point is to remove the export loop.
Once connected, the data becomes queryable without forcing the user to write SQL or know the schema by heart.
Define the metrics once
The semantic layer is critical. Metric definitions like MRR or churn are centrally defined so the system knows what those terms mean. That structure is what lets natural language work without turning into guesswork.
According to Switchboard’s write-up on the move away from manual pipelines, conversational analytics platforms use that semantic layer so AI can translate natural-language questions into accurate results, and Gartner forecasts that 60% of AI initiatives are predicted to fail by 2026 without proper data quality and automation. The practical takeaway is simple. AI analytics is only useful when the underlying metric logic is controlled.
If you want a quick primer on how that interaction works in practice, read how to chat with your data.
Ask business questions, not database questions
This is the essential mindset shift. Don’t think in tables and joins. Think in decisions.
Try prompts like these:
Try asking a Conversational AI Data Analyst: “Show me my revenue by month for the last year as a bar chart.”
For product: “What’s our 30-day retention rate for users who signed up last quarter?”
For marketing: “Break down paid conversions by channel and campaign for the last 90 days.”
For sales: “Show average deal cycle length by segment.”
For operations: “Which customers had the highest ticket volume this month?”
Good questions produce useful charts. Better follow-up questions produce decisions.
Turn answers into a repeatable workflow
Once a chart answers a recurring question, save it somewhere the team can use it. Add it to a dashboard. Share it in Slack. Put it in Notion. Use it in a weekly review. The point is to stop rebuilding the same answer every week.
A practical playbook looks like this:
Start with one painful question your team asks all the time.
Connect the source systems behind that question.
Confirm the metric definition so everyone uses the same logic.
Ask the question in plain English and review the chart.
Refine with follow-up prompts until the output is decision-ready.
Save and share the insight so it becomes part of operating cadence.
If a PM can ask “why did activation drop last week?” and get a usable chart immediately, you’ve removed a real business bottleneck.
One mention worth making here: Statspresso is one example of a Conversational AI Data Analyst that connects sources like Shopify, HubSpot, Linear, and Postgres so teams can ask plain-English questions and get charts without SQL.
That’s the leapfrog move. You skip a lot of the ceremony and go straight to answers.
Making Your New Data Workflow Stick
Tools don’t fail because the dashboard was ugly. They fail because people don’t trust the numbers or don’t change their habits.
Resistance usually sounds reasonable
The pushback is rarely dramatic. It sounds sensible.
“We just want to double-check it manually.”
“Excel gives us more control.”
“I trust a number more when I can see exactly how it was pulled.”
That mindset is common. Regure’s summary of Gartner’s Q4 2025 Magic Quadrant says SMBs saw a 45% rise in AI adoption hesitation, and 62% of executives preferred manual oversight for ‘trustworthy metrics.’ That doesn’t mean those leaders are wrong. It means they’re worried about losing visibility into how numbers are produced.
Trust comes from visibility, not manual labor
Your job isn’t to tell the team to “trust the AI.” That’s lazy change management. Your job is to make the system easier to verify than the old spreadsheet process.
A workflow sticks when people can see:
Where the data comes from
How the core metrics are defined
Who owns those definitions
What changed when a result looks off
How to ask a follow-up question without filing a ticket
That creates more control, not less.
Roll it out in phases
Don’t try to automate every metric in one shot. Pick one use case that hurts enough to matter and is simple enough to prove quickly.
Good starter use cases:
Weekly revenue review for founders
Campaign performance for marketing leads
Activation and retention snapshots for product teams
Client reporting packs for agencies
Then formalize the habits around it.
Pick a single owner for metric definitions. Somebody must decide what counts as churn, MRR, or qualified lead.
Replace one recurring spreadsheet with one shared workflow.
Review the output in the same meeting every week so the team builds muscle memory.
Encourage follow-up questions live instead of offline report requests.
Archive approved insights so the team stops recreating the same charts.
The goal isn’t to remove humans. It’s to remove repetitive handling so humans can spend their time challenging the result, not assembling it.
If you do this right, the cultural shift is straightforward. Teams stop asking, “Who can pull this?” and start asking, “What do we want to know?”
TLDR Your Blueprint for Automated Insights
If you want to stop manual data pulls, don’t overcomplicate it. Replace the weekly export routine with a system that gives business teams direct access to trusted answers.
Here’s the blueprint:
Audit the repeat questions. List the questions your team asks every week. Revenue trend. CAC by channel. Churn by segment. Pipeline by owner.
Kill one spreadsheet first. Don’t launch a giant BI project. Replace the most painful recurring manual report.
Connect source systems once. Pull from the tools you already use instead of exporting files every time.
Define metrics clearly. Decide what terms like MRR, churn, retention, and qualified lead mean.
Use conversational analytics. Let non-technical users ask plain-English questions and get charts immediately.
Build trust in the workflow. Show where data comes from and how metrics are calculated.
Turn answers into operating habits. Save the useful charts, share them, and review them in regular meetings.
For leaders trying to tie better analytics to better spend decisions, this explainer on maximize profit with ROAS and ROI is a good reminder that the point of better reporting isn’t prettier dashboards. It’s sharper decisions.
Manual pulls create delay, confusion, and rework. Automated insights create speed and confidence.
Your Questions About Conversational AI Answered
Is it secure
It should be, or you shouldn’t use it.
The baseline to look for is read-only access, clear permissions, and encryption in transit and at rest. You want a system that can answer questions from your data without changing the source data itself. You also want workspace controls so people only see the data they’re supposed to see.
Ask direct questions during evaluation. Who can access what. How are credentials handled. Can the system operate with least-privilege access. If a vendor gets slippery here, move on.
What if my data is messy
It probably is. That’s normal.
You do not need perfect data to get started. You need data that’s good enough for a narrow, useful use case. Start with a metric you can define cleanly and a source you trust reasonably well. Then improve from there.
Messy data is not an argument for manual pulls. It’s usually an argument for better definitions and less spreadsheet handling.
How does pricing usually work
Most modern analytics tools scale by seats, workspaces, connected sources, usage, or some mix of those. The important question isn’t just price. It’s whether the tool replaces enough recurring manual work to justify itself quickly.
A bloated BI stack can be expensive in software and labor. A simpler conversational model often makes more sense for founders and lean teams because it reduces dependence on specialists for everyday questions.
If you’re evaluating options, keep the buying test brutally simple. Can a non-technical person connect a source, ask a real business question, and trust the answer without waiting on an analyst? If yes, you’re close.
If you’re done babysitting CSVs, connect your first data source in Statspresso and ask your first question. That’s the fastest route from spreadsheet hell to instant answers.