

Real Time Data Analytics: A Founder's Guide for 2026

Waiting weeks for a data analyst to build a dashboard is a relic of the past. Your ad spend changes by the hour. Users drop off during onboarding today, not next Tuesday. Inventory moves while someone is still cleaning a CSV.
That’s why real time data analytics matters to founders, product managers, and growth leads. It closes the gap between a business question and a useful answer. The market shift is already clear. The global real-time data analytics market is projected to reach $31.7 billion by 2026 at a 17.1% CAGR (SuperAGI).
Your Data Has Answers You Need Right Now
Organizations often don’t have a data problem. They have a delay problem.
The data exists in Shopify, Postgres, HubSpot, Stripe, product logs, and support tools. But the answer arrives after the moment has passed. By then, the campaign is over, the churn spike is old news, and the ops issue has already cost you money.
Real time data analytics changes the timing of decision-making. Instead of asking, “What happened last week?” you can ask, “What’s happening right now, and should we act?”
That doesn’t mean every company needs a giant engineering team or a command center full of screens. It means the modern stack can turn fresh data into useful answers fast enough to guide real decisions.
Practical rule: If your team makes choices in minutes but sees data in days, your reporting setup is out of sync with your business.
For non-technical leaders, that’s the fundamental shift. You don’t need to become a SQL expert. You need a way to ask better questions and get answers while they still matter.
What Is Real-Time Analytics (And Why Isn't It a Spreadsheet?)
A spreadsheet is useful. It’s also usually a snapshot.
That’s the key distinction. Traditional reporting works like a photo of a lake. You capture a moment, stare at it, and try to infer what happened. Real-time analytics works like watching a river. Data keeps moving, and you can respond while it’s still flowing.
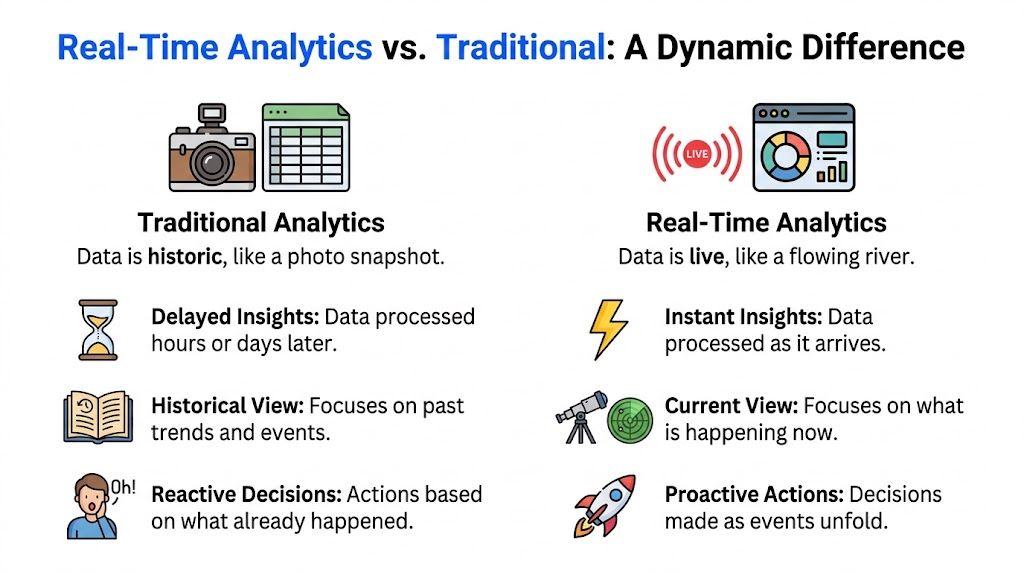
The lake, the slideshow, and the river
Here’s the plain-English version.
Batch processing means data is collected and processed later. Think nightly exports, end-of-day reports, or a dashboard that refreshes tomorrow morning.
Near real-time means updates happen frequently, but not instantly. It’s more like taking a photo every few minutes.
True real-time streaming means data is processed as it arrives, so you can detect and react to events almost immediately.
If your Google Sheet updates every hour, that may be useful. It just isn’t real time analytics.
Why timing changes the value of the answer
The difference isn’t philosophical. It changes what your team can do.
A batch report tells you a checkout flow broke yesterday. Helpful, but expensive. A near real-time alert tells you conversion is slipping this morning. Better. A real-time signal tells you the issue started moments ago, while you still have a chance to pause traffic, fix the bug, and limit the damage.
That’s why teams care about freshness. Some questions are historical by nature. Board reporting, quarterly planning, and trend analysis fit that bucket. Other questions are live:
Marketing: Which ads are wasting spend right now?
Product: Did today’s release hurt activation?
Operations: Is unusual account activity happening this minute?
Sales: Which demo requests just came in and need follow-up now?
When the answer needs to shape an action today, stale data gets pricey.
Why spreadsheets feel close, but aren’t the same
This trips people up because modern spreadsheets can import data on a schedule. They look dynamic. They can even feel fast.
But they still rely on refresh cycles, manual cleanup, and static logic. They’re excellent for light analysis and planning. They’re weak for continuously changing business conditions.
Real-time systems behave differently:
They ingest events continuously
They update calculations as new data arrives
They can trigger alerts or downstream actions
They let teams inspect current conditions, not just archives
That’s where tools like webhooks come in. If you want a simple primer on how systems pass updates between each other, this guide to real-time data and automation is useful because it explains the mechanics without drowning you in jargon.
Fresh data matters most when the next action depends on what happened a few seconds ago, not what happened after lunch.
The founder-friendly way to think about it
Don’t get stuck on purity. Start with the business question.
If you run paid acquisition, “near real-time” might be enough for many decisions. If you’re screening transactions for fraud, you may need true streaming. If you’re checking weekly retention, a daily batch might be perfectly fine.
The point of real time data analytics isn’t speed for its own sake. It’s decision speed that matches business reality.
Try asking your analytics tool: “Show me signups by hour for today and compare them with the same day last week.”
That one question usually reveals whether your reporting setup is built for yesterday or today.
The Engine Behind Instant Insights
Real-time analytics sounds magical until you peek under the hood. Then you realize it’s mostly a very organized relay race.
Data gets created somewhere. It gets moved fast. It gets processed. Then it shows up where a human can use it.

Stage one producers create events
A producer is anything that emits data.
That could be your app sending a “user signed up” event. It could be Shopify recording an order. It could be a payment system logging a failed charge. Each action becomes an event with a timestamp and some context.
You can think of producers as cashiers handing receipts into a system. The receipts keep coming. Some businesses create a trickle. Others create a firehose.
What matters is consistency. If the event isn’t captured cleanly, the rest of the pipeline is guessing.
Stage two ingestion acts like a mail sorter
Once events are created, they need to enter the system without piling up.
This is the ingestion layer. Tools like Apache Kafka often live here. Their job is to accept fast-moving streams of data and route them where they need to go. If producers are cashiers, ingestion is the sorting room behind the counter.
Modern real-time databases are built for this kind of pressure. Columnar storage can reduce storage costs by up to 10x while supporting high-throughput ingestion and sub-second latency (CrateDB). That’s part of why these systems can handle huge volumes without slowing to a crawl.
If you’ve ever wondered why older reporting setups buckle under heavy traffic, that’s usually the reason. They weren’t built for continuous flow.
Stage three processing does the math while data is moving
The live part happens here.
A processing engine filters, enriches, joins, and aggregates events as they arrive. Instead of waiting for a nightly batch job, it can answer questions in motion. Think of it as a calculator that never stops.
Examples help:
A stream of orders arrives. The processor groups them by product and region.
A stream of signups arrives. The processor compares today’s activation path against a baseline.
A stream of login attempts arrives. The processor flags suspicious patterns for review.
A lot of this speed comes from in-memory computing, which means the system works with data in fast-access memory instead of repeatedly pulling from slower disk storage.
Under the hood: Event-driven architecture means the system responds when something happens, instead of waiting for a scheduled report to wake up.
This architecture also changes how teams model data. If you want a practical foundation for analytics-ready structures, this breakdown of the star schema data model is a useful companion because it shows how clean dimensions and facts make reporting far easier.
Stage four serving delivers the answer where people need it
The final step is the part your team sees.
Processed data gets served to dashboards, alerts, product surfaces, or chat-style analytics interfaces, enabling a founder to ask, “What are today’s top conversion drop-off points?” and expect something more helpful than a blank stare.
Serving matters because speed without usability is just expensive plumbing.
A healthy real-time setup should make it easy to:
View live metrics on dashboards
Trigger alerts when values drift or spike
Compare fresh data with historical context
Share answers with non-technical teammates
Why all this complexity shouldn’t become your problem
The technical stack behind real time data analytics is not simple. Producers, streams, processors, storage layers, and serving systems each introduce design choices.
That’s exactly why most non-technical leaders shouldn’t build the whole thing from scratch unless live data is core to the product itself. You need to understand enough to ask smart questions:
Where does the data originate?
How quickly does it need to be available?
What logic runs on arrival?
Where do people consume the output?
If you can answer those four, you can evaluate tools without pretending to be a streaming engineer.
Try asking your team: “Which business events do we capture the moment they happen, and which ones still wait for a batch job?”
That question usually exposes the bottleneck fast.
Business Use Cases That Actually Drive Growth
A founder checks the numbers at 2 p.m. Ad spend is climbing, signups look soft, and support tickets are inching up. The hard part is not finding more charts. The hard part is knowing what needs action before the day is over.
That is where real time analytics earns its keep. It helps a team spot a change while there is still time to respond, not after the cost is already locked in. For startups and SMBs, that speed matters because growth problems usually start small. A weak campaign, a broken signup step, a payment issue, or a rising support queue can all look harmless for a few hours.
For a non-technical leader, the practical question is simple. Which decisions get better if the answer arrives now instead of tomorrow?

Marketing can fix wasted spend during the campaign
Marketing is one of the clearest starting points because money leaves fast.
A growth lead launches several paid campaigns in the morning. By lunch, one channel is generating clicks but very few conversions. Another audience is converting well, but only on mobile. If the team waits for tomorrow's report, the budget keeps flowing to the weak path.
Real time analytics lets the team treat campaign data like a live control panel instead of a recap. They can pause poor creative, shift spend toward the stronger audience, and check whether the problem sits in the ad, the landing page, or the form.
Useful questions look like this:
“Show me conversions by campaign for today, updated hourly.”
“Which landing pages have the biggest drop in conversion this afternoon?”
“Compare paid signups by source for the last six hours.”
The point is not faster reporting. It is faster correction.
Product teams can see friction right after a release
Product work creates a steady stream of small bets. A new onboarding step, pricing page change, or feature launch may help. It may also subtly hurt activation.
Without fresh feedback, a team can spend days arguing from intuition. With real time analytics, they can watch new user behavior shortly after the release goes live. That shortens the gap between shipping and learning.
A simple analogy helps here. Batch reporting is like checking game footage the next day. Real time analytics is like seeing the scoreboard while the match is still on.
Practical prompts for product teams:
“Show activation rate for users who signed up today by onboarding version.”
“Where are new users dropping off in the signup funnel right now?”
“Compare feature usage this week before and after today’s release.”
For a founder, the "so what" is direct. Bad changes get caught sooner, and good changes get confirmed sooner.
Operations can stop small issues from turning into expensive ones
Operations is often where the return shows up fastest.
Late detection makes ordinary problems expensive. Failed payments pile up. Suspicious login activity spreads. Inventory errors create angry customer emails. Support queues stretch until response times slip.
Real time monitoring helps ops teams catch patterns while they are still containable. That matters in e-commerce, SaaS, and service businesses, not just banks or large enterprises. The same principle behind real-time agent assistance technology applies here. Guidance is more useful during the event than after the fact.
A few examples:
E-commerce ops: Spot unusual order bursts from the same device or payment pattern.
SaaS ops: Notice repeated failed logins, account lockouts, or suspicious API usage.
Support leaders: Watch ticket volume and response backlog so service quality stays under control.
Questions worth asking:
“Show failed payment attempts by hour for today.”
“List accounts with unusual login activity in the last day.”
“Track open support tickets by priority in real time.”
Leadership gets a live operating view, not a pile of reports
Founders rarely need ten more dashboards. They need a short list of answers tied to action.
Real time analytics helps leadership check four things quickly:
What changed today
Whether the change looks normal or unusual
Who should respond
How fast the issue is growing
That is the practical adoption path many non-technical teams miss. You do not need to begin with a huge streaming program or a custom data platform. You can start with a few high-value questions, connect the right events, and use conversational AI to ask for answers in plain English.
Try asking your analytics tool: “Show me today’s key funnel metrics compared with yesterday at the same time.”
If the answer arrives in time to change a decision, real time analytics is helping the business grow. If it arrives after the meeting, it is still reporting.
The Old Way vs The New Way of Getting Answers
Most BI frustration has nothing to do with data literacy. It comes from process.
A marketer asks a simple question. A PM writes a Slack message. A founder wants one chart before the board prep call. Then the request enters the ritual. Ticket. Queue. Clarification. SQL. Dashboard tweak. Follow-up question. Another queue.
That workflow used to be normal. It’s now just slow.
A useful comparison comes from support operations. If you’ve seen how real-time agent assistance technology gives reps live guidance during a conversation, the analogy fits. Analytics is going through a similar shift. Instead of waiting for after-the-fact interpretation, teams can get answers while the decision is still happening.
Getting data insights manual BI vs conversational AI
Step | The Old Way (Manual BI) | The New Way (Statspresso) |
|---|---|---|
Question starts | A stakeholder asks in plain English | A stakeholder asks in plain English |
Translation | Someone translates the question into SQL specs | The system interprets the question directly |
Queue | The request waits behind other work | The answer starts immediately |
Build | An analyst writes queries and shapes charts | A chart and explanation are generated from the connected data |
Follow-up | A new request restarts the process | The user asks a follow-up question in the same thread |
Output | Static dashboard or export | Interactive answer, chart, and dashboard-ready result |
Ownership | Insight depends on analyst bandwidth | Insight is self-serve for business teams |
What changes for a non-technical team
The big change isn’t only speed. It’s independence.
When business users can ask questions directly, the analyst’s role improves too. Analysts spend less time pulling one-off reports and more time improving definitions, modeling, governance, and high-value analysis.
That shift is healthier for everyone:
Founders stop waiting on basic KPI pulls
Growth teams test ideas faster
Product managers validate releases sooner
Analysts focus on harder work where they are needed
If every follow-up question requires a new ticket, the bottleneck isn’t curiosity. It’s the interface.
The real cost of the old way
The old model carries hidden costs:
Lost time: Answers arrive after decisions are forced.
Translation errors: The technical query doesn’t always match the business intent.
Dashboard sprawl: Teams create more static reports because asking new questions is painful.
Dependency drag: Simple insight requests compete with major analytics projects.
The new way doesn’t erase the need for data teams. It changes where they add value.
Try asking a conversational analytics tool: “Show me my revenue by month for the last year as a bar chart.”
That’s the benchmark. If a basic business question still turns into a two-week project, your analytics workflow is overdue for a redesign.
Common Hurdles and How to Leap Over Them
Real time data analytics can be messy to adopt. Anyone who tells you otherwise is either selling software or hasn’t had to clean event data on a Friday afternoon.
The biggest problems usually aren’t the flashy ones. They’re basic: bad inputs, too much architecture, and trying to go faster than the business needs.
A projected Gartner figure cited by DASCA says 68% of SMBs abandon real-time analytics projects due to costs and complexity, and only 22% reach full production scale (DASCA). That should make founders more practical, not more pessimistic.
Dirty data makes fast answers wrong
If your source data is inconsistent, real-time only helps you become confidently incorrect faster.
The usual culprits are familiar:
Broken event names: “checkout_start,” “checkout started,” and “begin_checkout” all mean the same thing until they don’t.
Missing context: Orders arrive, but campaign source or plan type is absent.
Duplicate records: The same event gets counted twice because ingestion retried.
Metric drift: Different teams define “active user” differently.
The fix isn’t glamorous. It’s discipline.
Start with one critical question and define it clearly. Pick a KPI that matters, such as activation, trial-to-paid conversion, or failed payments. Then standardize the source events and business logic behind it before adding more dashboards.
Reality check: Garbage in, garbage out still applies. Real-time systems just deliver the garbage faster.
Building from scratch gets expensive quickly
A custom stack sounds attractive when people list tools on a whiteboard. Kafka for ingestion. Flink for processing. A serving layer. Alerting. Storage. Observability. Access controls. Then someone has to maintain all of it.
That’s where projects stall. Not because the architecture is wrong, but because the ongoing operational burden is larger than expected.
If real-time analytics supports the business rather than defining the product, many teams should lean toward managed systems and simpler interfaces. You trade some flexibility for speed, focus, and a much lower chance of building a side business called “maintaining analytics plumbing.”
A practical adoption path looks like this:
Choose one use case tied to money, risk, or customer experience.
Connect a limited set of trusted sources instead of every tool under the sun.
Validate the metric definitions with business and data owners.
Expand after the first workflow proves useful.
You probably don’t need sub-second latency for everything
This is the part many teams miss.
Not every use case needs true streaming. Sometimes “fresh enough” wins. Daily retention reviews do not need instant event processing. A weekly board pack definitely doesn’t. Even many operating workflows work fine with short delays if they preserve simplicity and reduce cost.
The mistake is treating all analytics questions as if they belong to the same urgency class.
A simple mental model helps:
Question type | Speed needed | Example |
|---|---|---|
Strategic review | Historical | Quarterly growth trends |
Team management | Near real-time | Daily funnel checks |
Operational intervention | Real-time | Suspicious transactions or incident spikes |
This framing keeps you from overspending on speed where speed doesn’t help.
The practical way forward
If you’re a founder or PM, don’t start by asking for a real-time platform. Start by asking:
Which decisions suffer most from delayed data?
Which metrics are reliable enough to surface live?
Who needs to act when something changes?
What’s the cheapest path to getting that answer in front of them?
That gives you an adoption plan instead of a science project.
How Statspresso Accelerates Your Real-Time Journey
Many teams don’t need another dashboard builder. They need a shorter path from raw data to a trusted answer.
That’s where a Conversational AI Data Analyst is useful. Instead of forcing business users to learn SQL, model semantics, and chart settings before they can ask a question, the interface starts with the question itself.

Connect sources once, then ask in plain English
A practical setup usually starts with a few systems you already care about. Think Postgres for product data, Shopify for orders, HubSpot for leads, and maybe a support platform for ticket volume.
Once connected, the workflow gets simpler:
Ask a business question
Get a chart or answer
Refine with a follow-up
Pin useful results to a dashboard
Statspresso fits this model. It connects business data sources and lets users ask plain-English questions to get charts, numbers, and explanations without writing SQL. That makes it relevant for teams that want real time analytics access without building an engineering-heavy BI workflow.
Conversational analytics removes the translation tax
Traditional BI often breaks because the business question and the technical query drift apart.
A conversational layer helps by keeping the interaction closer to the original intent. Instead of writing a ticket that says, “Can someone pull funnel conversion by channel for the last two weeks and split by mobile versus desktop,” a user can just ask for it directly.
That matters for follow-up questions too.
A normal conversation might go like this:
“Show me signups by day for the last month.”
“Now split that by channel.”
“Filter to paid channels only.”
“Turn this into a bar chart.”
“Add it to my growth dashboard.”
That sequence feels closer to how teams think in meetings.
The best analytics interface is often the one that doesn’t make a smart person phrase a simple question like a database administrator.
Dashboards become a byproduct, not a project
This is an underrated shift.
When answers can be generated on demand, dashboards stop being giant upfront projects. They become a curated set of questions your team asks often. That’s healthier because the dashboard reflects actual operating needs instead of a once-a-quarter reporting brainstorm.
A few prompts worth trying:
“Show me my top landing pages by conversion rate this week.”
“Which campaigns drove the most qualified leads today?”
“Compare trial starts and paid conversions for the last 30 days.”
“List products with the biggest change in sales today versus yesterday.”
Try asking Statspresso: “What is my average customer lifetime value for users who signed up in the last 90 days?”
Why this approach works for non-technical leaders
Founders and PMs usually don’t want a deeper toolset. They want fewer steps.
Conversational analytics works because it removes three common frictions at once:
Technical friction: no need to write SQL for routine questions
Process friction: no need to wait in a reporting queue for every follow-up
Presentation friction: answers can become charts and dashboards quickly
That’s the practical win. You spend less time wrangling tooling and more time deciding what to do next.
Conclusion Your First Question Is Five Minutes Away
Real time data analytics used to sound like an engineering project. For many teams, it still can be. But the useful shift is simpler than that.
You have business questions that can’t wait for a weekly dashboard refresh. You have data spread across systems. And you need a way to turn that data into action before the moment passes.
That’s why this matters. Real-time analytics is not about collecting more charts. It’s about shortening the distance between signal and decision.
TL;DR
Real-time analytics helps teams act on fresh data instead of waiting for stale reports.
Batch, near real-time, and true streaming solve different problems. Don’t overbuild.
The core engine is straightforward in concept: events are produced, ingested, processed, and served.
Marketing, product, and operations all benefit when issues and opportunities surface while they still matter.
Conversational analytics gives non-technical teams a practical way to ask questions and get charts without SQL.
The smart adoption path starts with one valuable use case, clean data, and tools that reduce complexity.
Your first useful insight usually doesn’t require a giant transformation. It requires one connected source and one well-phrased question.
Connect your first data source in Statspresso and ask a plain-English question your team already needs answered today. Skip the SQL. Get a chart in seconds.
Waiting weeks for a data analyst to build a dashboard is a relic of the past. Your ad spend changes by the hour. Users drop off during onboarding today, not next Tuesday. Inventory moves while someone is still cleaning a CSV.
That’s why real time data analytics matters to founders, product managers, and growth leads. It closes the gap between a business question and a useful answer. The market shift is already clear. The global real-time data analytics market is projected to reach $31.7 billion by 2026 at a 17.1% CAGR (SuperAGI).
Your Data Has Answers You Need Right Now
Organizations often don’t have a data problem. They have a delay problem.
The data exists in Shopify, Postgres, HubSpot, Stripe, product logs, and support tools. But the answer arrives after the moment has passed. By then, the campaign is over, the churn spike is old news, and the ops issue has already cost you money.
Real time data analytics changes the timing of decision-making. Instead of asking, “What happened last week?” you can ask, “What’s happening right now, and should we act?”
That doesn’t mean every company needs a giant engineering team or a command center full of screens. It means the modern stack can turn fresh data into useful answers fast enough to guide real decisions.
Practical rule: If your team makes choices in minutes but sees data in days, your reporting setup is out of sync with your business.
For non-technical leaders, that’s the fundamental shift. You don’t need to become a SQL expert. You need a way to ask better questions and get answers while they still matter.
What Is Real-Time Analytics (And Why Isn't It a Spreadsheet?)
A spreadsheet is useful. It’s also usually a snapshot.
That’s the key distinction. Traditional reporting works like a photo of a lake. You capture a moment, stare at it, and try to infer what happened. Real-time analytics works like watching a river. Data keeps moving, and you can respond while it’s still flowing.

The lake, the slideshow, and the river
Here’s the plain-English version.
Batch processing means data is collected and processed later. Think nightly exports, end-of-day reports, or a dashboard that refreshes tomorrow morning.
Near real-time means updates happen frequently, but not instantly. It’s more like taking a photo every few minutes.
True real-time streaming means data is processed as it arrives, so you can detect and react to events almost immediately.
If your Google Sheet updates every hour, that may be useful. It just isn’t real time analytics.
Why timing changes the value of the answer
The difference isn’t philosophical. It changes what your team can do.
A batch report tells you a checkout flow broke yesterday. Helpful, but expensive. A near real-time alert tells you conversion is slipping this morning. Better. A real-time signal tells you the issue started moments ago, while you still have a chance to pause traffic, fix the bug, and limit the damage.
That’s why teams care about freshness. Some questions are historical by nature. Board reporting, quarterly planning, and trend analysis fit that bucket. Other questions are live:
Marketing: Which ads are wasting spend right now?
Product: Did today’s release hurt activation?
Operations: Is unusual account activity happening this minute?
Sales: Which demo requests just came in and need follow-up now?
When the answer needs to shape an action today, stale data gets pricey.
Why spreadsheets feel close, but aren’t the same
This trips people up because modern spreadsheets can import data on a schedule. They look dynamic. They can even feel fast.
But they still rely on refresh cycles, manual cleanup, and static logic. They’re excellent for light analysis and planning. They’re weak for continuously changing business conditions.
Real-time systems behave differently:
They ingest events continuously
They update calculations as new data arrives
They can trigger alerts or downstream actions
They let teams inspect current conditions, not just archives
That’s where tools like webhooks come in. If you want a simple primer on how systems pass updates between each other, this guide to real-time data and automation is useful because it explains the mechanics without drowning you in jargon.
Fresh data matters most when the next action depends on what happened a few seconds ago, not what happened after lunch.
The founder-friendly way to think about it
Don’t get stuck on purity. Start with the business question.
If you run paid acquisition, “near real-time” might be enough for many decisions. If you’re screening transactions for fraud, you may need true streaming. If you’re checking weekly retention, a daily batch might be perfectly fine.
The point of real time data analytics isn’t speed for its own sake. It’s decision speed that matches business reality.
Try asking your analytics tool: “Show me signups by hour for today and compare them with the same day last week.”
That one question usually reveals whether your reporting setup is built for yesterday or today.
The Engine Behind Instant Insights
Real-time analytics sounds magical until you peek under the hood. Then you realize it’s mostly a very organized relay race.
Data gets created somewhere. It gets moved fast. It gets processed. Then it shows up where a human can use it.

Stage one producers create events
A producer is anything that emits data.
That could be your app sending a “user signed up” event. It could be Shopify recording an order. It could be a payment system logging a failed charge. Each action becomes an event with a timestamp and some context.
You can think of producers as cashiers handing receipts into a system. The receipts keep coming. Some businesses create a trickle. Others create a firehose.
What matters is consistency. If the event isn’t captured cleanly, the rest of the pipeline is guessing.
Stage two ingestion acts like a mail sorter
Once events are created, they need to enter the system without piling up.
This is the ingestion layer. Tools like Apache Kafka often live here. Their job is to accept fast-moving streams of data and route them where they need to go. If producers are cashiers, ingestion is the sorting room behind the counter.
Modern real-time databases are built for this kind of pressure. Columnar storage can reduce storage costs by up to 10x while supporting high-throughput ingestion and sub-second latency (CrateDB). That’s part of why these systems can handle huge volumes without slowing to a crawl.
If you’ve ever wondered why older reporting setups buckle under heavy traffic, that’s usually the reason. They weren’t built for continuous flow.
Stage three processing does the math while data is moving
The live part happens here.
A processing engine filters, enriches, joins, and aggregates events as they arrive. Instead of waiting for a nightly batch job, it can answer questions in motion. Think of it as a calculator that never stops.
Examples help:
A stream of orders arrives. The processor groups them by product and region.
A stream of signups arrives. The processor compares today’s activation path against a baseline.
A stream of login attempts arrives. The processor flags suspicious patterns for review.
A lot of this speed comes from in-memory computing, which means the system works with data in fast-access memory instead of repeatedly pulling from slower disk storage.
Under the hood: Event-driven architecture means the system responds when something happens, instead of waiting for a scheduled report to wake up.
This architecture also changes how teams model data. If you want a practical foundation for analytics-ready structures, this breakdown of the star schema data model is a useful companion because it shows how clean dimensions and facts make reporting far easier.
Stage four serving delivers the answer where people need it
The final step is the part your team sees.
Processed data gets served to dashboards, alerts, product surfaces, or chat-style analytics interfaces, enabling a founder to ask, “What are today’s top conversion drop-off points?” and expect something more helpful than a blank stare.
Serving matters because speed without usability is just expensive plumbing.
A healthy real-time setup should make it easy to:
View live metrics on dashboards
Trigger alerts when values drift or spike
Compare fresh data with historical context
Share answers with non-technical teammates
Why all this complexity shouldn’t become your problem
The technical stack behind real time data analytics is not simple. Producers, streams, processors, storage layers, and serving systems each introduce design choices.
That’s exactly why most non-technical leaders shouldn’t build the whole thing from scratch unless live data is core to the product itself. You need to understand enough to ask smart questions:
Where does the data originate?
How quickly does it need to be available?
What logic runs on arrival?
Where do people consume the output?
If you can answer those four, you can evaluate tools without pretending to be a streaming engineer.
Try asking your team: “Which business events do we capture the moment they happen, and which ones still wait for a batch job?”
That question usually exposes the bottleneck fast.
Business Use Cases That Actually Drive Growth
A founder checks the numbers at 2 p.m. Ad spend is climbing, signups look soft, and support tickets are inching up. The hard part is not finding more charts. The hard part is knowing what needs action before the day is over.
That is where real time analytics earns its keep. It helps a team spot a change while there is still time to respond, not after the cost is already locked in. For startups and SMBs, that speed matters because growth problems usually start small. A weak campaign, a broken signup step, a payment issue, or a rising support queue can all look harmless for a few hours.
For a non-technical leader, the practical question is simple. Which decisions get better if the answer arrives now instead of tomorrow?

Marketing can fix wasted spend during the campaign
Marketing is one of the clearest starting points because money leaves fast.
A growth lead launches several paid campaigns in the morning. By lunch, one channel is generating clicks but very few conversions. Another audience is converting well, but only on mobile. If the team waits for tomorrow's report, the budget keeps flowing to the weak path.
Real time analytics lets the team treat campaign data like a live control panel instead of a recap. They can pause poor creative, shift spend toward the stronger audience, and check whether the problem sits in the ad, the landing page, or the form.
Useful questions look like this:
“Show me conversions by campaign for today, updated hourly.”
“Which landing pages have the biggest drop in conversion this afternoon?”
“Compare paid signups by source for the last six hours.”
The point is not faster reporting. It is faster correction.
Product teams can see friction right after a release
Product work creates a steady stream of small bets. A new onboarding step, pricing page change, or feature launch may help. It may also subtly hurt activation.
Without fresh feedback, a team can spend days arguing from intuition. With real time analytics, they can watch new user behavior shortly after the release goes live. That shortens the gap between shipping and learning.
A simple analogy helps here. Batch reporting is like checking game footage the next day. Real time analytics is like seeing the scoreboard while the match is still on.
Practical prompts for product teams:
“Show activation rate for users who signed up today by onboarding version.”
“Where are new users dropping off in the signup funnel right now?”
“Compare feature usage this week before and after today’s release.”
For a founder, the "so what" is direct. Bad changes get caught sooner, and good changes get confirmed sooner.
Operations can stop small issues from turning into expensive ones
Operations is often where the return shows up fastest.
Late detection makes ordinary problems expensive. Failed payments pile up. Suspicious login activity spreads. Inventory errors create angry customer emails. Support queues stretch until response times slip.
Real time monitoring helps ops teams catch patterns while they are still containable. That matters in e-commerce, SaaS, and service businesses, not just banks or large enterprises. The same principle behind real-time agent assistance technology applies here. Guidance is more useful during the event than after the fact.
A few examples:
E-commerce ops: Spot unusual order bursts from the same device or payment pattern.
SaaS ops: Notice repeated failed logins, account lockouts, or suspicious API usage.
Support leaders: Watch ticket volume and response backlog so service quality stays under control.
Questions worth asking:
“Show failed payment attempts by hour for today.”
“List accounts with unusual login activity in the last day.”
“Track open support tickets by priority in real time.”
Leadership gets a live operating view, not a pile of reports
Founders rarely need ten more dashboards. They need a short list of answers tied to action.
Real time analytics helps leadership check four things quickly:
What changed today
Whether the change looks normal or unusual
Who should respond
How fast the issue is growing
That is the practical adoption path many non-technical teams miss. You do not need to begin with a huge streaming program or a custom data platform. You can start with a few high-value questions, connect the right events, and use conversational AI to ask for answers in plain English.
Try asking your analytics tool: “Show me today’s key funnel metrics compared with yesterday at the same time.”
If the answer arrives in time to change a decision, real time analytics is helping the business grow. If it arrives after the meeting, it is still reporting.
The Old Way vs The New Way of Getting Answers
Most BI frustration has nothing to do with data literacy. It comes from process.
A marketer asks a simple question. A PM writes a Slack message. A founder wants one chart before the board prep call. Then the request enters the ritual. Ticket. Queue. Clarification. SQL. Dashboard tweak. Follow-up question. Another queue.
That workflow used to be normal. It’s now just slow.
A useful comparison comes from support operations. If you’ve seen how real-time agent assistance technology gives reps live guidance during a conversation, the analogy fits. Analytics is going through a similar shift. Instead of waiting for after-the-fact interpretation, teams can get answers while the decision is still happening.
Getting data insights manual BI vs conversational AI
Step | The Old Way (Manual BI) | The New Way (Statspresso) |
|---|---|---|
Question starts | A stakeholder asks in plain English | A stakeholder asks in plain English |
Translation | Someone translates the question into SQL specs | The system interprets the question directly |
Queue | The request waits behind other work | The answer starts immediately |
Build | An analyst writes queries and shapes charts | A chart and explanation are generated from the connected data |
Follow-up | A new request restarts the process | The user asks a follow-up question in the same thread |
Output | Static dashboard or export | Interactive answer, chart, and dashboard-ready result |
Ownership | Insight depends on analyst bandwidth | Insight is self-serve for business teams |
What changes for a non-technical team
The big change isn’t only speed. It’s independence.
When business users can ask questions directly, the analyst’s role improves too. Analysts spend less time pulling one-off reports and more time improving definitions, modeling, governance, and high-value analysis.
That shift is healthier for everyone:
Founders stop waiting on basic KPI pulls
Growth teams test ideas faster
Product managers validate releases sooner
Analysts focus on harder work where they are needed
If every follow-up question requires a new ticket, the bottleneck isn’t curiosity. It’s the interface.
The real cost of the old way
The old model carries hidden costs:
Lost time: Answers arrive after decisions are forced.
Translation errors: The technical query doesn’t always match the business intent.
Dashboard sprawl: Teams create more static reports because asking new questions is painful.
Dependency drag: Simple insight requests compete with major analytics projects.
The new way doesn’t erase the need for data teams. It changes where they add value.
Try asking a conversational analytics tool: “Show me my revenue by month for the last year as a bar chart.”
That’s the benchmark. If a basic business question still turns into a two-week project, your analytics workflow is overdue for a redesign.
Common Hurdles and How to Leap Over Them
Real time data analytics can be messy to adopt. Anyone who tells you otherwise is either selling software or hasn’t had to clean event data on a Friday afternoon.
The biggest problems usually aren’t the flashy ones. They’re basic: bad inputs, too much architecture, and trying to go faster than the business needs.
A projected Gartner figure cited by DASCA says 68% of SMBs abandon real-time analytics projects due to costs and complexity, and only 22% reach full production scale (DASCA). That should make founders more practical, not more pessimistic.
Dirty data makes fast answers wrong
If your source data is inconsistent, real-time only helps you become confidently incorrect faster.
The usual culprits are familiar:
Broken event names: “checkout_start,” “checkout started,” and “begin_checkout” all mean the same thing until they don’t.
Missing context: Orders arrive, but campaign source or plan type is absent.
Duplicate records: The same event gets counted twice because ingestion retried.
Metric drift: Different teams define “active user” differently.
The fix isn’t glamorous. It’s discipline.
Start with one critical question and define it clearly. Pick a KPI that matters, such as activation, trial-to-paid conversion, or failed payments. Then standardize the source events and business logic behind it before adding more dashboards.
Reality check: Garbage in, garbage out still applies. Real-time systems just deliver the garbage faster.
Building from scratch gets expensive quickly
A custom stack sounds attractive when people list tools on a whiteboard. Kafka for ingestion. Flink for processing. A serving layer. Alerting. Storage. Observability. Access controls. Then someone has to maintain all of it.
That’s where projects stall. Not because the architecture is wrong, but because the ongoing operational burden is larger than expected.
If real-time analytics supports the business rather than defining the product, many teams should lean toward managed systems and simpler interfaces. You trade some flexibility for speed, focus, and a much lower chance of building a side business called “maintaining analytics plumbing.”
A practical adoption path looks like this:
Choose one use case tied to money, risk, or customer experience.
Connect a limited set of trusted sources instead of every tool under the sun.
Validate the metric definitions with business and data owners.
Expand after the first workflow proves useful.
You probably don’t need sub-second latency for everything
This is the part many teams miss.
Not every use case needs true streaming. Sometimes “fresh enough” wins. Daily retention reviews do not need instant event processing. A weekly board pack definitely doesn’t. Even many operating workflows work fine with short delays if they preserve simplicity and reduce cost.
The mistake is treating all analytics questions as if they belong to the same urgency class.
A simple mental model helps:
Question type | Speed needed | Example |
|---|---|---|
Strategic review | Historical | Quarterly growth trends |
Team management | Near real-time | Daily funnel checks |
Operational intervention | Real-time | Suspicious transactions or incident spikes |
This framing keeps you from overspending on speed where speed doesn’t help.
The practical way forward
If you’re a founder or PM, don’t start by asking for a real-time platform. Start by asking:
Which decisions suffer most from delayed data?
Which metrics are reliable enough to surface live?
Who needs to act when something changes?
What’s the cheapest path to getting that answer in front of them?
That gives you an adoption plan instead of a science project.
How Statspresso Accelerates Your Real-Time Journey
Many teams don’t need another dashboard builder. They need a shorter path from raw data to a trusted answer.
That’s where a Conversational AI Data Analyst is useful. Instead of forcing business users to learn SQL, model semantics, and chart settings before they can ask a question, the interface starts with the question itself.

Connect sources once, then ask in plain English
A practical setup usually starts with a few systems you already care about. Think Postgres for product data, Shopify for orders, HubSpot for leads, and maybe a support platform for ticket volume.
Once connected, the workflow gets simpler:
Ask a business question
Get a chart or answer
Refine with a follow-up
Pin useful results to a dashboard
Statspresso fits this model. It connects business data sources and lets users ask plain-English questions to get charts, numbers, and explanations without writing SQL. That makes it relevant for teams that want real time analytics access without building an engineering-heavy BI workflow.
Conversational analytics removes the translation tax
Traditional BI often breaks because the business question and the technical query drift apart.
A conversational layer helps by keeping the interaction closer to the original intent. Instead of writing a ticket that says, “Can someone pull funnel conversion by channel for the last two weeks and split by mobile versus desktop,” a user can just ask for it directly.
That matters for follow-up questions too.
A normal conversation might go like this:
“Show me signups by day for the last month.”
“Now split that by channel.”
“Filter to paid channels only.”
“Turn this into a bar chart.”
“Add it to my growth dashboard.”
That sequence feels closer to how teams think in meetings.
The best analytics interface is often the one that doesn’t make a smart person phrase a simple question like a database administrator.
Dashboards become a byproduct, not a project
This is an underrated shift.
When answers can be generated on demand, dashboards stop being giant upfront projects. They become a curated set of questions your team asks often. That’s healthier because the dashboard reflects actual operating needs instead of a once-a-quarter reporting brainstorm.
A few prompts worth trying:
“Show me my top landing pages by conversion rate this week.”
“Which campaigns drove the most qualified leads today?”
“Compare trial starts and paid conversions for the last 30 days.”
“List products with the biggest change in sales today versus yesterday.”
Try asking Statspresso: “What is my average customer lifetime value for users who signed up in the last 90 days?”
Why this approach works for non-technical leaders
Founders and PMs usually don’t want a deeper toolset. They want fewer steps.
Conversational analytics works because it removes three common frictions at once:
Technical friction: no need to write SQL for routine questions
Process friction: no need to wait in a reporting queue for every follow-up
Presentation friction: answers can become charts and dashboards quickly
That’s the practical win. You spend less time wrangling tooling and more time deciding what to do next.
Conclusion Your First Question Is Five Minutes Away
Real time data analytics used to sound like an engineering project. For many teams, it still can be. But the useful shift is simpler than that.
You have business questions that can’t wait for a weekly dashboard refresh. You have data spread across systems. And you need a way to turn that data into action before the moment passes.
That’s why this matters. Real-time analytics is not about collecting more charts. It’s about shortening the distance between signal and decision.
TL;DR
Real-time analytics helps teams act on fresh data instead of waiting for stale reports.
Batch, near real-time, and true streaming solve different problems. Don’t overbuild.
The core engine is straightforward in concept: events are produced, ingested, processed, and served.
Marketing, product, and operations all benefit when issues and opportunities surface while they still matter.
Conversational analytics gives non-technical teams a practical way to ask questions and get charts without SQL.
The smart adoption path starts with one valuable use case, clean data, and tools that reduce complexity.
Your first useful insight usually doesn’t require a giant transformation. It requires one connected source and one well-phrased question.
Connect your first data source in Statspresso and ask a plain-English question your team already needs answered today. Skip the SQL. Get a chart in seconds.
Waiting weeks for a data analyst to build a dashboard is a relic of the past. Your ad spend changes by the hour. Users drop off during onboarding today, not next Tuesday. Inventory moves while someone is still cleaning a CSV.
That’s why real time data analytics matters to founders, product managers, and growth leads. It closes the gap between a business question and a useful answer. The market shift is already clear. The global real-time data analytics market is projected to reach $31.7 billion by 2026 at a 17.1% CAGR (SuperAGI).
Your Data Has Answers You Need Right Now
Organizations often don’t have a data problem. They have a delay problem.
The data exists in Shopify, Postgres, HubSpot, Stripe, product logs, and support tools. But the answer arrives after the moment has passed. By then, the campaign is over, the churn spike is old news, and the ops issue has already cost you money.
Real time data analytics changes the timing of decision-making. Instead of asking, “What happened last week?” you can ask, “What’s happening right now, and should we act?”
That doesn’t mean every company needs a giant engineering team or a command center full of screens. It means the modern stack can turn fresh data into useful answers fast enough to guide real decisions.
Practical rule: If your team makes choices in minutes but sees data in days, your reporting setup is out of sync with your business.
For non-technical leaders, that’s the fundamental shift. You don’t need to become a SQL expert. You need a way to ask better questions and get answers while they still matter.
What Is Real-Time Analytics (And Why Isn't It a Spreadsheet?)
A spreadsheet is useful. It’s also usually a snapshot.
That’s the key distinction. Traditional reporting works like a photo of a lake. You capture a moment, stare at it, and try to infer what happened. Real-time analytics works like watching a river. Data keeps moving, and you can respond while it’s still flowing.

The lake, the slideshow, and the river
Here’s the plain-English version.
Batch processing means data is collected and processed later. Think nightly exports, end-of-day reports, or a dashboard that refreshes tomorrow morning.
Near real-time means updates happen frequently, but not instantly. It’s more like taking a photo every few minutes.
True real-time streaming means data is processed as it arrives, so you can detect and react to events almost immediately.
If your Google Sheet updates every hour, that may be useful. It just isn’t real time analytics.
Why timing changes the value of the answer
The difference isn’t philosophical. It changes what your team can do.
A batch report tells you a checkout flow broke yesterday. Helpful, but expensive. A near real-time alert tells you conversion is slipping this morning. Better. A real-time signal tells you the issue started moments ago, while you still have a chance to pause traffic, fix the bug, and limit the damage.
That’s why teams care about freshness. Some questions are historical by nature. Board reporting, quarterly planning, and trend analysis fit that bucket. Other questions are live:
Marketing: Which ads are wasting spend right now?
Product: Did today’s release hurt activation?
Operations: Is unusual account activity happening this minute?
Sales: Which demo requests just came in and need follow-up now?
When the answer needs to shape an action today, stale data gets pricey.
Why spreadsheets feel close, but aren’t the same
This trips people up because modern spreadsheets can import data on a schedule. They look dynamic. They can even feel fast.
But they still rely on refresh cycles, manual cleanup, and static logic. They’re excellent for light analysis and planning. They’re weak for continuously changing business conditions.
Real-time systems behave differently:
They ingest events continuously
They update calculations as new data arrives
They can trigger alerts or downstream actions
They let teams inspect current conditions, not just archives
That’s where tools like webhooks come in. If you want a simple primer on how systems pass updates between each other, this guide to real-time data and automation is useful because it explains the mechanics without drowning you in jargon.
Fresh data matters most when the next action depends on what happened a few seconds ago, not what happened after lunch.
The founder-friendly way to think about it
Don’t get stuck on purity. Start with the business question.
If you run paid acquisition, “near real-time” might be enough for many decisions. If you’re screening transactions for fraud, you may need true streaming. If you’re checking weekly retention, a daily batch might be perfectly fine.
The point of real time data analytics isn’t speed for its own sake. It’s decision speed that matches business reality.
Try asking your analytics tool: “Show me signups by hour for today and compare them with the same day last week.”
That one question usually reveals whether your reporting setup is built for yesterday or today.
The Engine Behind Instant Insights
Real-time analytics sounds magical until you peek under the hood. Then you realize it’s mostly a very organized relay race.
Data gets created somewhere. It gets moved fast. It gets processed. Then it shows up where a human can use it.

Stage one producers create events
A producer is anything that emits data.
That could be your app sending a “user signed up” event. It could be Shopify recording an order. It could be a payment system logging a failed charge. Each action becomes an event with a timestamp and some context.
You can think of producers as cashiers handing receipts into a system. The receipts keep coming. Some businesses create a trickle. Others create a firehose.
What matters is consistency. If the event isn’t captured cleanly, the rest of the pipeline is guessing.
Stage two ingestion acts like a mail sorter
Once events are created, they need to enter the system without piling up.
This is the ingestion layer. Tools like Apache Kafka often live here. Their job is to accept fast-moving streams of data and route them where they need to go. If producers are cashiers, ingestion is the sorting room behind the counter.
Modern real-time databases are built for this kind of pressure. Columnar storage can reduce storage costs by up to 10x while supporting high-throughput ingestion and sub-second latency (CrateDB). That’s part of why these systems can handle huge volumes without slowing to a crawl.
If you’ve ever wondered why older reporting setups buckle under heavy traffic, that’s usually the reason. They weren’t built for continuous flow.
Stage three processing does the math while data is moving
The live part happens here.
A processing engine filters, enriches, joins, and aggregates events as they arrive. Instead of waiting for a nightly batch job, it can answer questions in motion. Think of it as a calculator that never stops.
Examples help:
A stream of orders arrives. The processor groups them by product and region.
A stream of signups arrives. The processor compares today’s activation path against a baseline.
A stream of login attempts arrives. The processor flags suspicious patterns for review.
A lot of this speed comes from in-memory computing, which means the system works with data in fast-access memory instead of repeatedly pulling from slower disk storage.
Under the hood: Event-driven architecture means the system responds when something happens, instead of waiting for a scheduled report to wake up.
This architecture also changes how teams model data. If you want a practical foundation for analytics-ready structures, this breakdown of the star schema data model is a useful companion because it shows how clean dimensions and facts make reporting far easier.
Stage four serving delivers the answer where people need it
The final step is the part your team sees.
Processed data gets served to dashboards, alerts, product surfaces, or chat-style analytics interfaces, enabling a founder to ask, “What are today’s top conversion drop-off points?” and expect something more helpful than a blank stare.
Serving matters because speed without usability is just expensive plumbing.
A healthy real-time setup should make it easy to:
View live metrics on dashboards
Trigger alerts when values drift or spike
Compare fresh data with historical context
Share answers with non-technical teammates
Why all this complexity shouldn’t become your problem
The technical stack behind real time data analytics is not simple. Producers, streams, processors, storage layers, and serving systems each introduce design choices.
That’s exactly why most non-technical leaders shouldn’t build the whole thing from scratch unless live data is core to the product itself. You need to understand enough to ask smart questions:
Where does the data originate?
How quickly does it need to be available?
What logic runs on arrival?
Where do people consume the output?
If you can answer those four, you can evaluate tools without pretending to be a streaming engineer.
Try asking your team: “Which business events do we capture the moment they happen, and which ones still wait for a batch job?”
That question usually exposes the bottleneck fast.
Business Use Cases That Actually Drive Growth
A founder checks the numbers at 2 p.m. Ad spend is climbing, signups look soft, and support tickets are inching up. The hard part is not finding more charts. The hard part is knowing what needs action before the day is over.
That is where real time analytics earns its keep. It helps a team spot a change while there is still time to respond, not after the cost is already locked in. For startups and SMBs, that speed matters because growth problems usually start small. A weak campaign, a broken signup step, a payment issue, or a rising support queue can all look harmless for a few hours.
For a non-technical leader, the practical question is simple. Which decisions get better if the answer arrives now instead of tomorrow?

Marketing can fix wasted spend during the campaign
Marketing is one of the clearest starting points because money leaves fast.
A growth lead launches several paid campaigns in the morning. By lunch, one channel is generating clicks but very few conversions. Another audience is converting well, but only on mobile. If the team waits for tomorrow's report, the budget keeps flowing to the weak path.
Real time analytics lets the team treat campaign data like a live control panel instead of a recap. They can pause poor creative, shift spend toward the stronger audience, and check whether the problem sits in the ad, the landing page, or the form.
Useful questions look like this:
“Show me conversions by campaign for today, updated hourly.”
“Which landing pages have the biggest drop in conversion this afternoon?”
“Compare paid signups by source for the last six hours.”
The point is not faster reporting. It is faster correction.
Product teams can see friction right after a release
Product work creates a steady stream of small bets. A new onboarding step, pricing page change, or feature launch may help. It may also subtly hurt activation.
Without fresh feedback, a team can spend days arguing from intuition. With real time analytics, they can watch new user behavior shortly after the release goes live. That shortens the gap between shipping and learning.
A simple analogy helps here. Batch reporting is like checking game footage the next day. Real time analytics is like seeing the scoreboard while the match is still on.
Practical prompts for product teams:
“Show activation rate for users who signed up today by onboarding version.”
“Where are new users dropping off in the signup funnel right now?”
“Compare feature usage this week before and after today’s release.”
For a founder, the "so what" is direct. Bad changes get caught sooner, and good changes get confirmed sooner.
Operations can stop small issues from turning into expensive ones
Operations is often where the return shows up fastest.
Late detection makes ordinary problems expensive. Failed payments pile up. Suspicious login activity spreads. Inventory errors create angry customer emails. Support queues stretch until response times slip.
Real time monitoring helps ops teams catch patterns while they are still containable. That matters in e-commerce, SaaS, and service businesses, not just banks or large enterprises. The same principle behind real-time agent assistance technology applies here. Guidance is more useful during the event than after the fact.
A few examples:
E-commerce ops: Spot unusual order bursts from the same device or payment pattern.
SaaS ops: Notice repeated failed logins, account lockouts, or suspicious API usage.
Support leaders: Watch ticket volume and response backlog so service quality stays under control.
Questions worth asking:
“Show failed payment attempts by hour for today.”
“List accounts with unusual login activity in the last day.”
“Track open support tickets by priority in real time.”
Leadership gets a live operating view, not a pile of reports
Founders rarely need ten more dashboards. They need a short list of answers tied to action.
Real time analytics helps leadership check four things quickly:
What changed today
Whether the change looks normal or unusual
Who should respond
How fast the issue is growing
That is the practical adoption path many non-technical teams miss. You do not need to begin with a huge streaming program or a custom data platform. You can start with a few high-value questions, connect the right events, and use conversational AI to ask for answers in plain English.
Try asking your analytics tool: “Show me today’s key funnel metrics compared with yesterday at the same time.”
If the answer arrives in time to change a decision, real time analytics is helping the business grow. If it arrives after the meeting, it is still reporting.
The Old Way vs The New Way of Getting Answers
Most BI frustration has nothing to do with data literacy. It comes from process.
A marketer asks a simple question. A PM writes a Slack message. A founder wants one chart before the board prep call. Then the request enters the ritual. Ticket. Queue. Clarification. SQL. Dashboard tweak. Follow-up question. Another queue.
That workflow used to be normal. It’s now just slow.
A useful comparison comes from support operations. If you’ve seen how real-time agent assistance technology gives reps live guidance during a conversation, the analogy fits. Analytics is going through a similar shift. Instead of waiting for after-the-fact interpretation, teams can get answers while the decision is still happening.
Getting data insights manual BI vs conversational AI
Step | The Old Way (Manual BI) | The New Way (Statspresso) |
|---|---|---|
Question starts | A stakeholder asks in plain English | A stakeholder asks in plain English |
Translation | Someone translates the question into SQL specs | The system interprets the question directly |
Queue | The request waits behind other work | The answer starts immediately |
Build | An analyst writes queries and shapes charts | A chart and explanation are generated from the connected data |
Follow-up | A new request restarts the process | The user asks a follow-up question in the same thread |
Output | Static dashboard or export | Interactive answer, chart, and dashboard-ready result |
Ownership | Insight depends on analyst bandwidth | Insight is self-serve for business teams |
What changes for a non-technical team
The big change isn’t only speed. It’s independence.
When business users can ask questions directly, the analyst’s role improves too. Analysts spend less time pulling one-off reports and more time improving definitions, modeling, governance, and high-value analysis.
That shift is healthier for everyone:
Founders stop waiting on basic KPI pulls
Growth teams test ideas faster
Product managers validate releases sooner
Analysts focus on harder work where they are needed
If every follow-up question requires a new ticket, the bottleneck isn’t curiosity. It’s the interface.
The real cost of the old way
The old model carries hidden costs:
Lost time: Answers arrive after decisions are forced.
Translation errors: The technical query doesn’t always match the business intent.
Dashboard sprawl: Teams create more static reports because asking new questions is painful.
Dependency drag: Simple insight requests compete with major analytics projects.
The new way doesn’t erase the need for data teams. It changes where they add value.
Try asking a conversational analytics tool: “Show me my revenue by month for the last year as a bar chart.”
That’s the benchmark. If a basic business question still turns into a two-week project, your analytics workflow is overdue for a redesign.
Common Hurdles and How to Leap Over Them
Real time data analytics can be messy to adopt. Anyone who tells you otherwise is either selling software or hasn’t had to clean event data on a Friday afternoon.
The biggest problems usually aren’t the flashy ones. They’re basic: bad inputs, too much architecture, and trying to go faster than the business needs.
A projected Gartner figure cited by DASCA says 68% of SMBs abandon real-time analytics projects due to costs and complexity, and only 22% reach full production scale (DASCA). That should make founders more practical, not more pessimistic.
Dirty data makes fast answers wrong
If your source data is inconsistent, real-time only helps you become confidently incorrect faster.
The usual culprits are familiar:
Broken event names: “checkout_start,” “checkout started,” and “begin_checkout” all mean the same thing until they don’t.
Missing context: Orders arrive, but campaign source or plan type is absent.
Duplicate records: The same event gets counted twice because ingestion retried.
Metric drift: Different teams define “active user” differently.
The fix isn’t glamorous. It’s discipline.
Start with one critical question and define it clearly. Pick a KPI that matters, such as activation, trial-to-paid conversion, or failed payments. Then standardize the source events and business logic behind it before adding more dashboards.
Reality check: Garbage in, garbage out still applies. Real-time systems just deliver the garbage faster.
Building from scratch gets expensive quickly
A custom stack sounds attractive when people list tools on a whiteboard. Kafka for ingestion. Flink for processing. A serving layer. Alerting. Storage. Observability. Access controls. Then someone has to maintain all of it.
That’s where projects stall. Not because the architecture is wrong, but because the ongoing operational burden is larger than expected.
If real-time analytics supports the business rather than defining the product, many teams should lean toward managed systems and simpler interfaces. You trade some flexibility for speed, focus, and a much lower chance of building a side business called “maintaining analytics plumbing.”
A practical adoption path looks like this:
Choose one use case tied to money, risk, or customer experience.
Connect a limited set of trusted sources instead of every tool under the sun.
Validate the metric definitions with business and data owners.
Expand after the first workflow proves useful.
You probably don’t need sub-second latency for everything
This is the part many teams miss.
Not every use case needs true streaming. Sometimes “fresh enough” wins. Daily retention reviews do not need instant event processing. A weekly board pack definitely doesn’t. Even many operating workflows work fine with short delays if they preserve simplicity and reduce cost.
The mistake is treating all analytics questions as if they belong to the same urgency class.
A simple mental model helps:
Question type | Speed needed | Example |
|---|---|---|
Strategic review | Historical | Quarterly growth trends |
Team management | Near real-time | Daily funnel checks |
Operational intervention | Real-time | Suspicious transactions or incident spikes |
This framing keeps you from overspending on speed where speed doesn’t help.
The practical way forward
If you’re a founder or PM, don’t start by asking for a real-time platform. Start by asking:
Which decisions suffer most from delayed data?
Which metrics are reliable enough to surface live?
Who needs to act when something changes?
What’s the cheapest path to getting that answer in front of them?
That gives you an adoption plan instead of a science project.
How Statspresso Accelerates Your Real-Time Journey
Many teams don’t need another dashboard builder. They need a shorter path from raw data to a trusted answer.
That’s where a Conversational AI Data Analyst is useful. Instead of forcing business users to learn SQL, model semantics, and chart settings before they can ask a question, the interface starts with the question itself.

Connect sources once, then ask in plain English
A practical setup usually starts with a few systems you already care about. Think Postgres for product data, Shopify for orders, HubSpot for leads, and maybe a support platform for ticket volume.
Once connected, the workflow gets simpler:
Ask a business question
Get a chart or answer
Refine with a follow-up
Pin useful results to a dashboard
Statspresso fits this model. It connects business data sources and lets users ask plain-English questions to get charts, numbers, and explanations without writing SQL. That makes it relevant for teams that want real time analytics access without building an engineering-heavy BI workflow.
Conversational analytics removes the translation tax
Traditional BI often breaks because the business question and the technical query drift apart.
A conversational layer helps by keeping the interaction closer to the original intent. Instead of writing a ticket that says, “Can someone pull funnel conversion by channel for the last two weeks and split by mobile versus desktop,” a user can just ask for it directly.
That matters for follow-up questions too.
A normal conversation might go like this:
“Show me signups by day for the last month.”
“Now split that by channel.”
“Filter to paid channels only.”
“Turn this into a bar chart.”
“Add it to my growth dashboard.”
That sequence feels closer to how teams think in meetings.
The best analytics interface is often the one that doesn’t make a smart person phrase a simple question like a database administrator.
Dashboards become a byproduct, not a project
This is an underrated shift.
When answers can be generated on demand, dashboards stop being giant upfront projects. They become a curated set of questions your team asks often. That’s healthier because the dashboard reflects actual operating needs instead of a once-a-quarter reporting brainstorm.
A few prompts worth trying:
“Show me my top landing pages by conversion rate this week.”
“Which campaigns drove the most qualified leads today?”
“Compare trial starts and paid conversions for the last 30 days.”
“List products with the biggest change in sales today versus yesterday.”
Try asking Statspresso: “What is my average customer lifetime value for users who signed up in the last 90 days?”
Why this approach works for non-technical leaders
Founders and PMs usually don’t want a deeper toolset. They want fewer steps.
Conversational analytics works because it removes three common frictions at once:
Technical friction: no need to write SQL for routine questions
Process friction: no need to wait in a reporting queue for every follow-up
Presentation friction: answers can become charts and dashboards quickly
That’s the practical win. You spend less time wrangling tooling and more time deciding what to do next.
Conclusion Your First Question Is Five Minutes Away
Real time data analytics used to sound like an engineering project. For many teams, it still can be. But the useful shift is simpler than that.
You have business questions that can’t wait for a weekly dashboard refresh. You have data spread across systems. And you need a way to turn that data into action before the moment passes.
That’s why this matters. Real-time analytics is not about collecting more charts. It’s about shortening the distance between signal and decision.
TL;DR
Real-time analytics helps teams act on fresh data instead of waiting for stale reports.
Batch, near real-time, and true streaming solve different problems. Don’t overbuild.
The core engine is straightforward in concept: events are produced, ingested, processed, and served.
Marketing, product, and operations all benefit when issues and opportunities surface while they still matter.
Conversational analytics gives non-technical teams a practical way to ask questions and get charts without SQL.
The smart adoption path starts with one valuable use case, clean data, and tools that reduce complexity.
Your first useful insight usually doesn’t require a giant transformation. It requires one connected source and one well-phrased question.
Connect your first data source in Statspresso and ask a plain-English question your team already needs answered today. Skip the SQL. Get a chart in seconds.