



August 7, 2026
How to Choose Your North Star Metric (and Actually Get Your Team to Use It)
A practical framework for picking your team's North Star Metric — with real examples across ecommerce, SaaS, marketing, sales, and ops — plus why most teams pick one and never look at it again.
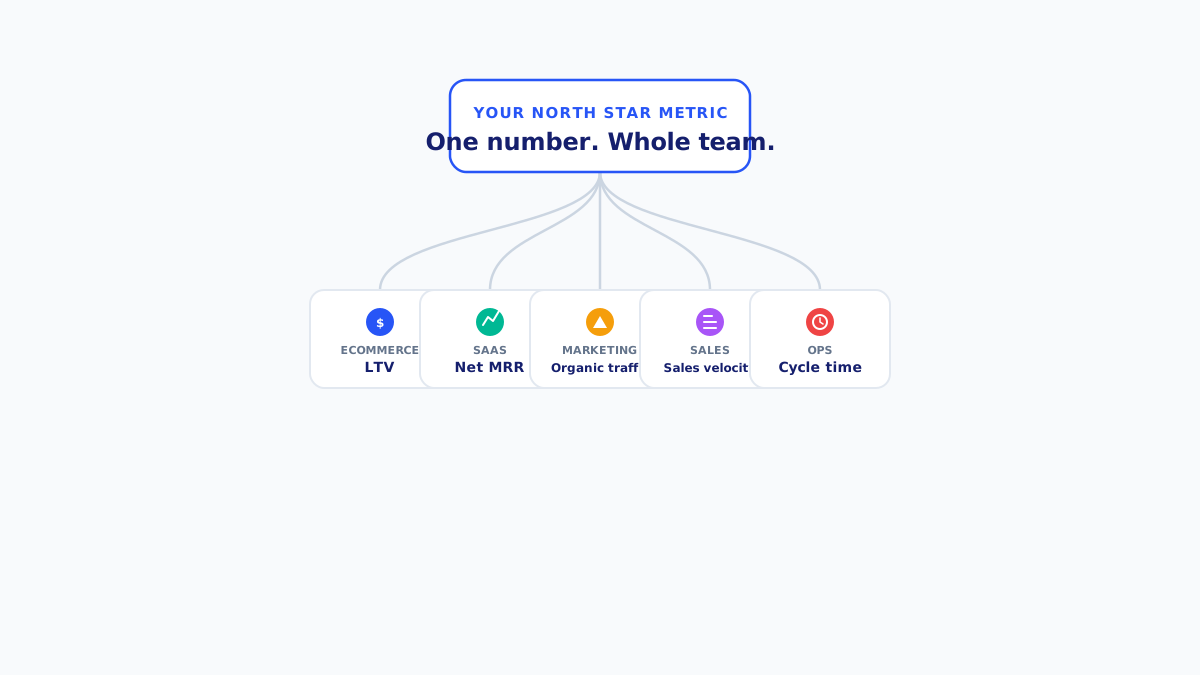
Every growth team eventually asks the same question: out of the fifty numbers on our dashboard, which one actually matters? That’s the North Star Metric question, and most teams get the answer wrong in one of two ways — they pick a number that’s easy to move but doesn’t mean anything, or they pick the right number and then never look at it again because it’s buried in a spreadsheet nobody opens.
This guide covers both problems: how to actually choose your North Star Metric, and what to do differently so it doesn’t quietly die a month later.
What a North Star Metric actually is
A North Star Metric is the single number that best captures the core value your product delivers to customers — and that, when it goes up, means your business is genuinely healthier, not just busier. It’s not a vanity metric (signups, page views, downloads) and it’s not a lagging financial number alone (revenue). It sits in between: close enough to the business outcome to matter, close enough to daily behavior that a team can actually influence it week to week.
Spotify didn’t pick “app installs.” They picked time spent listening — a number that only goes up if people are genuinely getting value, and one every team from playlists to podcasts could push on directly. Airbnb didn’t pick “signups.” They picked nights booked. The common thread: the metric describes value delivered, not activity generated.
Why most teams pick the wrong one
A few patterns show up constantly:
- Too many north stars. If marketing, product, and sales each have their own “north star,” you don’t have one — you have three teams optimizing against each other.
- A metric nobody can move. Total revenue is a fine thing to report to the board. It’s a terrible North Star Metric for a support team, because nothing they do on a given Tuesday visibly changes it.
- A metric that’s easy to game. Signups go up if you drop the price to zero. That doesn’t mean the business got healthier.
- Picking it once and never revisiting it. The right North Star Metric for a 10-person startup finding product-market fit is often wrong for the same company at 100 people optimizing retention.
A practical framework for choosing yours
Run every candidate metric through these four questions:
- Does it reflect real customer value, not just activity? If the number can go up while customers are actually getting less value, it’s the wrong metric.
- Can most of the team actually influence it? A metric only three people in the company can move isn’t a North Star — it’s a KPI for those three people.
- Does it lead revenue, not just report it? You want a number that moves before the revenue does, so you can act on it instead of just explaining it after the fact.
- Can you track it continuously, not just at quarter-end? A metric you can only calculate once a quarter can’t actually guide weekly decisions — which defeats the point of having one.
If a candidate metric fails more than one of these, keep looking.
Real examples, by business type
The right North Star Metric depends heavily on what you actually sell — a framework that says “just track engagement” isn’t useful. Here’s what it tends to look like by category:
- Ecommerce — Customer Lifetime Value, or a fast-moving proxy like repeat purchase rate. Revenue alone doesn’t tell you if you’re building a business or just running ads harder.
- SaaS & subscriptions — Net MRR growth (new + expansion − churn − contraction). This is the one number that captures whether the business is actually compounding.
- Marketing — Non-brand organic traffic, or qualified pipeline sourced from content. Total traffic is vanity; traffic that didn’t require paying for the click is signal.
- Sales & CRM — Sales velocity (deals × win rate × deal size ÷ sales cycle length). It’s the one number that captures whether the whole pipeline is getting healthier, not just whether one rep had a good month.
- Project & ops teams — Cycle time. It’s the clearest signal of whether a team is actually shipping faster or just busier.
These map closely to how we think about warehouses inside Statspresso itself — every Industry Blueprint is really just a Northstar metric plus the handful of supporting numbers that explain it, which is why the concept ends up at the center of the canvas rather than buried in a settings page. (If you’re specifically running B2B SaaS, we went deeper on eight SaaS-specific candidates in 8 B2B SaaS North Star Metrics to Track in 2026.)
The part everyone skips: keeping it in front of the team
Picking the metric is the easy part. The reason North Star Metrics quietly die is almost never “we picked the wrong one” — it’s that it lived in a slide from a Q1 planning meeting and nobody saw it again until Q3.
A few things that actually work:
- Put it somewhere people already look, not a dashboard that requires a login nobody remembers. If checking your North Star Metric takes more than one click, it will stop getting checked within a month.
- Let people ask follow-up questions against it, not just view it. “MRR is up 4%” is a fact. “Why is MRR up 4%, and is it durable?” is the question that actually changes what the team does next week — and that only happens if someone can dig into the number without filing a ticket with an analyst.
- Revisit it deliberately, not by accident. The right cadence is usually quarterly — often enough to catch it going stale, rare enough that the team can actually build habits around it.
This is the whole idea behind building your canvas around a Northstar node in Statspresso: the metric sits at the center, every question your team asks brews as a new connected node right off of it, and nobody has to remember to go check a dashboard — the canvas is just always there, current, with the one number that matters at the top.
Frequently asked questions
Can a company have more than one North Star Metric? Not really, at the company level — that defeats the purpose of alignment. Individual teams can have their own supporting metrics underneath it, but there should be one number the whole company agrees is the scoreboard.
How often should we change our North Star Metric? Rarely, and deliberately. Changing it too often signals the team never actually committed to it. A real trigger — a new stage of growth, a business model change — is a good reason. Boredom with the current number isn’t.
Is revenue ever the right North Star Metric? Usually not directly, because it’s a lagging indicator almost nobody below the leadership team can move day to day. It’s a better instinct to find the leading metric that reliably predicts revenue, and make that the North Star instead.
Related calculators
This post touches on these metrics — calculate yours: