How to Visualize Data (2026 Guide)

You already have the data. It’s sitting in Shopify, HubSpot, Stripe, Postgres, or five CSV exports with names like final_v2_REALLYFINAL.csv. The bottleneck isn’t access. It’s turning that mess into an answer before the meeting starts. Waiting weeks for an analyst report is a relic. How to visualize data starts with asking a sharp question, then getting to a chart fast enough to act on it. That’s why teams use a Conversational AI Data Analyst: skip the SQL, ask plain English questions, get charts in seconds.
Your Data Has Answers, If You Know How to Ask
Most bad charts start too late.
Someone opens a BI tool, clicks around, picks a chart type, and hopes meaning appears. It doesn’t. You get a colorful artifact. Not an answer.
Good visualization begins earlier. It starts with a business question someone can act on today. Not “show me the dashboard.” More like “which acquisition channel is bringing customers who stick?” That question gives the chart a job.
Start with the Question, Not the Data
A founder asks, “How’s marketing doing?” That sounds reasonable. It’s also useless.
No chart can answer that cleanly because the question hides too many decisions. Are you asking about spend efficiency, pipeline quality, retention, conversion lag, or payback? If you don’t pin that down, the visual will drift into decoration.

Ask a decision question
A good question has three parts:
Business decision you need to make
Metric that reflects that decision
Slice or timeframe that narrows the scope
So instead of “How’s marketing doing?”, ask:
Budget question: Which channel is driving the lowest cost per qualified lead this quarter?
Retention question: Which onboarding path leads to the highest activation by cohort?
Product question: Which feature adoption pattern shows up before expansion revenue?
Sales question: Which deal source has the shortest time to close?
Those questions produce cleaner visuals because they tell you what comparison matters.
Practical rule: If the answer won’t change a decision, the chart doesn’t need to exist.
This holds greater importance than is often realized. An audience-centered design process is not academic busywork. Research summarized by Logic20/20 notes that dashboards can fail at rates of up to 80% due to poor user alignment, and that 40% of ineffective visuals miss the actual business value when the audience isn’t profiled first (Logic20/20 on why bad data visualizations are ineffective).
That tracks with what happens in real companies. The marketing lead wants campaign clarity. The founder wants speed to revenue. The product manager wants drop-off by flow. One dashboard tries to please everyone and ends up helping no one.
Define the audience before the chart
Different people need different levels of detail.
A founder usually needs the pattern and the implication. A growth manager often needs channel breakdowns. An analyst may need the exact filters, joins, and definitions. If you build one visual without deciding who it’s for, you either oversimplify or overload it.
Use this quick lens:
Executive audience: Show trend, change, and business implication.
Operator audience: Show segment, outlier, and next action.
Analyst audience: Show assumptions, grain, and methodology.
That’s how to visualize data without building a dashboard graveyard.
Compare the old workflow with the useful one
Approach | What happens |
|---|---|
Start with the data | You browse tables, spot random metrics, and reverse-engineer a story after the fact |
Start with the question | You know what to compare, which metric matters, and what chart format fits the decision |
The old way feels productive because it involves clicking. It usually ends with a chart nobody trusts.
The better way is blunt. Write the question as if you had to say it out loud in a meeting. If it sounds vague, it is.
Use prompts that force specificity
If you’re using conversational analytics, vague prompts create vague outputs. Better prompts create cleaner charts fast.
Try prompts like:
“Show qualified leads by acquisition channel for this quarter.”
“Compare conversion from signup to paid by weekly cohort.”
“Which product features are most common among retained accounts?”
That’s the fast-track. Start with the decision. Then let the data answer it.
Wrangle Your Data Without Writing Code
Teams often don’t struggle with charts first. They struggle with the swamp that comes before charts.
The data is split across tools. Naming is inconsistent. Dates don’t line up. Revenue sits in one system, campaign source in another, product activity somewhere else. By the time someone has cleaned, joined, and sanity-checked everything, the question has gone stale.
That’s why so many teams stay stuck in spreadsheet purgatory.
What data wrangling actually means
You don’t need to become a SQL person to understand the basics. You just need to know what “ready for charting” looks like.
Usually, it means the data has to be:
Cleaned so dates, categories, and labels are consistent
Joined so customer, campaign, or product records connect correctly
Structured so each row represents something meaningful
Filtered so the chart answers one question instead of twelve
If that sounds tedious, that’s because it is.
The upside is simple. The brain processes visual information 60,000 times faster than text, and 72% of businesses using visualization tools report faster access to insights according to Embryo’s summary of data visualization effectiveness statistics (Embryo on data visualization effectiveness stats). The chart is the payoff. The prep work is what usually blocks it.
The path to a chart
Step | The Old Way (Manual BI) | The New Way (Statspresso) |
|---|---|---|
Connect data | Export CSVs from Shopify, HubSpot, and your database | Connect sources once |
Prepare data | Write SQL, create joins, patch fields in spreadsheets | Ask a question in plain English and let the system translate it into a query |
Define metrics | Debate what “active customer” means in Slack threads | Reuse trusted definitions in a shared workspace |
Build chart | Click through chart settings after cleaning data manually | Get a generated chart from the prompt |
Refine answer | Start over when someone changes the question | Ask a follow-up question and iterate quickly |
Share result | Paste screenshots into slides | Save and share the output as a live asset |
In this scenario, Statspresso, a Conversational AI Data Analyst, fits naturally. It lets teams connect data sources, ask plain-English questions, and get charts and explanations without writing SQL. That matters if you care more about deciding than babysitting joins.
Don’t confuse data prep with analysis
A lot of teams spend hours proving they can move columns around and call that analytics.
It isn’t.
Analysis starts when the data is coherent enough to answer a business question. If all your time goes into cleaning exports and fixing field names, you’re not doing analysis. You’re doing janitorial work with a chart waiting at the end.
The fastest chart is the one you never had to rebuild from three exports and a hunch.
Prompts that reduce wrangling pain
If your tool supports natural-language querying, use prompts that reflect business logic instead of table logic.
Try asking:
“Show me revenue by month for the last year as a bar chart.”
“Compare trial-to-paid conversion by signup source.”
“Plot churned customers by plan type over time.”
“Which campaigns brought the highest-value customers?”
Those prompts do something important. They start from the answer you need, not the schema you inherited.
A few sanity checks before you chart
Even with automated BI or conversational analytics, check the basics:
Date grain: Are you comparing days, weeks, or months?
Metric definition: Does “revenue” mean booked, collected, or recognized?
Entity level: Is each row an order, a customer, or an account?
Time filter: Are you mixing partial periods with complete ones?
These checks don’t require technical expertise. They require suspicion. Healthy suspicion saves more charts than fancy tooling.
If you want to learn how to visualize data well, learn this early: the chart is only as honest as the table underneath it.
Choose the Right Chart and Avoid Visual Traps
A chart type is not a style choice. It’s a claim about how people should read the data.
Pick the wrong one and you add friction. Pick a misleading one and you distort the message. A chart shouldn’t make your audience work harder than the analysis itself.
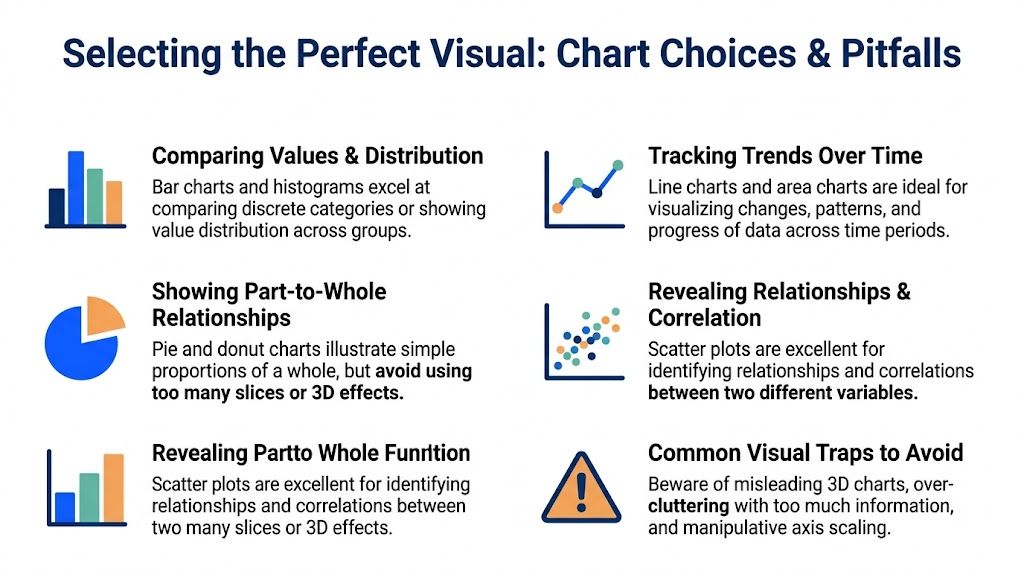
Match the chart to the question
Use this simple rule set.
Compare values
Use a bar chart when you want to compare categories.
Examples:
Revenue by channel
Pipeline by rep
Tickets by issue type
Bars work because people compare lengths well. They don’t need visual gymnastics.
Show change over time
Use a line chart for trends across time.
Examples:
Signups by week
Churn by month
Support volume over time
Line charts show direction, slope, and interruptions well. They’re ideal when sequence matters.
Show composition
Use a stacked bar if you need part-to-whole inside categories.
Examples:
Revenue by month split by plan
Traffic by source split by device
Teams often reach for pie charts. They shouldn’t, at least not by default.
Show relationships
Use a scatter plot when the question is about association.
Examples:
Ad spend versus pipeline
Session count versus retention
Discount level versus conversion
Scatter plots are underrated because they look less “executive,” but they’re often the first chart that reveals something real.
Stop using pie charts as a reflex
Pie charts survive because presentation software keeps offering them.
That doesn’t make them good.
A scientific review summarized in the verified data notes that pie charts are the most erroneous format in scientific visualization, with a 45% error rate, and that for magnitude comparison tasks, bar charts achieve 95% accuracy. The same source says to reject pie charts for more than 5 categories (PMC review on graphical integrity pitfalls).
That’s the practical takeaway:
Use bars when people need to compare values precisely
Use pie or donut charts sparingly, and only for very simple part-to-whole views
Never use a pie chart with a confetti explosion of slices
Your audience is trying to answer a question, not estimate angles under pressure.
If someone has to squint at slices to tell what’s bigger, you picked the wrong chart.
Ban 3D charts from your workflow
A 3D chart takes a readable graph and turns it into furniture.
The same scientific review reports that 3D charts introduce a 25-40% perceptual bias. That’s not a style quibble. That’s distortion.
Common 3D damage includes:
Hidden values because one bar blocks another
False emphasis from perspective
Harder comparisons because depth isn’t data
If the chart would lose meaning when flattened into 2D, the design is doing too much.
Watch your axes and clutter
A chart can lie without saying a false word.
Bad scale choices do that all the time. Truncated baselines can inflate differences. Overloaded line charts turn into spaghetti. Excess labels and colors create noise that competes with the pattern.
Use these habits instead:
Keep baselines honest when comparing magnitudes
Split crowded series into small multiples when one chart gets messy
Limit categories so the eye can track them
Label directly when possible instead of making people bounce between chart and legend
For product teams, I like Aakash Gupta’s OKPS Product Visualization framework because it pushes people to tie visuals to product questions, not vanity charts. That’s the right instinct. Start with the operating question. Then pick the visual that makes the answer obvious.
A fast chart chooser
Use this when you’re in a hurry:
If you need to show | Use | Avoid |
|---|---|---|
Ranking across categories | Bar chart | Pie chart |
Trend over time | Line chart | Table dump |
Mix within categories | Stacked bar | 3D stacked anything |
Correlation | Scatter plot | Two unrelated y-axes unless absolutely necessary |
Good chart selection feels boring. That’s a compliment. It means the data is doing the talking.
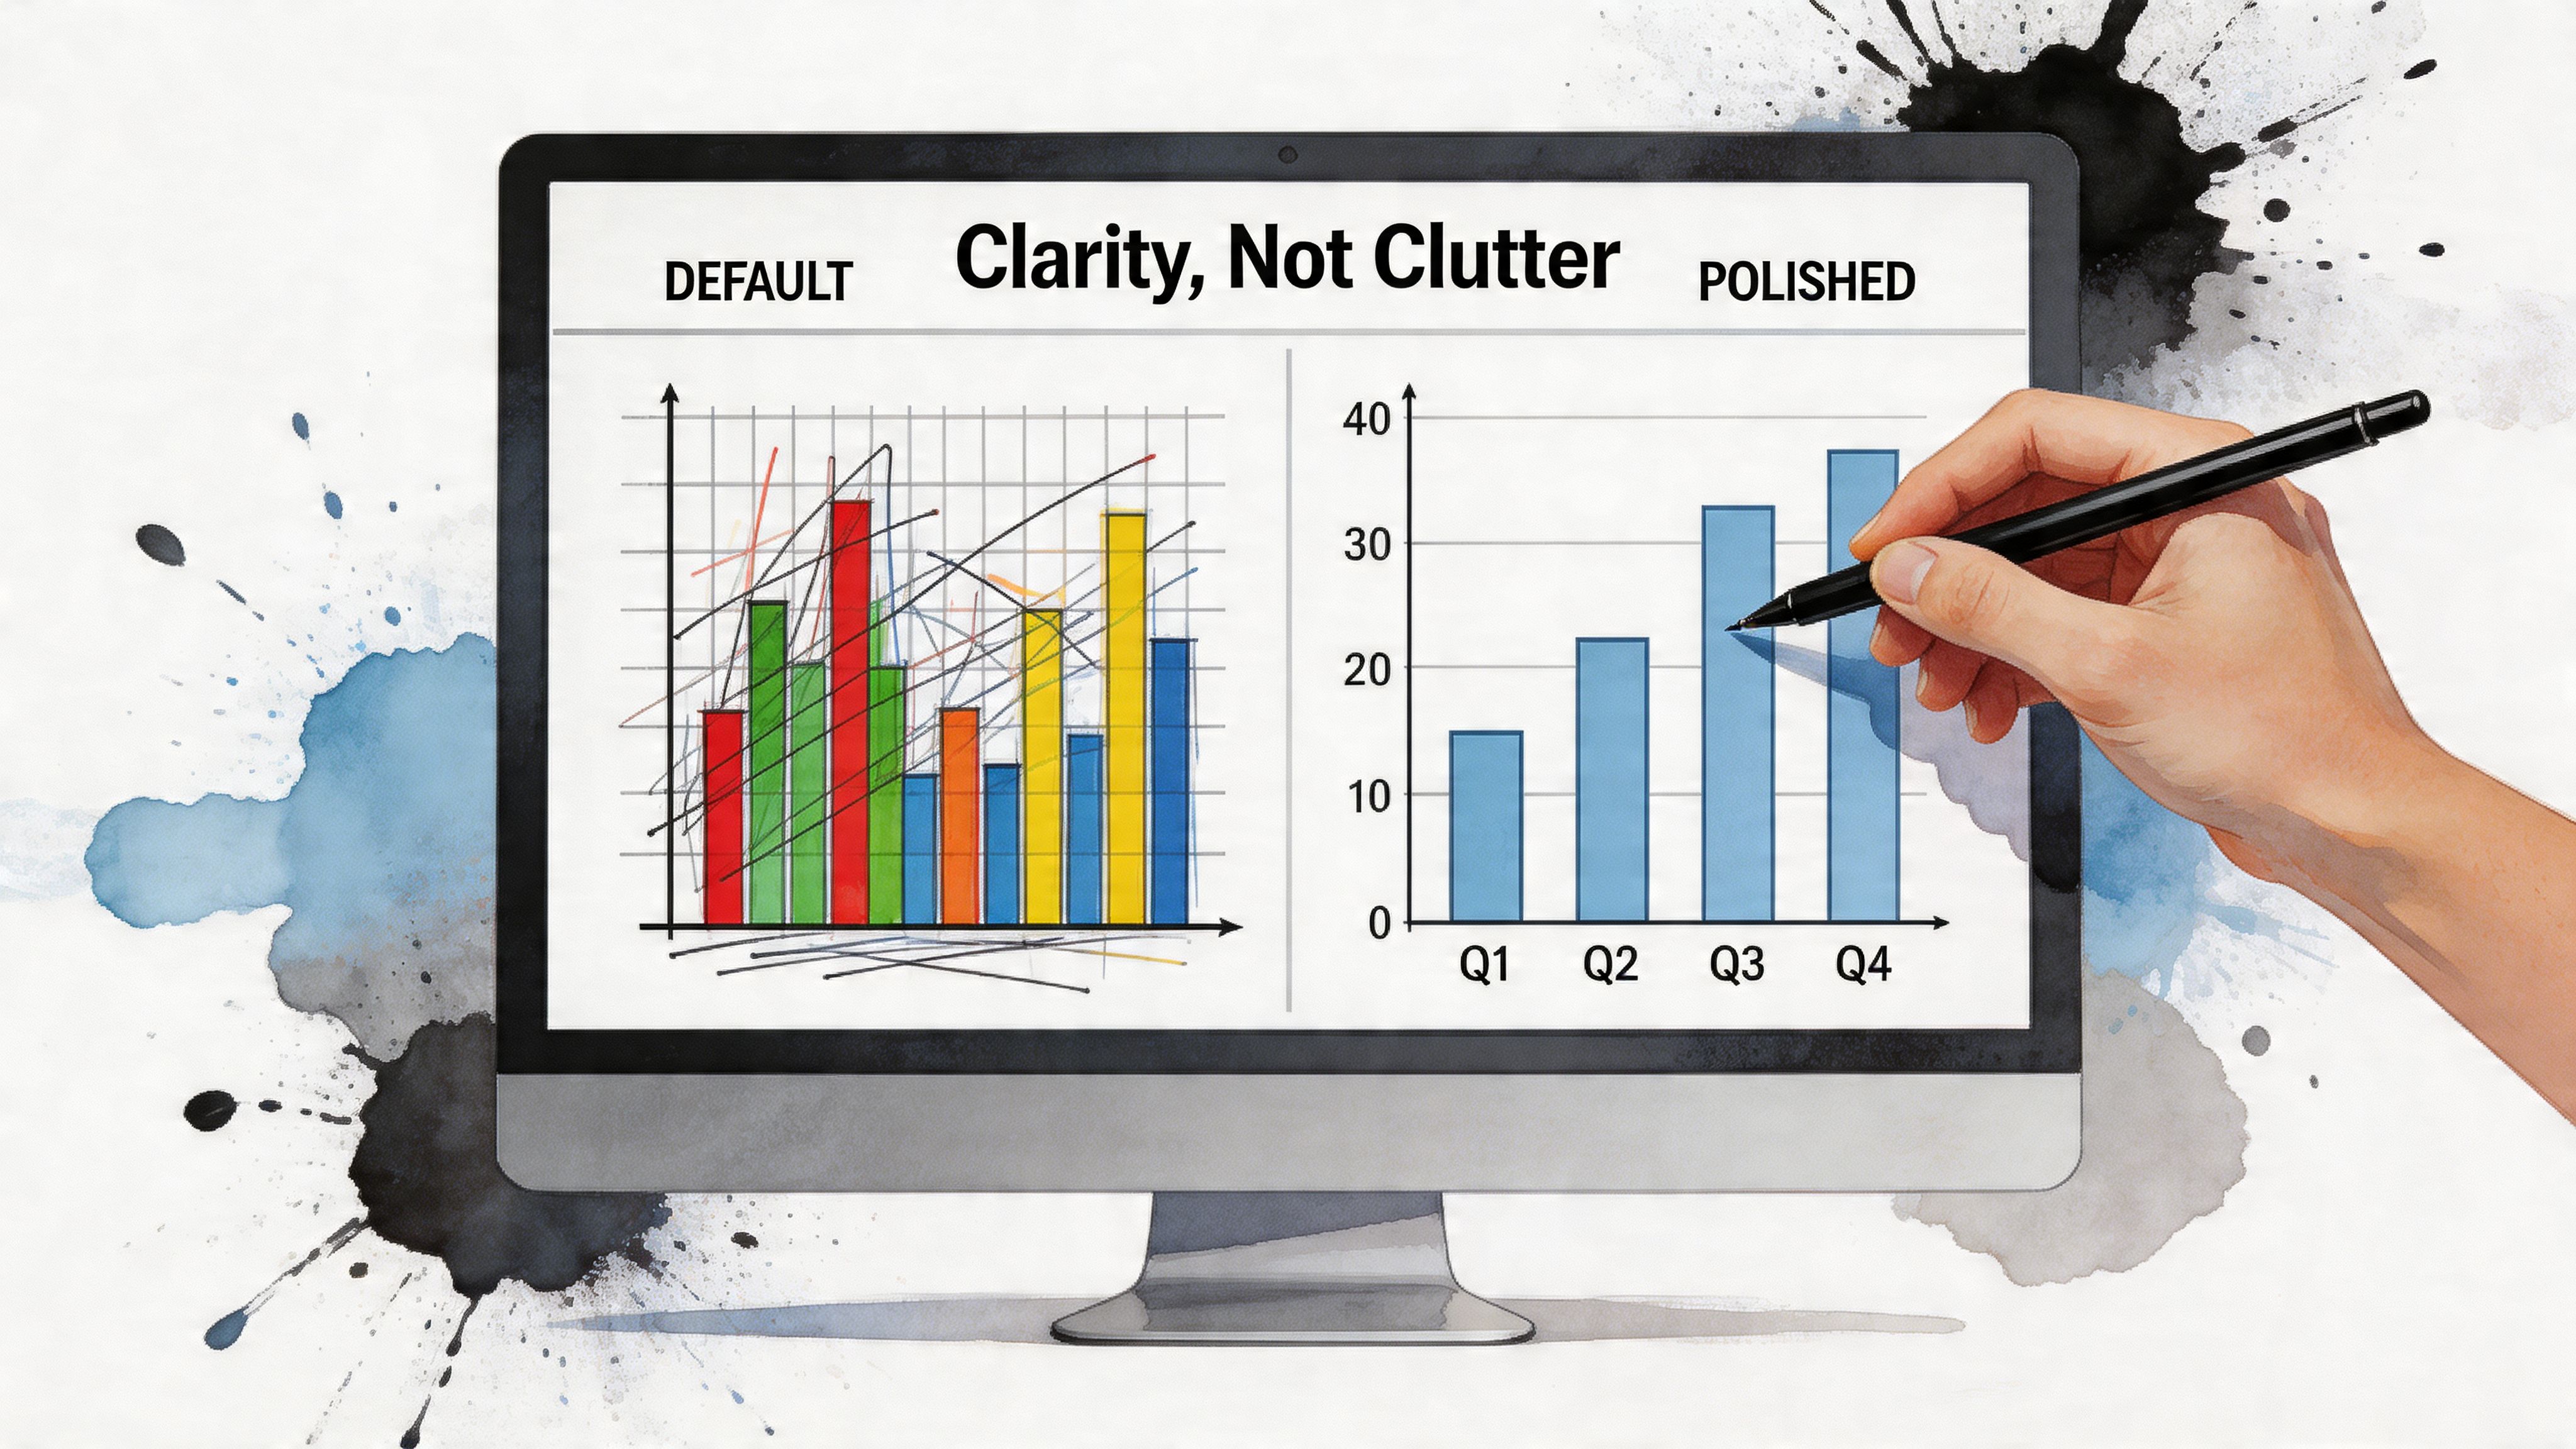
Design Principles for Clarity, Not Clutter
Default charts aren’t neutral. They often come loaded with heavy gridlines, random colors, tiny labels, and all the personality of airport carpeting.
A clean chart doesn’t need to be artistic. It needs to remove excuses for misunderstanding.
Use color like a tool
Color should signal meaning, not prove that your software has a palette.
Use one highlight color for the thing you want people to notice. Keep the rest muted. If every bar is loud, none of them are.
A few practical habits:
Highlight one story point such as the current quarter or target segment
Use consistent color meaning across charts so blue doesn’t mean revenue on one slide and churn on the next
Avoid rainbow palettes unless confusion is your actual objective
Accessibility matters too. Some colleagues won’t distinguish colors the way you do. Direct labels and stronger contrast help far more than clever aesthetics.
Write titles that answer the question
A title like “Monthly Revenue” is lazy. It names the metric, not the insight.
A better title says what matters:
Revenue grew after pricing changed
Paid search leads convert slower than referrals
Activation is strongest in accounts that use feature X
That doesn’t mean every title must be a conclusion. It means the chart should tell the reader why they’re looking at it.
A chart title should save people from asking, “What am I supposed to notice?”
If you want a solid companion read on this, Statspresso’s guide to data visualization best practices covers many of the habits that make charts easier to trust and easier to scan.
Remove junk that steals attention
The usual culprits:
Excess gridlines
Borders around every element
Legends that could have been direct labels
Decimal precision nobody needs
Decorative icons, gradients, and shadows
Most charts improve when you delete things.
That’s especially true in executive settings. If the visual takes too long to parse, people stop looking and start asking for the spreadsheet. You’ve lost.
Design with fairness in mind
Clear charts can still be unfair charts.
Equity-aware visualization matters because design choices can distort who appears to need attention. Standard tools often won’t warn you when a map or aggregation choice creates bias. One practical example: using choropleth maps without normalizing by population can misrepresent the scale of an issue in densely populated areas, which can affect resource allocation decisions (Tableau discussion on equity-aware data visualization).
For founders and operators, that matters beyond public policy. If you’re mapping support burden, user complaints, or service gaps, absolute counts alone can mislead you. A region with more users will almost always look “worse” unless you account for the denominator.
Design isn’t cosmetic. It’s operational judgment made visible.
Turn Your Chart into an Actionable Insight
A chart by itself is often just evidence waiting for an argument.
If you want someone to act on it, you need to add context, friction-reducing cues, and an honest account of what the data can’t say.

Annotate what matters
Don’t make people guess why a spike happened.
Add a short note for major events:
Pricing changed
New channel launched
Tracking issue fixed
Campaign paused
Product release shipped
That tiny bit of annotation turns a chart from “interesting shape” into “useful explanation.”
Good annotations are brief. They clarify, not crowd.
Add interactivity where it helps
Filters, tooltips, and drill-downs are useful when they reduce back-and-forth.
Examples:
A marketing lead filters by campaign
A PM drills into a cohort
A founder hovers to compare exact values without cluttering the chart
Interactive charts can simplify complex data for non-experts. They also make stakeholder conversations less binary. People can explore instead of asking for a new deck every time a follow-up question appears.
Still, interactivity is not a substitute for a clear default view. The first screen should tell the main story even before anyone clicks.
Show missing data honestly
This is one of the most ignored parts of how to visualize data.
Real business datasets are messy. Missing values are common. The verified data notes that missing data can affect 30-50% of real-world datasets, and that one honest technique is to avoid connecting dots in a line chart across a period where data is absent so the gap is visible (This is Important on visualizing missing data).
That sounds small. It isn’t.
When you connect across missing periods, you imply continuity. You suggest the underlying thing was measured and behaved smoothly. Sometimes it wasn’t measured at all.
Use these habits instead:
Leave visual gaps in line charts where data is absent
Label sample size when categories are inconsistent
Add a note if tracking changed
Separate missingness from zero because those are not the same thing
Missing data is not a formatting issue. It’s part of the story.
Make the insight durable
If the insight matters, don’t leave it stranded in a screenshot.
Store the prompt, the chart, the metric definition, and the takeaway together. That’s where documentation habits start to matter. Teams that care about reuse should borrow from broader knowledge management best practices so insights don’t disappear into Slack threads and meeting decks.
Try a repeatable pattern:
State the business question
Show the chart
Write the takeaway in one sentence
Note caveats or missing data
Save it where the team can find it again
Try asking your AI analytics tool:
“Show monthly active users over time, and leave gaps where data is missing.”
“Compare conversion by cohort and annotate the pricing launch.”
“Find outliers in support volume and explain possible causes.”
That’s how a chart becomes usable, not just visible.
How to Share Insights That Get Used
A chart that lives in a deck and dies in a meeting isn’t analysis. It’s performance.
Useful insights need a second life. They should be easy to revisit, easy to verify, and easy to share without someone asking, “Wait, which version is this?”
Save the question, not just the picture
Static exports still have their place. PDFs are fine. PNGs are fine. But if that’s all you keep, you lose the logic that produced the visual.
What matters is the reusable asset behind the chart:
the business question
the filters
the metric definition
the chart format
the written takeaway
If someone can’t recreate the chart without asking you what you meant, it’s not really shared.
Build a small library of trusted views
Organizations often don’t need more dashboards. They need fewer, more dependable ones.
A better approach is to save recurring questions as reusable views:
weekly revenue trend
pipeline by source
activation by cohort
churn by plan
campaign performance snapshot
That creates a living library of metrics people recognize. It also cuts down on “Can you pull this again?” requests because the answer already exists in a repeatable form.
Make charts stand on their own
A shared chart should survive outside the room where it was explained.
That means it needs:
A clear title
Labels people can read
Enough context to avoid misinterpretation
A short note on what changed, if relevant
If someone pastes the chart into Slack or a doc, the meaning should travel with it.
Prefer live assets over manual rework
Manual reporting creates subtle chaos. Someone exports a CSV on Monday, someone else updates a slide on Wednesday, and by Friday nobody knows whether the number is stale or changed.
Live, shareable dashboards and saved queries reduce that mess. They also support collaboration better because people can inspect the same underlying question instead of debating screenshots.
Conversational analytics offers more than a gimmick. If your team can ask follow-up questions directly against the same connected data, you stop rebuilding analysis from scratch each week.
A simple sharing standard
Use this standard for every chart worth keeping:
Element | What to include |
|---|---|
Question | What business question this chart answers |
Definition | What the main metric means |
Scope | Timeframe, filters, and segments |
Takeaway | One sentence on what the chart suggests |
Location | Where the team can find the latest version |
That’s how you shift from one-off analysis to a working data habit.
From Data to Decision in Minutes
Data consumers don’t need a seminar on analytics. They need a faster path from raw data to a decision they can defend.
Here’s the short version.
Start with the question: Ask something specific enough to change a decision.
Get the data into shape: Clean, join, and structure it so the chart answers one thing well.
Choose the right visual: Bars for comparison, lines for time, scatter for relationships.
Design for clarity: Use color sparingly, title the insight, remove junk.
Tell the truth: Show missing data transparently and avoid misleading scales.
Share the asset: Save the question, chart, and takeaway so people can reuse it.
If you’re learning how to visualize data, don’t overcomplicate it. The goal isn’t to make impressive charts. The goal is to make better decisions faster, with less guesswork and less waiting around for someone to build a dashboard.
Stop waiting for reports. Connect your first data source for free and ask your first question in the next five minutes. Go from data chaos to clarity, fast.
Connect your data to Statspresso, ask a plain-English question, and get your first chart in minutes. If you’re tired of dashboard sprawl, SQL bottlenecks, and answers that arrive after the decision window closes, start with one real question and let the data answer it.
You already have the data. It’s sitting in Shopify, HubSpot, Stripe, Postgres, or five CSV exports with names like final_v2_REALLYFINAL.csv. The bottleneck isn’t access. It’s turning that mess into an answer before the meeting starts. Waiting weeks for an analyst report is a relic. How to visualize data starts with asking a sharp question, then getting to a chart fast enough to act on it. That’s why teams use a Conversational AI Data Analyst: skip the SQL, ask plain English questions, get charts in seconds.
Your Data Has Answers, If You Know How to Ask
Most bad charts start too late.
Someone opens a BI tool, clicks around, picks a chart type, and hopes meaning appears. It doesn’t. You get a colorful artifact. Not an answer.
Good visualization begins earlier. It starts with a business question someone can act on today. Not “show me the dashboard.” More like “which acquisition channel is bringing customers who stick?” That question gives the chart a job.
Start with the Question, Not the Data
A founder asks, “How’s marketing doing?” That sounds reasonable. It’s also useless.
No chart can answer that cleanly because the question hides too many decisions. Are you asking about spend efficiency, pipeline quality, retention, conversion lag, or payback? If you don’t pin that down, the visual will drift into decoration.
Ask a decision question
A good question has three parts:
Business decision you need to make
Metric that reflects that decision
Slice or timeframe that narrows the scope
So instead of “How’s marketing doing?”, ask:
Budget question: Which channel is driving the lowest cost per qualified lead this quarter?
Retention question: Which onboarding path leads to the highest activation by cohort?
Product question: Which feature adoption pattern shows up before expansion revenue?
Sales question: Which deal source has the shortest time to close?
Those questions produce cleaner visuals because they tell you what comparison matters.
Practical rule: If the answer won’t change a decision, the chart doesn’t need to exist.
This holds greater importance than is often realized. An audience-centered design process is not academic busywork. Research summarized by Logic20/20 notes that dashboards can fail at rates of up to 80% due to poor user alignment, and that 40% of ineffective visuals miss the actual business value when the audience isn’t profiled first (Logic20/20 on why bad data visualizations are ineffective).
That tracks with what happens in real companies. The marketing lead wants campaign clarity. The founder wants speed to revenue. The product manager wants drop-off by flow. One dashboard tries to please everyone and ends up helping no one.
Define the audience before the chart
Different people need different levels of detail.
A founder usually needs the pattern and the implication. A growth manager often needs channel breakdowns. An analyst may need the exact filters, joins, and definitions. If you build one visual without deciding who it’s for, you either oversimplify or overload it.
Use this quick lens:
Executive audience: Show trend, change, and business implication.
Operator audience: Show segment, outlier, and next action.
Analyst audience: Show assumptions, grain, and methodology.
That’s how to visualize data without building a dashboard graveyard.
Compare the old workflow with the useful one
Approach | What happens |
|---|---|
Start with the data | You browse tables, spot random metrics, and reverse-engineer a story after the fact |
Start with the question | You know what to compare, which metric matters, and what chart format fits the decision |
The old way feels productive because it involves clicking. It usually ends with a chart nobody trusts.
The better way is blunt. Write the question as if you had to say it out loud in a meeting. If it sounds vague, it is.
Use prompts that force specificity
If you’re using conversational analytics, vague prompts create vague outputs. Better prompts create cleaner charts fast.
Try prompts like:
“Show qualified leads by acquisition channel for this quarter.”
“Compare conversion from signup to paid by weekly cohort.”
“Which product features are most common among retained accounts?”
That’s the fast-track. Start with the decision. Then let the data answer it.
Wrangle Your Data Without Writing Code
Teams often don’t struggle with charts first. They struggle with the swamp that comes before charts.
The data is split across tools. Naming is inconsistent. Dates don’t line up. Revenue sits in one system, campaign source in another, product activity somewhere else. By the time someone has cleaned, joined, and sanity-checked everything, the question has gone stale.
That’s why so many teams stay stuck in spreadsheet purgatory.
What data wrangling actually means
You don’t need to become a SQL person to understand the basics. You just need to know what “ready for charting” looks like.
Usually, it means the data has to be:
Cleaned so dates, categories, and labels are consistent
Joined so customer, campaign, or product records connect correctly
Structured so each row represents something meaningful
Filtered so the chart answers one question instead of twelve
If that sounds tedious, that’s because it is.
The upside is simple. The brain processes visual information 60,000 times faster than text, and 72% of businesses using visualization tools report faster access to insights according to Embryo’s summary of data visualization effectiveness statistics (Embryo on data visualization effectiveness stats). The chart is the payoff. The prep work is what usually blocks it.
The path to a chart
Step | The Old Way (Manual BI) | The New Way (Statspresso) |
|---|---|---|
Connect data | Export CSVs from Shopify, HubSpot, and your database | Connect sources once |
Prepare data | Write SQL, create joins, patch fields in spreadsheets | Ask a question in plain English and let the system translate it into a query |
Define metrics | Debate what “active customer” means in Slack threads | Reuse trusted definitions in a shared workspace |
Build chart | Click through chart settings after cleaning data manually | Get a generated chart from the prompt |
Refine answer | Start over when someone changes the question | Ask a follow-up question and iterate quickly |
Share result | Paste screenshots into slides | Save and share the output as a live asset |
In this scenario, Statspresso, a Conversational AI Data Analyst, fits naturally. It lets teams connect data sources, ask plain-English questions, and get charts and explanations without writing SQL. That matters if you care more about deciding than babysitting joins.
Don’t confuse data prep with analysis
A lot of teams spend hours proving they can move columns around and call that analytics.
It isn’t.
Analysis starts when the data is coherent enough to answer a business question. If all your time goes into cleaning exports and fixing field names, you’re not doing analysis. You’re doing janitorial work with a chart waiting at the end.
The fastest chart is the one you never had to rebuild from three exports and a hunch.
Prompts that reduce wrangling pain
If your tool supports natural-language querying, use prompts that reflect business logic instead of table logic.
Try asking:
“Show me revenue by month for the last year as a bar chart.”
“Compare trial-to-paid conversion by signup source.”
“Plot churned customers by plan type over time.”
“Which campaigns brought the highest-value customers?”
Those prompts do something important. They start from the answer you need, not the schema you inherited.
A few sanity checks before you chart
Even with automated BI or conversational analytics, check the basics:
Date grain: Are you comparing days, weeks, or months?
Metric definition: Does “revenue” mean booked, collected, or recognized?
Entity level: Is each row an order, a customer, or an account?
Time filter: Are you mixing partial periods with complete ones?
These checks don’t require technical expertise. They require suspicion. Healthy suspicion saves more charts than fancy tooling.
If you want to learn how to visualize data well, learn this early: the chart is only as honest as the table underneath it.
Choose the Right Chart and Avoid Visual Traps
A chart type is not a style choice. It’s a claim about how people should read the data.
Pick the wrong one and you add friction. Pick a misleading one and you distort the message. A chart shouldn’t make your audience work harder than the analysis itself.
Match the chart to the question
Use this simple rule set.
Compare values
Use a bar chart when you want to compare categories.
Examples:
Revenue by channel
Pipeline by rep
Tickets by issue type
Bars work because people compare lengths well. They don’t need visual gymnastics.
Show change over time
Use a line chart for trends across time.
Examples:
Signups by week
Churn by month
Support volume over time
Line charts show direction, slope, and interruptions well. They’re ideal when sequence matters.
Show composition
Use a stacked bar if you need part-to-whole inside categories.
Examples:
Revenue by month split by plan
Traffic by source split by device
Teams often reach for pie charts. They shouldn’t, at least not by default.
Show relationships
Use a scatter plot when the question is about association.
Examples:
Ad spend versus pipeline
Session count versus retention
Discount level versus conversion
Scatter plots are underrated because they look less “executive,” but they’re often the first chart that reveals something real.
Stop using pie charts as a reflex
Pie charts survive because presentation software keeps offering them.
That doesn’t make them good.
A scientific review summarized in the verified data notes that pie charts are the most erroneous format in scientific visualization, with a 45% error rate, and that for magnitude comparison tasks, bar charts achieve 95% accuracy. The same source says to reject pie charts for more than 5 categories (PMC review on graphical integrity pitfalls).
That’s the practical takeaway:
Use bars when people need to compare values precisely
Use pie or donut charts sparingly, and only for very simple part-to-whole views
Never use a pie chart with a confetti explosion of slices
Your audience is trying to answer a question, not estimate angles under pressure.
If someone has to squint at slices to tell what’s bigger, you picked the wrong chart.
Ban 3D charts from your workflow
A 3D chart takes a readable graph and turns it into furniture.
The same scientific review reports that 3D charts introduce a 25-40% perceptual bias. That’s not a style quibble. That’s distortion.
Common 3D damage includes:
Hidden values because one bar blocks another
False emphasis from perspective
Harder comparisons because depth isn’t data
If the chart would lose meaning when flattened into 2D, the design is doing too much.
Watch your axes and clutter
A chart can lie without saying a false word.
Bad scale choices do that all the time. Truncated baselines can inflate differences. Overloaded line charts turn into spaghetti. Excess labels and colors create noise that competes with the pattern.
Use these habits instead:
Keep baselines honest when comparing magnitudes
Split crowded series into small multiples when one chart gets messy
Limit categories so the eye can track them
Label directly when possible instead of making people bounce between chart and legend
For product teams, I like Aakash Gupta’s OKPS Product Visualization framework because it pushes people to tie visuals to product questions, not vanity charts. That’s the right instinct. Start with the operating question. Then pick the visual that makes the answer obvious.
A fast chart chooser
Use this when you’re in a hurry:
If you need to show | Use | Avoid |
|---|---|---|
Ranking across categories | Bar chart | Pie chart |
Trend over time | Line chart | Table dump |
Mix within categories | Stacked bar | 3D stacked anything |
Correlation | Scatter plot | Two unrelated y-axes unless absolutely necessary |
Good chart selection feels boring. That’s a compliment. It means the data is doing the talking.
Design Principles for Clarity, Not Clutter
Default charts aren’t neutral. They often come loaded with heavy gridlines, random colors, tiny labels, and all the personality of airport carpeting.
A clean chart doesn’t need to be artistic. It needs to remove excuses for misunderstanding.
Use color like a tool
Color should signal meaning, not prove that your software has a palette.
Use one highlight color for the thing you want people to notice. Keep the rest muted. If every bar is loud, none of them are.
A few practical habits:
Highlight one story point such as the current quarter or target segment
Use consistent color meaning across charts so blue doesn’t mean revenue on one slide and churn on the next
Avoid rainbow palettes unless confusion is your actual objective
Accessibility matters too. Some colleagues won’t distinguish colors the way you do. Direct labels and stronger contrast help far more than clever aesthetics.
Write titles that answer the question
A title like “Monthly Revenue” is lazy. It names the metric, not the insight.
A better title says what matters:
Revenue grew after pricing changed
Paid search leads convert slower than referrals
Activation is strongest in accounts that use feature X
That doesn’t mean every title must be a conclusion. It means the chart should tell the reader why they’re looking at it.
A chart title should save people from asking, “What am I supposed to notice?”
If you want a solid companion read on this, Statspresso’s guide to data visualization best practices covers many of the habits that make charts easier to trust and easier to scan.
Remove junk that steals attention
The usual culprits:
Excess gridlines
Borders around every element
Legends that could have been direct labels
Decimal precision nobody needs
Decorative icons, gradients, and shadows
Most charts improve when you delete things.
That’s especially true in executive settings. If the visual takes too long to parse, people stop looking and start asking for the spreadsheet. You’ve lost.
Design with fairness in mind
Clear charts can still be unfair charts.
Equity-aware visualization matters because design choices can distort who appears to need attention. Standard tools often won’t warn you when a map or aggregation choice creates bias. One practical example: using choropleth maps without normalizing by population can misrepresent the scale of an issue in densely populated areas, which can affect resource allocation decisions (Tableau discussion on equity-aware data visualization).
For founders and operators, that matters beyond public policy. If you’re mapping support burden, user complaints, or service gaps, absolute counts alone can mislead you. A region with more users will almost always look “worse” unless you account for the denominator.
Design isn’t cosmetic. It’s operational judgment made visible.
Turn Your Chart into an Actionable Insight
A chart by itself is often just evidence waiting for an argument.
If you want someone to act on it, you need to add context, friction-reducing cues, and an honest account of what the data can’t say.
Annotate what matters
Don’t make people guess why a spike happened.
Add a short note for major events:
Pricing changed
New channel launched
Tracking issue fixed
Campaign paused
Product release shipped
That tiny bit of annotation turns a chart from “interesting shape” into “useful explanation.”
Good annotations are brief. They clarify, not crowd.
Add interactivity where it helps
Filters, tooltips, and drill-downs are useful when they reduce back-and-forth.
Examples:
A marketing lead filters by campaign
A PM drills into a cohort
A founder hovers to compare exact values without cluttering the chart
Interactive charts can simplify complex data for non-experts. They also make stakeholder conversations less binary. People can explore instead of asking for a new deck every time a follow-up question appears.
Still, interactivity is not a substitute for a clear default view. The first screen should tell the main story even before anyone clicks.
Show missing data honestly
This is one of the most ignored parts of how to visualize data.
Real business datasets are messy. Missing values are common. The verified data notes that missing data can affect 30-50% of real-world datasets, and that one honest technique is to avoid connecting dots in a line chart across a period where data is absent so the gap is visible (This is Important on visualizing missing data).
That sounds small. It isn’t.
When you connect across missing periods, you imply continuity. You suggest the underlying thing was measured and behaved smoothly. Sometimes it wasn’t measured at all.
Use these habits instead:
Leave visual gaps in line charts where data is absent
Label sample size when categories are inconsistent
Add a note if tracking changed
Separate missingness from zero because those are not the same thing
Missing data is not a formatting issue. It’s part of the story.
Make the insight durable
If the insight matters, don’t leave it stranded in a screenshot.
Store the prompt, the chart, the metric definition, and the takeaway together. That’s where documentation habits start to matter. Teams that care about reuse should borrow from broader knowledge management best practices so insights don’t disappear into Slack threads and meeting decks.
Try a repeatable pattern:
State the business question
Show the chart
Write the takeaway in one sentence
Note caveats or missing data
Save it where the team can find it again
Try asking your AI analytics tool:
“Show monthly active users over time, and leave gaps where data is missing.”
“Compare conversion by cohort and annotate the pricing launch.”
“Find outliers in support volume and explain possible causes.”
That’s how a chart becomes usable, not just visible.
How to Share Insights That Get Used
A chart that lives in a deck and dies in a meeting isn’t analysis. It’s performance.
Useful insights need a second life. They should be easy to revisit, easy to verify, and easy to share without someone asking, “Wait, which version is this?”
Save the question, not just the picture
Static exports still have their place. PDFs are fine. PNGs are fine. But if that’s all you keep, you lose the logic that produced the visual.
What matters is the reusable asset behind the chart:
the business question
the filters
the metric definition
the chart format
the written takeaway
If someone can’t recreate the chart without asking you what you meant, it’s not really shared.
Build a small library of trusted views
Organizations often don’t need more dashboards. They need fewer, more dependable ones.
A better approach is to save recurring questions as reusable views:
weekly revenue trend
pipeline by source
activation by cohort
churn by plan
campaign performance snapshot
That creates a living library of metrics people recognize. It also cuts down on “Can you pull this again?” requests because the answer already exists in a repeatable form.
Make charts stand on their own
A shared chart should survive outside the room where it was explained.
That means it needs:
A clear title
Labels people can read
Enough context to avoid misinterpretation
A short note on what changed, if relevant
If someone pastes the chart into Slack or a doc, the meaning should travel with it.
Prefer live assets over manual rework
Manual reporting creates subtle chaos. Someone exports a CSV on Monday, someone else updates a slide on Wednesday, and by Friday nobody knows whether the number is stale or changed.
Live, shareable dashboards and saved queries reduce that mess. They also support collaboration better because people can inspect the same underlying question instead of debating screenshots.
Conversational analytics offers more than a gimmick. If your team can ask follow-up questions directly against the same connected data, you stop rebuilding analysis from scratch each week.
A simple sharing standard
Use this standard for every chart worth keeping:
Element | What to include |
|---|---|
Question | What business question this chart answers |
Definition | What the main metric means |
Scope | Timeframe, filters, and segments |
Takeaway | One sentence on what the chart suggests |
Location | Where the team can find the latest version |
That’s how you shift from one-off analysis to a working data habit.
From Data to Decision in Minutes
Data consumers don’t need a seminar on analytics. They need a faster path from raw data to a decision they can defend.
Here’s the short version.
Start with the question: Ask something specific enough to change a decision.
Get the data into shape: Clean, join, and structure it so the chart answers one thing well.
Choose the right visual: Bars for comparison, lines for time, scatter for relationships.
Design for clarity: Use color sparingly, title the insight, remove junk.
Tell the truth: Show missing data transparently and avoid misleading scales.
Share the asset: Save the question, chart, and takeaway so people can reuse it.
If you’re learning how to visualize data, don’t overcomplicate it. The goal isn’t to make impressive charts. The goal is to make better decisions faster, with less guesswork and less waiting around for someone to build a dashboard.
Stop waiting for reports. Connect your first data source for free and ask your first question in the next five minutes. Go from data chaos to clarity, fast.
Connect your data to Statspresso, ask a plain-English question, and get your first chart in minutes. If you’re tired of dashboard sprawl, SQL bottlenecks, and answers that arrive after the decision window closes, start with one real question and let the data answer it.