How to Clean Up Data Fast (2026 Guide)

Data is a mess. That's the dirty little secret no one likes to admit. Waiting weeks for a data analyst to build a simple dashboard is a relic of the past. If you have customer signups from your website, sales records in Shopify, and support tickets in HubSpot, you're sitting on a goldmine. The problem? It's buried under a mountain of duplicate entries, missing values, and inconsistent formats.
This guide is for busy founders, product managers, and marketing leads who need answers, not another tool to learn. We'll show you how to clean up your data without writing a single line of SQL.
TL;DR: The Fast Way to Clean Data
Stop Manual Work: Cleaning data in spreadsheets is slow and error-prone. Stop wasting hours on VLOOKUPs and pivot tables.
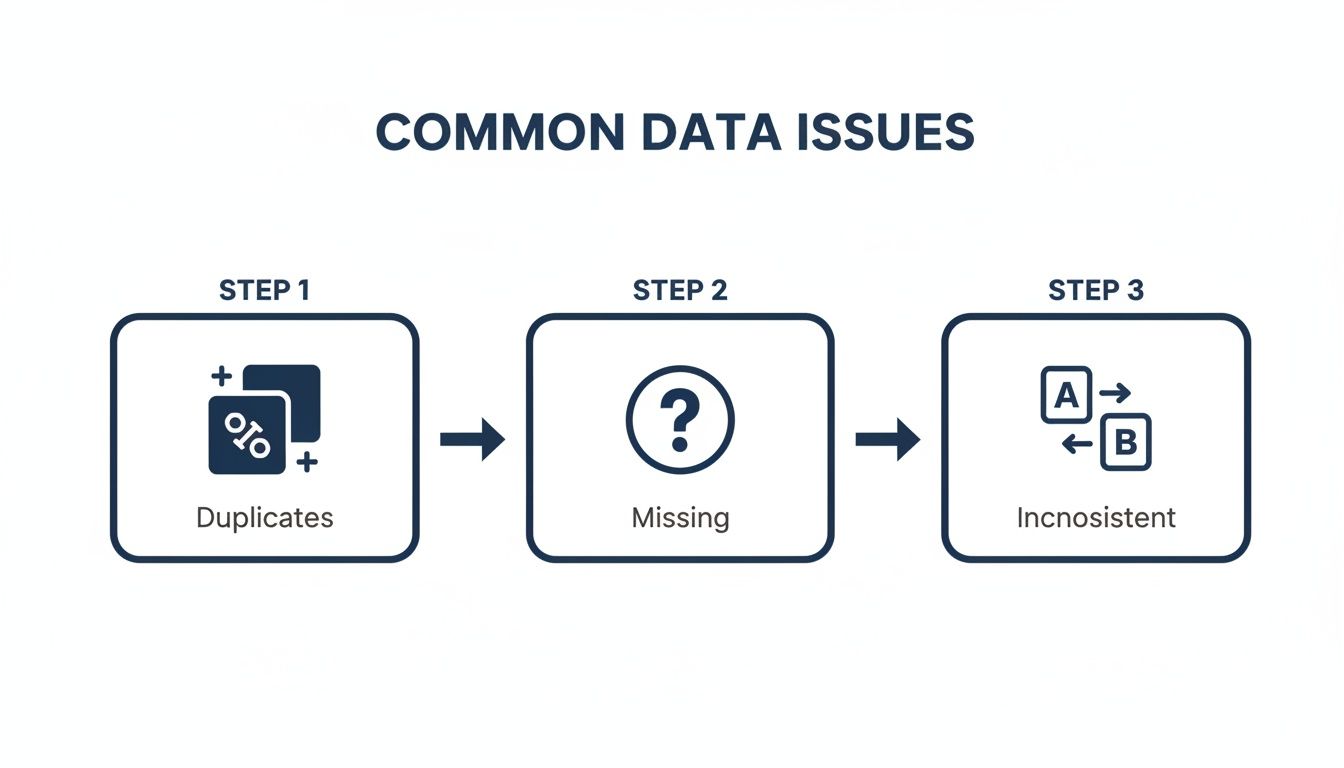
Find the Obvious Flaws First: Focus on the big three: duplicate records, missing values, and inconsistent formatting. These cause 90% of your reporting headaches.
Use Conversational AI: Tools like Statspresso, a Conversational AI Data Analyst, let you find and fix data issues just by asking questions in plain English.
Automate, Don't Repeat: Set up simple, automated checks to monitor data quality continuously. Catch problems the moment they happen, not a month later.
Why Your Messy Data Is Costing You Millions
Let's be honest for a second: your data is probably a mess. You've got customer signups from your website, sales records in Shopify, and a mountain of support tickets in HubSpot. Each system is telling a slightly different version of the same story.
You know there are valuable insights buried in there, but trying to connect the dots feels like an impossible task. This isn't just a minor headache. It's a genuine business risk that leads to bad forecasts, wasted marketing dollars, and opportunities that slip right through your fingers.

The Hidden Financial Drain of Bad Data
Dirty data isn't just a technical nuisance; it’s a silent killer of profits. It chips away at your bottom line in ways that are easy to miss until the damage is done. Every flawed marketing campaign launched on skewed customer segments, every inaccurate sales projection, and every decision based on incomplete information has a real price.
And it’s a big one. Recent 2026 industry reports show that poor data quality costs businesses an average of $12.9 million annually. The financial toll is staggering, with some reports noting that over 25% of data professionals say their companies lose more than $5 million a year from bad data alone. You can dig into the real cost of poor data quality yourself—it's an eye-opener.
From Technical Chore to Strategic Advantage
My goal here is to reframe how to clean up data. This isn't about you becoming an expert in SQL queries or wrestling with complex spreadsheet formulas. It's about turning a frustrating technical chore into your most direct path to revenue.
This is where a Conversational AI Data Analyst like Statspresso comes in. It handles the grunt work so you can get reliable, actionable business insights simply by asking questions.
Skip the SQL. Just ask your data a question and get a chart in seconds.
Try asking Statspresso: "How many duplicate contacts do I have in HubSpot?"
This guide will walk you through the practical steps to audit and clean your datasets, transforming that tangled mess of information into your company's most powerful asset. Let’s stop talking about data problems and start solving them.
Step 1: Find What's Broken (Data Profiling)
Before you can clean up data, you have to figure out what’s actually wrong with it. This initial diagnosis, data profiling, is the most critical step. In the past, this was painful. A data analyst would lock themselves away for days, hammering out complex SQL queries just to get a basic health report on a dataset.
That old way is slow and expensive. Waiting a week for a dashboard is no longer an option.

Thankfully, you no longer need a degree in computer science to understand your own data. The demand for smarter, automated BI solutions is why the data cleaning tools market is exploding—projected to leap from $3.62 billion in 2025 to $4.23 billion in 2026. That’s a 17% jump in just one year, according to a recent global data cleaning market research report.
Getting Your First Look Under the Hood
Think of data profiling as a quick check-up. The goal is to get a high-level summary that helps you scope out the cleaning project ahead.
You’re looking for quick answers to fundamental questions:
Record Count: How many rows are in my
customerstable?Fill Rates: What percentage of my
userstable has a blankphone_number?Value Distribution: Am I seeing "US," "USA," and "United States" in the same
countrycolumn?Numeric Ranges: For
order_total, what are the minimum, maximum, and average values? Any suspicious outliers?
Getting these answers used to be the hard part. Now, you just ask.
With a Conversational AI Data Analyst like Statspresso, you skip the code. You ask questions in plain English and get an instant data profile.
This approach gives you an immediate, clear picture of where the problems lie, pointing your cleaning efforts in the right direction from the start.
Step 2: Fix the Common Culprits
Alright, you've rolled up your sleeves and found the mess. Now for the fun part: cleaning it up. Most "dirty data" falls into a few familiar categories. If you learn to spot and fix these, you're 90% of the way there.
Those Pesky Duplicate Records
Duplicates are a classic data headache. They aren't just untidy; they actively break your metrics. You might have three entries for the same person: "Jon Smith," "Jonathan Smith," and one tied to "jon.smith@email.com." In your system, that’s three different customers.
This single issue causes a cascade of problems:
Inflated User Counts: Your customer base suddenly looks larger, throwing off growth reports.
Wasted Marketing Spend: You send the same campaign to "Jon" three times. Annoying for him, expensive for you.
Skewed Sales Reports: Your sales-per-customer and LTV calculations are completely wrong.
Hunting these down in Excel with VLOOKUPs is a nightmare. There’s a better way.
Try asking Statspresso: "Show me all customers with duplicate email addresses."
This turns a multi-hour task into a simple question. You get a clean list of duplicates to review and merge, instantly improving data integrity.
What to Do With All Those Missing Values
You open a dataset and see gaping holes. A contact is missing a phone_number. A deal is missing its deal_amount. What's the right move? Your first instinct might be to just delete the entire row.
Resist that urge. Deleting data without understanding the context is one of the biggest mistakes you can make.
You have smarter options:
Remove the Record: Only as a last resort. A customer record with zero contact info is probably dead weight.
Fill with a Default: For categorical data like
country, you can fill blanks with "Unknown" or "N/A." This preserves the record but flags the missing piece.Impute the Value: For numerical data, it's sometimes appropriate to fill missing values with the mean, median, or mode of that column.
The old way involves complex CASE statements in SQL or nested IF/THEN formulas. Instead, you can just ask. A Conversational AI Data Analyst like Statspresso simplifies this. Ask, "How many deals are missing a close_date?" to see the scale of the problem and then decide how to handle it.
Untangling Inconsistent Formats
Inconsistent formatting is the silent killer of accurate reporting. It creeps in when data is entered by different people or from different apps.
You've seen it all before:
Dates: '12/31/2026' vs. '2026-12-31' vs. 'Dec 31, 2026'
Country Codes: 'USA', 'United States', 'US', 'U.S.A.'
Text Casing: 'john doe' vs. 'John Doe' vs. 'JOHN DOE'
These little variations make it impossible to properly group and analyze your data. While you can use scripts for this—Python is a fantastic tool for data cleaning, as detailed in this article on enhancing logistics with Python data analytics—writing code for every inconsistency is incredibly time-consuming.
Instead of wrestling with regular expressions, let a conversational analytics tool spot and suggest these fixes automatically. It can identify all the different ways "United States" appears, propose a standard format, and apply that fix in seconds.
The Statspresso Way: From Mess to Insight in Minutes
We've talked through the painful, traditional process. Now, let’s get to the modern approach that lets you skip the grunt work and get straight to reliable insights.
Think of it as a superpower. Instead of spending days on SQL scripts, you can have a clean dataset in minutes. This is about having an incredibly sharp assistant who surfaces problems for you, so you can focus on making the final call.
The whole thing starts by connecting your data. Whether it's in a Postgres database, scattered across Google Sheets, or living in your HubSpot CRM, you just plug it in. From there, it’s all a conversation.
From Manual Labor to a Simple Conversation
The old way made you a detective and a janitor. You wrote queries to find the mess, then wrote more scripts to clean it up. The new approach is like briefing a highly competent analyst.
Those common culprits—duplicates, missing values, and weird inconsistencies—are exactly what you can solve in seconds with a simple prompt.
Find duplicates: "Show me all rows in the
contactstable with duplicate email addresses."Find missing data: "In the
dealstable, find all records where thecountryfield is empty and show me the top 10."Find inconsistencies: "What are all the unique values in the
countrycolumn and how many of each are there?"
Each question gives you an immediate, concrete list to work with.
A Head-to-Head Comparison
Let's put the old and new methods side-by-side. The difference isn't just time; it's a fundamental change in how you work with data.
The Old Way vs. The New Way
Task | The Old Way (Manual SQL/Excel) | The New Way (Statspresso) |
|---|---|---|
Find Duplicates | Write a | Ask: "Show me duplicate customers by email." Time: 10 seconds. |
Identify Nulls | Run | Ask: "Profile my |
Fix Inconsistencies | Write | Ask: "Standardize the country column." Statspresso suggests a fix, you approve it. Time: 1 minute. |
Required Skill | Intermediate SQL or advanced Excel. | The ability to ask a clear question. |
Accuracy | Prone to human error and missed edge cases. | Systematic and exhaustive. |
The table speaks for itself. The efficiency gains are enormous. This proactive approach is also key to building more reliable systems. If you're looking to create a more robust data architecture, our guide on the STAR schema data model is a great place to start.
Step 3: Keep Your Data Clean for Good
You've just finished a massive data cleanup. Everything is pristine. Hard truth: that clean slate won't last. New data is always flowing in.
The real win isn't a one-off project. It's shifting from reactive cleanup to proactive, continuous data quality monitoring. You need a watchdog that catches issues the moment they appear, not weeks later.
Your Data Quality Mission Control
Set up a dedicated data quality dashboard. It’s the vital signs monitor for your business's information. A great dashboard tracks a few key metrics:
Null Value Percentage: What percentage of crucial fields like
emailordeal_amountare empty?Duplicate Entry Rate: How many duplicate customer records are being created each day?
Format Consistency: How many records have mismatched phone number formats?
Outlier Detection: Are you getting alerts for bizarre entries, like a $1,000,000 order when your average is $100?
This turns data quality from a dreaded quarterly audit into a simple, daily check-in.
From Manual Spot-Checks to Automated Alerts
Setting up this kind of monitoring used to be a heavy lift. No longer. A Conversational AI Data Analyst like Statspresso lets you build these checks yourself in minutes. You ask a question to check your data's health, then save that query to run automatically. No code, no complex scheduling.
Try asking Statspresso: "Show me my revenue by month for the last year as a bar chart." Then, pin that to your dashboard to monitor trends automatically.
This simple process transforms data integrity from a constant cat-and-mouse game into an automated, hands-off discipline. It's like having a junior analyst who never sleeps. This is how you build real, lasting confidence in your data.
Your Data Cleaning Questions, Answered
You’ve got data, deadlines, and questions. Let's tackle the most common ones.
How Often Should I Clean My Data?
Constantly. But that doesn't mean manually scrubbing spreadsheets daily. Think of it as ongoing maintenance. High-volume data (like new signups) needs daily monitoring. A static dataset (like a product catalog) might only need a monthly check. The goal is to move from painful manual checks to automated, continuous monitoring.
What Is the Biggest Mistake People Make When Cleaning Data?
Deleting data without understanding its context. I've seen it time and again. You spot a row with a missing value and the urge to hit "delete" is powerful.
Resist. That incomplete record might be the only trace of a massive sales lead. Before deleting, ask:
Can this be fixed?
Is the rest of the record still useful?
Why is this value missing? A blank field is a clue. Use it to trace the problem to its source, like a broken web form.
Can AI Really Be Trusted to Clean Our Data?
It’s a good question. The trick is to reframe AI's role. It’s not an autonomous robot making decisions behind your back; it's a brilliant, fast assistant.
A Conversational AI Data Analyst like Statspresso works with you.
AI finds potential problems. It scans millions of records in seconds to find every duplicate email or inconsistent state abbreviation.
It suggests a solution. The AI presents its findings and proposes a fix. "I found 50 duplicates. Should I merge them?"
A human gives final approval. This is the crucial part. You review the AI's suggestions and make the final call with a click.
This "human-in-the-loop" model gives you the best of both worlds: the raw speed of a machine, with you in complete control.
Try asking Statspresso: "Show me all contacts with invalid email formats." You’ll immediately see how it highlights issues for your review, putting you firmly in the driver's seat.
Ready to stop wrestling with spreadsheets and get clear answers? With Statspresso, a Conversational AI Data Analyst, you can skip the SQL and just ask your data a question. Connect your first data source for free and ask your first question.
Data is a mess. That's the dirty little secret no one likes to admit. Waiting weeks for a data analyst to build a simple dashboard is a relic of the past. If you have customer signups from your website, sales records in Shopify, and support tickets in HubSpot, you're sitting on a goldmine. The problem? It's buried under a mountain of duplicate entries, missing values, and inconsistent formats.
This guide is for busy founders, product managers, and marketing leads who need answers, not another tool to learn. We'll show you how to clean up your data without writing a single line of SQL.
TL;DR: The Fast Way to Clean Data
Stop Manual Work: Cleaning data in spreadsheets is slow and error-prone. Stop wasting hours on VLOOKUPs and pivot tables.
Find the Obvious Flaws First: Focus on the big three: duplicate records, missing values, and inconsistent formatting. These cause 90% of your reporting headaches.
Use Conversational AI: Tools like Statspresso, a Conversational AI Data Analyst, let you find and fix data issues just by asking questions in plain English.
Automate, Don't Repeat: Set up simple, automated checks to monitor data quality continuously. Catch problems the moment they happen, not a month later.
Why Your Messy Data Is Costing You Millions
Let's be honest for a second: your data is probably a mess. You've got customer signups from your website, sales records in Shopify, and a mountain of support tickets in HubSpot. Each system is telling a slightly different version of the same story.
You know there are valuable insights buried in there, but trying to connect the dots feels like an impossible task. This isn't just a minor headache. It's a genuine business risk that leads to bad forecasts, wasted marketing dollars, and opportunities that slip right through your fingers.
The Hidden Financial Drain of Bad Data
Dirty data isn't just a technical nuisance; it’s a silent killer of profits. It chips away at your bottom line in ways that are easy to miss until the damage is done. Every flawed marketing campaign launched on skewed customer segments, every inaccurate sales projection, and every decision based on incomplete information has a real price.
And it’s a big one. Recent 2026 industry reports show that poor data quality costs businesses an average of $12.9 million annually. The financial toll is staggering, with some reports noting that over 25% of data professionals say their companies lose more than $5 million a year from bad data alone. You can dig into the real cost of poor data quality yourself—it's an eye-opener.
From Technical Chore to Strategic Advantage
My goal here is to reframe how to clean up data. This isn't about you becoming an expert in SQL queries or wrestling with complex spreadsheet formulas. It's about turning a frustrating technical chore into your most direct path to revenue.
This is where a Conversational AI Data Analyst like Statspresso comes in. It handles the grunt work so you can get reliable, actionable business insights simply by asking questions.
Skip the SQL. Just ask your data a question and get a chart in seconds.
Try asking Statspresso: "How many duplicate contacts do I have in HubSpot?"
This guide will walk you through the practical steps to audit and clean your datasets, transforming that tangled mess of information into your company's most powerful asset. Let’s stop talking about data problems and start solving them.
Step 1: Find What's Broken (Data Profiling)
Before you can clean up data, you have to figure out what’s actually wrong with it. This initial diagnosis, data profiling, is the most critical step. In the past, this was painful. A data analyst would lock themselves away for days, hammering out complex SQL queries just to get a basic health report on a dataset.
That old way is slow and expensive. Waiting a week for a dashboard is no longer an option.
Thankfully, you no longer need a degree in computer science to understand your own data. The demand for smarter, automated BI solutions is why the data cleaning tools market is exploding—projected to leap from $3.62 billion in 2025 to $4.23 billion in 2026. That’s a 17% jump in just one year, according to a recent global data cleaning market research report.
Getting Your First Look Under the Hood
Think of data profiling as a quick check-up. The goal is to get a high-level summary that helps you scope out the cleaning project ahead.
You’re looking for quick answers to fundamental questions:
Record Count: How many rows are in my
customerstable?Fill Rates: What percentage of my
userstable has a blankphone_number?Value Distribution: Am I seeing "US," "USA," and "United States" in the same
countrycolumn?Numeric Ranges: For
order_total, what are the minimum, maximum, and average values? Any suspicious outliers?
Getting these answers used to be the hard part. Now, you just ask.
With a Conversational AI Data Analyst like Statspresso, you skip the code. You ask questions in plain English and get an instant data profile.
This approach gives you an immediate, clear picture of where the problems lie, pointing your cleaning efforts in the right direction from the start.
Step 2: Fix the Common Culprits
Alright, you've rolled up your sleeves and found the mess. Now for the fun part: cleaning it up. Most "dirty data" falls into a few familiar categories. If you learn to spot and fix these, you're 90% of the way there.
Those Pesky Duplicate Records
Duplicates are a classic data headache. They aren't just untidy; they actively break your metrics. You might have three entries for the same person: "Jon Smith," "Jonathan Smith," and one tied to "jon.smith@email.com." In your system, that’s three different customers.
This single issue causes a cascade of problems:
Inflated User Counts: Your customer base suddenly looks larger, throwing off growth reports.
Wasted Marketing Spend: You send the same campaign to "Jon" three times. Annoying for him, expensive for you.
Skewed Sales Reports: Your sales-per-customer and LTV calculations are completely wrong.
Hunting these down in Excel with VLOOKUPs is a nightmare. There’s a better way.
Try asking Statspresso: "Show me all customers with duplicate email addresses."
This turns a multi-hour task into a simple question. You get a clean list of duplicates to review and merge, instantly improving data integrity.
What to Do With All Those Missing Values
You open a dataset and see gaping holes. A contact is missing a phone_number. A deal is missing its deal_amount. What's the right move? Your first instinct might be to just delete the entire row.
Resist that urge. Deleting data without understanding the context is one of the biggest mistakes you can make.
You have smarter options:
Remove the Record: Only as a last resort. A customer record with zero contact info is probably dead weight.
Fill with a Default: For categorical data like
country, you can fill blanks with "Unknown" or "N/A." This preserves the record but flags the missing piece.Impute the Value: For numerical data, it's sometimes appropriate to fill missing values with the mean, median, or mode of that column.
The old way involves complex CASE statements in SQL or nested IF/THEN formulas. Instead, you can just ask. A Conversational AI Data Analyst like Statspresso simplifies this. Ask, "How many deals are missing a close_date?" to see the scale of the problem and then decide how to handle it.
Untangling Inconsistent Formats
Inconsistent formatting is the silent killer of accurate reporting. It creeps in when data is entered by different people or from different apps.
You've seen it all before:
Dates: '12/31/2026' vs. '2026-12-31' vs. 'Dec 31, 2026'
Country Codes: 'USA', 'United States', 'US', 'U.S.A.'
Text Casing: 'john doe' vs. 'John Doe' vs. 'JOHN DOE'
These little variations make it impossible to properly group and analyze your data. While you can use scripts for this—Python is a fantastic tool for data cleaning, as detailed in this article on enhancing logistics with Python data analytics—writing code for every inconsistency is incredibly time-consuming.
Instead of wrestling with regular expressions, let a conversational analytics tool spot and suggest these fixes automatically. It can identify all the different ways "United States" appears, propose a standard format, and apply that fix in seconds.
The Statspresso Way: From Mess to Insight in Minutes
We've talked through the painful, traditional process. Now, let’s get to the modern approach that lets you skip the grunt work and get straight to reliable insights.
Think of it as a superpower. Instead of spending days on SQL scripts, you can have a clean dataset in minutes. This is about having an incredibly sharp assistant who surfaces problems for you, so you can focus on making the final call.
The whole thing starts by connecting your data. Whether it's in a Postgres database, scattered across Google Sheets, or living in your HubSpot CRM, you just plug it in. From there, it’s all a conversation.
From Manual Labor to a Simple Conversation
The old way made you a detective and a janitor. You wrote queries to find the mess, then wrote more scripts to clean it up. The new approach is like briefing a highly competent analyst.
Those common culprits—duplicates, missing values, and weird inconsistencies—are exactly what you can solve in seconds with a simple prompt.
Find duplicates: "Show me all rows in the
contactstable with duplicate email addresses."Find missing data: "In the
dealstable, find all records where thecountryfield is empty and show me the top 10."Find inconsistencies: "What are all the unique values in the
countrycolumn and how many of each are there?"
Each question gives you an immediate, concrete list to work with.
A Head-to-Head Comparison
Let's put the old and new methods side-by-side. The difference isn't just time; it's a fundamental change in how you work with data.
The Old Way vs. The New Way
Task | The Old Way (Manual SQL/Excel) | The New Way (Statspresso) |
|---|---|---|
Find Duplicates | Write a | Ask: "Show me duplicate customers by email." Time: 10 seconds. |
Identify Nulls | Run | Ask: "Profile my |
Fix Inconsistencies | Write | Ask: "Standardize the country column." Statspresso suggests a fix, you approve it. Time: 1 minute. |
Required Skill | Intermediate SQL or advanced Excel. | The ability to ask a clear question. |
Accuracy | Prone to human error and missed edge cases. | Systematic and exhaustive. |
The table speaks for itself. The efficiency gains are enormous. This proactive approach is also key to building more reliable systems. If you're looking to create a more robust data architecture, our guide on the STAR schema data model is a great place to start.
Step 3: Keep Your Data Clean for Good
You've just finished a massive data cleanup. Everything is pristine. Hard truth: that clean slate won't last. New data is always flowing in.
The real win isn't a one-off project. It's shifting from reactive cleanup to proactive, continuous data quality monitoring. You need a watchdog that catches issues the moment they appear, not weeks later.
Your Data Quality Mission Control
Set up a dedicated data quality dashboard. It’s the vital signs monitor for your business's information. A great dashboard tracks a few key metrics:
Null Value Percentage: What percentage of crucial fields like
emailordeal_amountare empty?Duplicate Entry Rate: How many duplicate customer records are being created each day?
Format Consistency: How many records have mismatched phone number formats?
Outlier Detection: Are you getting alerts for bizarre entries, like a $1,000,000 order when your average is $100?
This turns data quality from a dreaded quarterly audit into a simple, daily check-in.
From Manual Spot-Checks to Automated Alerts
Setting up this kind of monitoring used to be a heavy lift. No longer. A Conversational AI Data Analyst like Statspresso lets you build these checks yourself in minutes. You ask a question to check your data's health, then save that query to run automatically. No code, no complex scheduling.
Try asking Statspresso: "Show me my revenue by month for the last year as a bar chart." Then, pin that to your dashboard to monitor trends automatically.
This simple process transforms data integrity from a constant cat-and-mouse game into an automated, hands-off discipline. It's like having a junior analyst who never sleeps. This is how you build real, lasting confidence in your data.
Your Data Cleaning Questions, Answered
You’ve got data, deadlines, and questions. Let's tackle the most common ones.
How Often Should I Clean My Data?
Constantly. But that doesn't mean manually scrubbing spreadsheets daily. Think of it as ongoing maintenance. High-volume data (like new signups) needs daily monitoring. A static dataset (like a product catalog) might only need a monthly check. The goal is to move from painful manual checks to automated, continuous monitoring.
What Is the Biggest Mistake People Make When Cleaning Data?
Deleting data without understanding its context. I've seen it time and again. You spot a row with a missing value and the urge to hit "delete" is powerful.
Resist. That incomplete record might be the only trace of a massive sales lead. Before deleting, ask:
Can this be fixed?
Is the rest of the record still useful?
Why is this value missing? A blank field is a clue. Use it to trace the problem to its source, like a broken web form.
Can AI Really Be Trusted to Clean Our Data?
It’s a good question. The trick is to reframe AI's role. It’s not an autonomous robot making decisions behind your back; it's a brilliant, fast assistant.
A Conversational AI Data Analyst like Statspresso works with you.
AI finds potential problems. It scans millions of records in seconds to find every duplicate email or inconsistent state abbreviation.
It suggests a solution. The AI presents its findings and proposes a fix. "I found 50 duplicates. Should I merge them?"
A human gives final approval. This is the crucial part. You review the AI's suggestions and make the final call with a click.
This "human-in-the-loop" model gives you the best of both worlds: the raw speed of a machine, with you in complete control.
Try asking Statspresso: "Show me all contacts with invalid email formats." You’ll immediately see how it highlights issues for your review, putting you firmly in the driver's seat.
Ready to stop wrestling with spreadsheets and get clear answers? With Statspresso, a Conversational AI Data Analyst, you can skip the SQL and just ask your data a question. Connect your first data source for free and ask your first question.