Data Strategy for Startups: What Actually Works

You’ve got data. Loads of it. It’s streaming in from your Shopify store, your HubSpot CRM, and your own product database. So why does getting a straight answer to a simple question like, "What's our monthly recurring revenue?" feel like pulling teeth? Waiting weeks for a data analyst to build a dashboard is a relic of the past. For a modern startup, a data strategy isn't about hiring a small army of data scientists. It's about getting answers fast and empowering your team to find them on their own.
TL;DR: Key Takeaways
Align Data with Goals: Don't just collect data. Use a framework like Pirate Metrics (AARRR) to connect every metric you track to a real business outcome.
Build a Lean Stack: You only need three things: your data sources (like Stripe, HubSpot), a central data warehouse (like BigQuery), and an analytics layer. Keep it simple.
Embrace Conversational AI: The fastest way to get answers is to just ask. A Conversational AI Data Analyst like Statspresso lets anyone on your team ask questions in plain English. Skip the SQL. Just ask your data a question and get a chart in seconds.
Democratize Data: Your goal is to empower everyone—from marketing to product—to find their own answers. This builds a data-driven culture and breaks down information bottlenecks.
Start Now: You don't need a huge budget or a dedicated team to start. You can build a powerful data foundation and get your first insights today.
Why Your Startup Has a Data Problem, Not a Data Shortage
You're likely sitting on a mountain of valuable information, but you can’t get to it when it matters. The traditional approach—filing a ticket with engineering and waiting days for a new dashboard—is a drag on growth. By the time you get the report, the moment has passed. This frustrating cycle prevents your team from making the quick, data-informed decisions that define successful startups.
A smart data strategy turns this old process upside down. The goal is to empower everyone on your team to answer their own questions, without needing to write a single line of SQL or interrupt an engineer. It’s about transforming data chaos into your most powerful competitive edge.
The key insight is simple: modern tools eliminate the slow, ticket-based process, creating a direct path from a business question to a clear insight.
The Power of Conversational Analytics
This is where a Conversational AI Data Analyst like Statspresso changes the game. Instead of wrestling with complex tools or waiting for a report, your team can simply ask questions in plain English. Think of it as having a data analyst on call 24/7. Your product manager, your marketing lead, or even you can go from a messy spreadsheet to an actionable chart in just a few seconds.
Try asking Statspresso: "Compare our user signups this month to last month and show me the percentage change."
For a growing startup, this approach delivers three huge benefits:
Unlocks Speed: Get crucial answers in minutes, not weeks. Jump on opportunities and fix problems before they snowball.
Empowers Everyone: Your marketing lead can analyze campaign performance without learning Tableau. Your PM can track feature adoption without writing SQL.
Reduces Costs: Sidestep the high salary and lengthy hiring process for a dedicated data team in the early stages.
This guide is your no-fluff playbook for making this your new reality.
Aligning Your Data with Key Business Goals

Before you track anything, ask one simple question: "Why?" Without a clear answer tied to your business goals, your data strategy for startups is just an expensive hobby. You'll wind up with dashboards that look impressive but tell you nothing about what to do next. The point isn't to collect all the data; it's to collect the right data. Every metric you obsess over should directly connect to what moves the needle—acquiring customers, growing revenue, or making your product sticky.
Use Pirate Metrics as Your Treasure Map
A brilliant, no-fluff model for this is Dave McClure's "Pirate Metrics," or AARRR. It's a simple way to connect your business objectives to the numbers that prove you're heading in the right direction.
The framework carves the customer journey into five critical stages:
Acquisition: How are people discovering you?
Activation: Is their first experience compelling?
Retention: Are they coming back for more?
Referral: Are they telling their friends?
Revenue: Are they willing to pay?
This forces you to move from a vague goal like "achieve product-market fit" to a specific target like, "increase user retention by 15% in Q3." Suddenly, you have a clear metric your team can rally behind. This clarity turns your data from a passive report card into an active playbook.
Focus on Leading Indicators, Not Just Lagging Ones
It’s also critical to distinguish between leading and lagging indicators. I’ve seen countless startups make the mistake of only tracking lagging indicators—like driving by looking in the rearview mirror.
Indicator Type | Description | Example |
|---|---|---|
Lagging Indicator | An output metric that shows past results. Easy to measure, but too late to influence. |
|
Leading Indicator | An input metric that can predict future results. Harder to pin down, but you can actually change it. |
|
Your churn rate (lagging) tells you how many customers you’ve already lost. But tracking how many people use a specific feature (leading) can predict who might churn, giving you a chance to step in. A smart data strategy balances both. This is where a Conversational AI Data Analyst gives you an edge. Instead of waiting for a complex report, just ask.
Try asking Statspresso: "Show me the number of users who used our 'Project Template' feature for the first time last week."
By focusing on these actionable, leading metrics, your data conversations immediately shift from "what happened?" to "what should we do next?"
Building Your Lean Startup Data Stack
Your data strategy for startups shouldn't involve a ten-person engineering team or a budget that makes your investors sweat. The real goal is to build a lean, cost-effective data stack that gives you answers today but can easily grow with you tomorrow. For an early-stage company, it really just comes down to three core pieces.
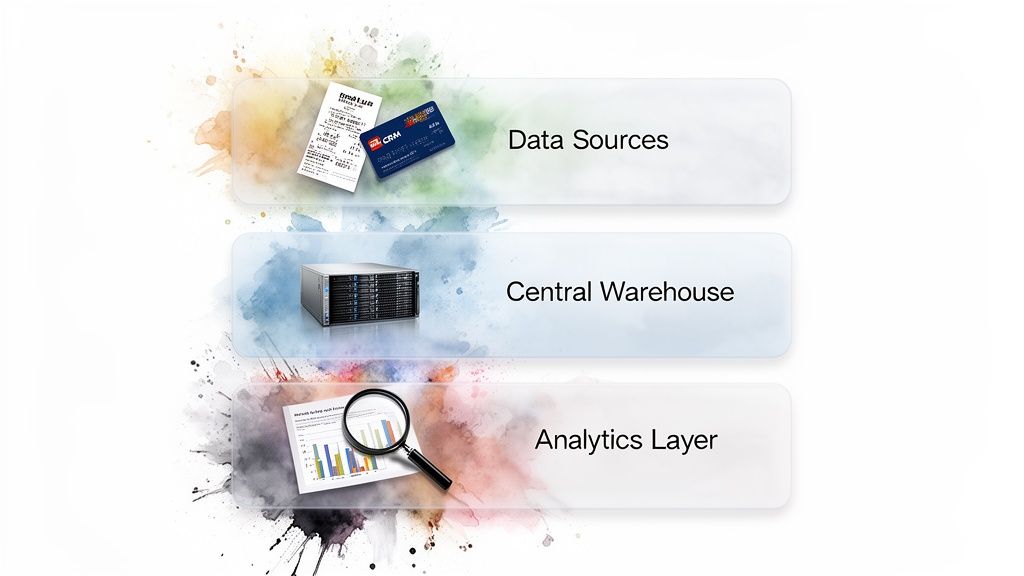
The Three Essential Layers of a Startup Data Stack
Think of your data stack like a well-organized kitchen: ingredients, a prep counter, and tools for cooking.
Data Sources (The Ingredients): This is all the raw data your business generates. It’s in your product database (like Postgres or MySQL), your CRM (HubSpot), your payment system (Stripe), and your marketing tools (Google Analytics).
Central Warehouse (The Countertop): This is where you bring everything together—your single source of truth. A cloud data warehouse like Snowflake, Google BigQuery, or Amazon Redshift acts as your central prep station. Tools like Fivetran or Airbyte make it surprisingly simple to build data pipelines and get your data here.
Analytics Layer (The Tools): This is how you finally turn that prepped data into answers. It's the part of the stack your team interacts with to ask questions and get back charts, tables, and insights.
The magic happens when these three layers work together seamlessly.
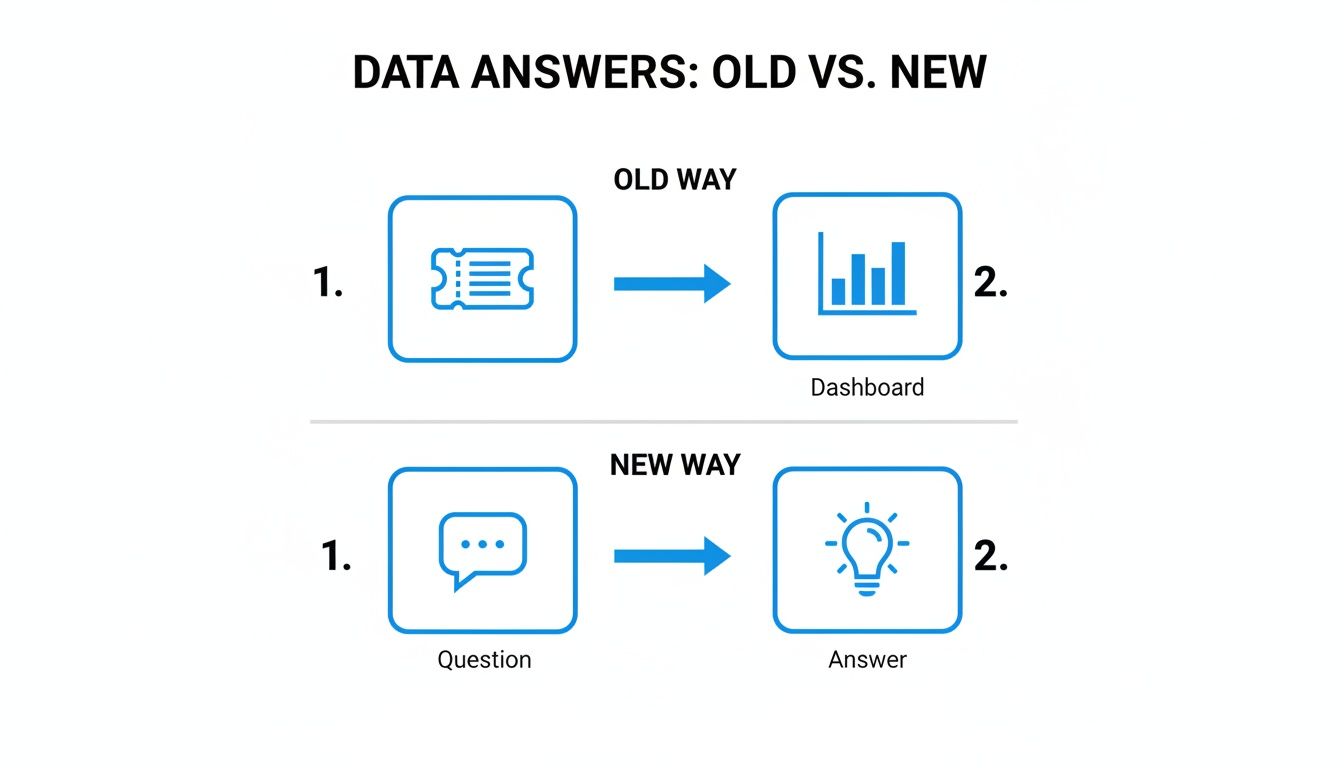
Startup Analytics: The Old Way vs. The New Way
The difference between a traditional, manual approach and a modern, automated one is night and day. It’s the difference between waiting weeks for a report and getting an answer before you’ve finished your coffee.
Task | The Old Way (Manual SQL & Dashboards) | The New Way (With Statspresso) |
|---|---|---|
Get a new metric | File an engineering ticket. Wait for an analyst to write SQL, build a report, and add it to a dashboard. Timeline: 1-2 weeks. | Ask a question in plain English, like "What was our average revenue per user last month?" Timeline: ~10 seconds. |
Follow-up question | File another ticket. Wait for the analyst to modify the query. Timeline: 1-3 days. | Ask a follow-up question in the same chat, like "Now break that down by marketing channel." Timeline: ~5 seconds. |
Share an insight | Take a screenshot of a static dashboard, paste it in Slack, and add context. The data is instantly outdated. | Get a real-time chart, add it to a shared dashboard with one click, and send a link. The data always stays fresh. |
Who gets answers | Only people who know SQL or have access to a busy analyst. | Anyone on your team—from the CEO to the marketing intern. |
The new way isn't just about speed; it's about empowerment. It gives everyone on the team direct access to information, a core pillar of effective business intelligence for startups. Instead of a data gatekeeper, your team can explore on their own. This is where a Conversational AI Data Analyst like Statspresso becomes the most powerful part of your analytics layer. It’s built to help you skip the SQL and just get answers.
Try asking Statspresso: "Show me my top 5 customers by lifetime value as a table."
By connecting your data warehouse to a conversational analytics tool, you complete your lean data stack. You get the power of a full-fledged data team without the massive overhead.
How to Unify Your Disparate Data Sources
Alright, you’ve outlined your business goals and picked a lean data stack. Now comes the fun part: connecting all the pipes. This is the moment your data strategy for startups goes from a plan on paper to a living, breathing system. Your data is probably scattered across a dozen different SaaS tools. To find the game-changing insights, you have to get these systems talking to each other.
Start with Smart Event Tracking
The first step is to get a handle on user behavior through event tracking. You need one consistent method for tracking user actions across your website and app. A Customer Data Platform (CDP) like Segment can be a lifesaver. Instead of asking engineers to write custom tracking code for every new tool, you implement a single tracking library one time. From there, you just flip a switch to send that clean data to your warehouse and other tools. A unified data stream means you define an event like 'User Signed Up' just once, preventing data chaos.
Your Initial Event Tracking Checklist
Start small and focus on the events that have the highest impact. Don't try to track every click on day one.
Acquisition/Activation:
User Signed Up,Trial Started,Onboarding Step CompletedRetention:
Key Feature Used,Project Created,Team Member InvitedRevenue:
Plan Upgraded,Subscription Canceled,Payment Method Updated
This focused approach gives you a powerful signal right away without overwhelming your team.
The Superpower of a Single Source of Truth
Once your event data is flowing into your data warehouse alongside data from other tools, you’ve created a startup superpower: a single source of truth. Now, your Shopify sales data can sit next to your HubSpot marketing data and your PostgreSQL application data. This unified view lets you ask the complex, cross-functional questions that actually drive growth. This is exactly where a Conversational AI Data Analyst like Statspresso shines. You no longer need an expert to write complex SQL joins just to connect these tables. You can simply ask a question in plain English.
Try asking Statspresso: "Which marketing campaigns from HubSpot brought in customers with the highest lifetime value in Shopify?"
Suddenly, your head of marketing can see exactly which campaigns deliver profitable customers, not just signups. Your product manager can pinpoint which features convince users to upgrade. This is the real promise of a modern data strategy. As you think about bringing your data together, understanding Why Unified API is a Game Changer for SaaS Products can also give you a serious strategic edge.
Skip the SQL. Just ask your data a question and get a chart in seconds. This isn't some futuristic dream; it's what's possible for your startup today.
Getting Real Answers from Your Raw Data
Alright, you’ve done the hard work. Your data is flowing into a central warehouse. So, how do you actually get answers out of it? Especially when you don't have a data analyst on payroll yet? This is where a smart data strategy for startups really pays off. Let’s imagine your Product Manager, Sarah, just launched a new "Project Template" feature. She’s anxious to know if anyone is using it.
The Old Way: A Growth Killer
In a typical company, Sarah's next step is frustratingly slow. She'd file a ticket, try to describe the metric she needs, and then… wait. Days or weeks later, she might get a static chart. What if she has a follow-up question? The whole painful cycle starts again. This friction kills momentum.
The New Way: Instant Answers
With a modern data stack, Sarah's experience is completely different. She doesn't need to write a ticket or learn SQL. Instead, she can just ask her question directly to a Conversational AI Data Analyst like Statspresso. She types a simple question, just like she'd ask a colleague.
Try asking Statspresso: "Show me the daily active users for our new Project Template feature since last Tuesday."
Within seconds, a clear bar chart pops up. This creates a tight feedback loop. Sarah can now dig deeper in real time, asking follow-up questions without hitting a wall.
"Break this down by user signup date."
"Which user cohort has the highest adoption rate?"
"Compare this to the adoption of our last feature launch."
This is the whole point of conversational analytics: skip the SQL and just ask your data a question to get a chart in seconds. It empowers everyone on your team to find their own answers.
Garbage In, Garbage Out: The Data Quality Problem
Here's the catch: the most sophisticated analytics tool is worthless if it's running on bad data. If your numbers are a mess, your decisions will be, too. Period. Recent industry reports highlight this is a massive issue, with many organizations admitting their data quality is just average or poor. Research on data transformation statistics shows this is a top challenge. You can’t build a data-driven culture on untrustworthy numbers.
So, how do you keep your data clean?
Establish Clear Ownership: Make someone responsible for key data sources. The marketing lead owns the accuracy of HubSpot data. The Head of Product owns product event tracking.
Automate Validation: Use your tools to set up simple checks, like flagging any sale in Stripe that's missing a customer email.
Use Smart Tools: A modern platform like Statspresso can act as a watchdog, automatically flagging inconsistencies or weird outliers.
Making data quality a priority from day one ensures the answers you get are not just fast, but right.
Your Data Strategy by Startup Stage
The biggest mistake founders make is copying a data strategy from a company at a different stage. What works at $5M ARR is different from what you need at $500K — and both are different from what you should prioritize before product-market fit. Here's how to calibrate.
Stage 1: Pre-PMF ($0–$100K ARR)
Before product-market fit, most of your data questions are qualitative: Why did this customer churn? Why did this one stay? Spreadsheets and a weekly manual review are enough. The one quantitative metric worth obsessing over at this stage is your activation rate — the percentage of new signups who reach your product's "aha moment" within the first session.
Everything else is noise. Resist the urge to build dashboards. The risk at this stage is collecting data on the wrong thing and optimizing toward a local maximum that doesn't represent a real market.
Data stack at this stage: Your SaaS tools (Stripe, HubSpot, or Shopify) + a spreadsheet + Statspresso connected to your database for ad hoc queries. No warehouse needed yet.
Stage 2: Post-PMF ($100K–$1M ARR)
Once you have a signal that the product works, you need to scale what's working and cut what's not. This is when revenue metrics and cohort analysis become essential. The questions that matter:
Which acquisition channels produce customers who actually retain? Not just who converts — who stays.
What is our 90-day retention by cohort? Compare customers acquired in different months to see if retention is improving or degrading.
What's the payback period by channel? CAC divided by average monthly gross profit per customer — you want this under 6 months.
Data stack at this stage: Add a lightweight data warehouse (BigQuery free tier covers most teams at this ARR). Connect your sources via a simple ETL (Airbyte's free tier works). Use Statspresso to ask cross-source questions in plain English — "Which HubSpot campaign produced customers with the highest 90-day LTV in Stripe?" — without writing SQL joins.
Stage 3: Scaling ($1M+ ARR)
At this stage, you have real data infrastructure needs: multiple data sources, more stakeholders asking questions, and enough volume that data quality becomes a first-class concern. Your first data hire (an Analytics Engineer, not a Data Scientist) should join between $1M and $3M ARR to build the clean models that power self-service analytics across the team.
Data stack at this stage: Full warehouse (BigQuery or Snowflake), dbt for data transformation, and Statspresso as the conversational layer so every team member — product, growth, finance — can ask their own questions without a ticket queue.
Stage | Key Metrics | Stack | First Data Hire |
|---|---|---|---|
Pre-PMF | Activation rate, qualitative churn signals | Stripe/Shopify + spreadsheet + Statspresso ad hoc | Not yet — founder handles it |
Post-PMF | Cohort retention, CAC payback, channel LTV | BigQuery free tier + simple ETL + Statspresso | Part-time analyst or Statspresso for self-serve |
Scaling | NRR, segment-level retention, predictive churn | Snowflake/BigQuery + dbt + Statspresso conversational layer | Analytics Engineer ($1–3M ARR) |
3 Common Data Strategy Mistakes Startups Make
Most data strategy failures aren't technical — they're strategic. These three mistakes slow down or derail more data efforts than any tool choice:
1. Tracking Everything Instead of One North Star
The most common early-stage mistake. You connect all your tools, see hundreds of metrics available, and start tracking most of them. Three months later you have seventeen dashboards and nobody knows which number matters.
The fix: pick one north star metric that captures the core value your product delivers, and make sure every team can answer "does what I'm building move that number?" Everything else is secondary. For a SaaS product, this is usually something like weekly active connected accounts (Activation × Retention as a single number). For e-commerce, it's often repeat purchase rate by cohort.
2. Building Dashboards Before Validating the Question
A dashboard is an answer to a question. If you haven't validated the question — if nobody is actually making decisions based on that number — the dashboard is theater. It looks impressive, it gets ignored.
Better approach: before building any dashboard, require that the metric has already changed a decision at least once. Ask the question in Statspresso first (plain English, no infrastructure). If the answer drives action, then it earns a permanent dashboard. If nobody changes behavior when they see it, archive it.
3. Waiting for the "Right Time" to Start
Many founders delay building any data strategy until they have funding, a data team, or more users. The problem: your first three months of data are the only ones you get. Early user behavior data — who activated, who churned, why — is irreplaceable. When you look back from $2M ARR and try to understand your original PMF signal, it'll be gone if you didn't capture it.
You don't need a full stack. A $49/month Statspresso subscription connected to your Stripe and product database gives you enough conversational analytics to answer real questions from day one — no data team, no warehouse, no SQL.
How to Build a Data-Driven Startup Culture

A great data strategy for startups isn't a dusty document. It's a culture you live every day. It’s the habit of asking "What does the data say?" before making a call. The goal is to move from having data to using data to get smarter and faster than your competition.
From Data Priesthood to Data Democracy
In too many companies, data is locked away with a "data priesthood." If you need an answer, you file a ticket and wait. For a startup, this model is a death sentence. The right approach is to democratize data access from day one. This simply means giving every team the tools to find their own answers. When anyone can quickly validate their ideas with numbers, the quality of your decisions goes through the roof.
Your First Data Hire Is Not a Data Scientist
Most startups mistakenly look for a "Data Scientist" first. Data Scientists are brilliant at building complex predictive models, but that’s rarely what you need at the beginning. Your most urgent problem isn't predicting the future; it's understanding what happened yesterday. Your first data hire should be a Data Analyst or an Analytics Engineer. Their job is to build the clean, reliable data foundation that makes self-service analytics possible. Of course, with a Conversational AI Data Analyst like Statspresso, you can put off that six-figure salary even longer.
Running Data-Informed Meetings
A data-driven culture truly comes to life in your meetings. Instead of debates that devolve into a battle of opinions, your team can pull up real numbers on the spot.
The Old Way (Opinion-Based) | The New Way (Data-Informed) |
|---|---|
"I think users are dropping off during onboarding." | "Let's ask Statspresso: 'Show me the user drop-off rate for each step of our onboarding flow.'" |
"Our latest campaign feels like it's working." | "Let's check: 'What was the customer acquisition cost for the Q3 campaign?'" |
"We should definitely build this new feature next." | "Hold on. 'What percentage of our paying customers have used Feature X in the last 30 days?'" |
This one change—asking questions of your data in real-time—creates a massive ripple effect. Statspresso is designed to be your partner in building this culture. It removes the technical barrier, making it effortless for anyone to bring data into any conversation. You can skip the SQL, just ask your data a question and get a chart back in seconds.
Ready to build a smarter, faster organization? Connect your first data source for free and ask your first question.
Frequently Asked Questions
As you start to think more seriously about data, questions naturally come up. Here are straightforward answers to the most common ones we get about building a data strategy for startups.
Do I Really Need a Data Warehouse as an Early-Stage Startup?
In short, yes—but don’t overcomplicate it. Think of a data warehouse like BigQuery or Snowflake as the central "single source of truth" for your company. It’s what stops the chaos of marketing and sales showing up with different numbers. Setting one up is far more affordable than most people realize. The cost is tiny compared to the price of making mistakes based on unreliable data.
What Is the Difference Between BI and Conversational AI?
Traditional Business Intelligence (BI) tools are built around static, pre-made dashboards. The minute you have a follow-up question that wasn't anticipated, you’re stuck. A Conversational AI Data Analyst like Statspresso flips that model. It’s all about self-serve analytics. You can ask complex questions in plain English—just like you would ask a colleague—and get an answer or a chart back instantly. This removes the data bottleneck.
Skip the SQL. Just ask your data a question and get a chart in seconds. That's the core difference. It’s the shift from waiting for reports to having a real-time conversation with your data.
How Much Does a Modern Data Stack Cost a Startup?
Probably a lot less than you think. A powerful, modern data stack is no longer a luxury for massive enterprises. Many of the best tools have generous free tiers or startup-friendly programs. You can stand up a surprisingly powerful and lean stack for just a few hundred dollars a month. That's a tiny fraction of the cost of hiring even one full-time data engineer. The key is to start small with tools that can grow with you.
Ready to stop wrestling with reports and start getting answers? With Statspresso, you can build a smarter, faster organization today. Connect your first data source for free and ask your first question.
You’ve got data. Loads of it. It’s streaming in from your Shopify store, your HubSpot CRM, and your own product database. So why does getting a straight answer to a simple question like, "What's our monthly recurring revenue?" feel like pulling teeth? Waiting weeks for a data analyst to build a dashboard is a relic of the past. For a modern startup, a data strategy isn't about hiring a small army of data scientists. It's about getting answers fast and empowering your team to find them on their own.
TL;DR: Key Takeaways
Align Data with Goals: Don't just collect data. Use a framework like Pirate Metrics (AARRR) to connect every metric you track to a real business outcome.
Build a Lean Stack: You only need three things: your data sources (like Stripe, HubSpot), a central data warehouse (like BigQuery), and an analytics layer. Keep it simple.
Embrace Conversational AI: The fastest way to get answers is to just ask. A Conversational AI Data Analyst like Statspresso lets anyone on your team ask questions in plain English. Skip the SQL. Just ask your data a question and get a chart in seconds.
Democratize Data: Your goal is to empower everyone—from marketing to product—to find their own answers. This builds a data-driven culture and breaks down information bottlenecks.
Start Now: You don't need a huge budget or a dedicated team to start. You can build a powerful data foundation and get your first insights today.
Why Your Startup Has a Data Problem, Not a Data Shortage
You're likely sitting on a mountain of valuable information, but you can’t get to it when it matters. The traditional approach—filing a ticket with engineering and waiting days for a new dashboard—is a drag on growth. By the time you get the report, the moment has passed. This frustrating cycle prevents your team from making the quick, data-informed decisions that define successful startups.
A smart data strategy turns this old process upside down. The goal is to empower everyone on your team to answer their own questions, without needing to write a single line of SQL or interrupt an engineer. It’s about transforming data chaos into your most powerful competitive edge.
The key insight is simple: modern tools eliminate the slow, ticket-based process, creating a direct path from a business question to a clear insight.
The Power of Conversational Analytics
This is where a Conversational AI Data Analyst like Statspresso changes the game. Instead of wrestling with complex tools or waiting for a report, your team can simply ask questions in plain English. Think of it as having a data analyst on call 24/7. Your product manager, your marketing lead, or even you can go from a messy spreadsheet to an actionable chart in just a few seconds.
Try asking Statspresso: "Compare our user signups this month to last month and show me the percentage change."
For a growing startup, this approach delivers three huge benefits:
Unlocks Speed: Get crucial answers in minutes, not weeks. Jump on opportunities and fix problems before they snowball.
Empowers Everyone: Your marketing lead can analyze campaign performance without learning Tableau. Your PM can track feature adoption without writing SQL.
Reduces Costs: Sidestep the high salary and lengthy hiring process for a dedicated data team in the early stages.
This guide is your no-fluff playbook for making this your new reality.
Aligning Your Data with Key Business Goals
Before you track anything, ask one simple question: "Why?" Without a clear answer tied to your business goals, your data strategy for startups is just an expensive hobby. You'll wind up with dashboards that look impressive but tell you nothing about what to do next. The point isn't to collect all the data; it's to collect the right data. Every metric you obsess over should directly connect to what moves the needle—acquiring customers, growing revenue, or making your product sticky.
Use Pirate Metrics as Your Treasure Map
A brilliant, no-fluff model for this is Dave McClure's "Pirate Metrics," or AARRR. It's a simple way to connect your business objectives to the numbers that prove you're heading in the right direction.
The framework carves the customer journey into five critical stages:
Acquisition: How are people discovering you?
Activation: Is their first experience compelling?
Retention: Are they coming back for more?
Referral: Are they telling their friends?
Revenue: Are they willing to pay?
This forces you to move from a vague goal like "achieve product-market fit" to a specific target like, "increase user retention by 15% in Q3." Suddenly, you have a clear metric your team can rally behind. This clarity turns your data from a passive report card into an active playbook.
Focus on Leading Indicators, Not Just Lagging Ones
It’s also critical to distinguish between leading and lagging indicators. I’ve seen countless startups make the mistake of only tracking lagging indicators—like driving by looking in the rearview mirror.
Indicator Type | Description | Example |
|---|---|---|
Lagging Indicator | An output metric that shows past results. Easy to measure, but too late to influence. |
|
Leading Indicator | An input metric that can predict future results. Harder to pin down, but you can actually change it. |
|
Your churn rate (lagging) tells you how many customers you’ve already lost. But tracking how many people use a specific feature (leading) can predict who might churn, giving you a chance to step in. A smart data strategy balances both. This is where a Conversational AI Data Analyst gives you an edge. Instead of waiting for a complex report, just ask.
Try asking Statspresso: "Show me the number of users who used our 'Project Template' feature for the first time last week."
By focusing on these actionable, leading metrics, your data conversations immediately shift from "what happened?" to "what should we do next?"
Building Your Lean Startup Data Stack
Your data strategy for startups shouldn't involve a ten-person engineering team or a budget that makes your investors sweat. The real goal is to build a lean, cost-effective data stack that gives you answers today but can easily grow with you tomorrow. For an early-stage company, it really just comes down to three core pieces.
The Three Essential Layers of a Startup Data Stack
Think of your data stack like a well-organized kitchen: ingredients, a prep counter, and tools for cooking.
Data Sources (The Ingredients): This is all the raw data your business generates. It’s in your product database (like Postgres or MySQL), your CRM (HubSpot), your payment system (Stripe), and your marketing tools (Google Analytics).
Central Warehouse (The Countertop): This is where you bring everything together—your single source of truth. A cloud data warehouse like Snowflake, Google BigQuery, or Amazon Redshift acts as your central prep station. Tools like Fivetran or Airbyte make it surprisingly simple to build data pipelines and get your data here.
Analytics Layer (The Tools): This is how you finally turn that prepped data into answers. It's the part of the stack your team interacts with to ask questions and get back charts, tables, and insights.
The magic happens when these three layers work together seamlessly.
Startup Analytics: The Old Way vs. The New Way
The difference between a traditional, manual approach and a modern, automated one is night and day. It’s the difference between waiting weeks for a report and getting an answer before you’ve finished your coffee.
Task | The Old Way (Manual SQL & Dashboards) | The New Way (With Statspresso) |
|---|---|---|
Get a new metric | File an engineering ticket. Wait for an analyst to write SQL, build a report, and add it to a dashboard. Timeline: 1-2 weeks. | Ask a question in plain English, like "What was our average revenue per user last month?" Timeline: ~10 seconds. |
Follow-up question | File another ticket. Wait for the analyst to modify the query. Timeline: 1-3 days. | Ask a follow-up question in the same chat, like "Now break that down by marketing channel." Timeline: ~5 seconds. |
Share an insight | Take a screenshot of a static dashboard, paste it in Slack, and add context. The data is instantly outdated. | Get a real-time chart, add it to a shared dashboard with one click, and send a link. The data always stays fresh. |
Who gets answers | Only people who know SQL or have access to a busy analyst. | Anyone on your team—from the CEO to the marketing intern. |
The new way isn't just about speed; it's about empowerment. It gives everyone on the team direct access to information, a core pillar of effective business intelligence for startups. Instead of a data gatekeeper, your team can explore on their own. This is where a Conversational AI Data Analyst like Statspresso becomes the most powerful part of your analytics layer. It’s built to help you skip the SQL and just get answers.
Try asking Statspresso: "Show me my top 5 customers by lifetime value as a table."
By connecting your data warehouse to a conversational analytics tool, you complete your lean data stack. You get the power of a full-fledged data team without the massive overhead.
How to Unify Your Disparate Data Sources
Alright, you’ve outlined your business goals and picked a lean data stack. Now comes the fun part: connecting all the pipes. This is the moment your data strategy for startups goes from a plan on paper to a living, breathing system. Your data is probably scattered across a dozen different SaaS tools. To find the game-changing insights, you have to get these systems talking to each other.
Start with Smart Event Tracking
The first step is to get a handle on user behavior through event tracking. You need one consistent method for tracking user actions across your website and app. A Customer Data Platform (CDP) like Segment can be a lifesaver. Instead of asking engineers to write custom tracking code for every new tool, you implement a single tracking library one time. From there, you just flip a switch to send that clean data to your warehouse and other tools. A unified data stream means you define an event like 'User Signed Up' just once, preventing data chaos.
Your Initial Event Tracking Checklist
Start small and focus on the events that have the highest impact. Don't try to track every click on day one.
Acquisition/Activation:
User Signed Up,Trial Started,Onboarding Step CompletedRetention:
Key Feature Used,Project Created,Team Member InvitedRevenue:
Plan Upgraded,Subscription Canceled,Payment Method Updated
This focused approach gives you a powerful signal right away without overwhelming your team.
The Superpower of a Single Source of Truth
Once your event data is flowing into your data warehouse alongside data from other tools, you’ve created a startup superpower: a single source of truth. Now, your Shopify sales data can sit next to your HubSpot marketing data and your PostgreSQL application data. This unified view lets you ask the complex, cross-functional questions that actually drive growth. This is exactly where a Conversational AI Data Analyst like Statspresso shines. You no longer need an expert to write complex SQL joins just to connect these tables. You can simply ask a question in plain English.
Try asking Statspresso: "Which marketing campaigns from HubSpot brought in customers with the highest lifetime value in Shopify?"
Suddenly, your head of marketing can see exactly which campaigns deliver profitable customers, not just signups. Your product manager can pinpoint which features convince users to upgrade. This is the real promise of a modern data strategy. As you think about bringing your data together, understanding Why Unified API is a Game Changer for SaaS Products can also give you a serious strategic edge.
Skip the SQL. Just ask your data a question and get a chart in seconds. This isn't some futuristic dream; it's what's possible for your startup today.
Getting Real Answers from Your Raw Data
Alright, you’ve done the hard work. Your data is flowing into a central warehouse. So, how do you actually get answers out of it? Especially when you don't have a data analyst on payroll yet? This is where a smart data strategy for startups really pays off. Let’s imagine your Product Manager, Sarah, just launched a new "Project Template" feature. She’s anxious to know if anyone is using it.
The Old Way: A Growth Killer
In a typical company, Sarah's next step is frustratingly slow. She'd file a ticket, try to describe the metric she needs, and then… wait. Days or weeks later, she might get a static chart. What if she has a follow-up question? The whole painful cycle starts again. This friction kills momentum.
The New Way: Instant Answers
With a modern data stack, Sarah's experience is completely different. She doesn't need to write a ticket or learn SQL. Instead, she can just ask her question directly to a Conversational AI Data Analyst like Statspresso. She types a simple question, just like she'd ask a colleague.
Try asking Statspresso: "Show me the daily active users for our new Project Template feature since last Tuesday."
Within seconds, a clear bar chart pops up. This creates a tight feedback loop. Sarah can now dig deeper in real time, asking follow-up questions without hitting a wall.
"Break this down by user signup date."
"Which user cohort has the highest adoption rate?"
"Compare this to the adoption of our last feature launch."
This is the whole point of conversational analytics: skip the SQL and just ask your data a question to get a chart in seconds. It empowers everyone on your team to find their own answers.
Garbage In, Garbage Out: The Data Quality Problem
Here's the catch: the most sophisticated analytics tool is worthless if it's running on bad data. If your numbers are a mess, your decisions will be, too. Period. Recent industry reports highlight this is a massive issue, with many organizations admitting their data quality is just average or poor. Research on data transformation statistics shows this is a top challenge. You can’t build a data-driven culture on untrustworthy numbers.
So, how do you keep your data clean?
Establish Clear Ownership: Make someone responsible for key data sources. The marketing lead owns the accuracy of HubSpot data. The Head of Product owns product event tracking.
Automate Validation: Use your tools to set up simple checks, like flagging any sale in Stripe that's missing a customer email.
Use Smart Tools: A modern platform like Statspresso can act as a watchdog, automatically flagging inconsistencies or weird outliers.
Making data quality a priority from day one ensures the answers you get are not just fast, but right.
Your Data Strategy by Startup Stage
The biggest mistake founders make is copying a data strategy from a company at a different stage. What works at $5M ARR is different from what you need at $500K — and both are different from what you should prioritize before product-market fit. Here's how to calibrate.
Stage 1: Pre-PMF ($0–$100K ARR)
Before product-market fit, most of your data questions are qualitative: Why did this customer churn? Why did this one stay? Spreadsheets and a weekly manual review are enough. The one quantitative metric worth obsessing over at this stage is your activation rate — the percentage of new signups who reach your product's "aha moment" within the first session.
Everything else is noise. Resist the urge to build dashboards. The risk at this stage is collecting data on the wrong thing and optimizing toward a local maximum that doesn't represent a real market.
Data stack at this stage: Your SaaS tools (Stripe, HubSpot, or Shopify) + a spreadsheet + Statspresso connected to your database for ad hoc queries. No warehouse needed yet.
Stage 2: Post-PMF ($100K–$1M ARR)
Once you have a signal that the product works, you need to scale what's working and cut what's not. This is when revenue metrics and cohort analysis become essential. The questions that matter:
Which acquisition channels produce customers who actually retain? Not just who converts — who stays.
What is our 90-day retention by cohort? Compare customers acquired in different months to see if retention is improving or degrading.
What's the payback period by channel? CAC divided by average monthly gross profit per customer — you want this under 6 months.
Data stack at this stage: Add a lightweight data warehouse (BigQuery free tier covers most teams at this ARR). Connect your sources via a simple ETL (Airbyte's free tier works). Use Statspresso to ask cross-source questions in plain English — "Which HubSpot campaign produced customers with the highest 90-day LTV in Stripe?" — without writing SQL joins.
Stage 3: Scaling ($1M+ ARR)
At this stage, you have real data infrastructure needs: multiple data sources, more stakeholders asking questions, and enough volume that data quality becomes a first-class concern. Your first data hire (an Analytics Engineer, not a Data Scientist) should join between $1M and $3M ARR to build the clean models that power self-service analytics across the team.
Data stack at this stage: Full warehouse (BigQuery or Snowflake), dbt for data transformation, and Statspresso as the conversational layer so every team member — product, growth, finance — can ask their own questions without a ticket queue.
Stage | Key Metrics | Stack | First Data Hire |
|---|---|---|---|
Pre-PMF | Activation rate, qualitative churn signals | Stripe/Shopify + spreadsheet + Statspresso ad hoc | Not yet — founder handles it |
Post-PMF | Cohort retention, CAC payback, channel LTV | BigQuery free tier + simple ETL + Statspresso | Part-time analyst or Statspresso for self-serve |
Scaling | NRR, segment-level retention, predictive churn | Snowflake/BigQuery + dbt + Statspresso conversational layer | Analytics Engineer ($1–3M ARR) |
3 Common Data Strategy Mistakes Startups Make
Most data strategy failures aren't technical — they're strategic. These three mistakes slow down or derail more data efforts than any tool choice:
1. Tracking Everything Instead of One North Star
The most common early-stage mistake. You connect all your tools, see hundreds of metrics available, and start tracking most of them. Three months later you have seventeen dashboards and nobody knows which number matters.
The fix: pick one north star metric that captures the core value your product delivers, and make sure every team can answer "does what I'm building move that number?" Everything else is secondary. For a SaaS product, this is usually something like weekly active connected accounts (Activation × Retention as a single number). For e-commerce, it's often repeat purchase rate by cohort.
2. Building Dashboards Before Validating the Question
A dashboard is an answer to a question. If you haven't validated the question — if nobody is actually making decisions based on that number — the dashboard is theater. It looks impressive, it gets ignored.
Better approach: before building any dashboard, require that the metric has already changed a decision at least once. Ask the question in Statspresso first (plain English, no infrastructure). If the answer drives action, then it earns a permanent dashboard. If nobody changes behavior when they see it, archive it.
3. Waiting for the "Right Time" to Start
Many founders delay building any data strategy until they have funding, a data team, or more users. The problem: your first three months of data are the only ones you get. Early user behavior data — who activated, who churned, why — is irreplaceable. When you look back from $2M ARR and try to understand your original PMF signal, it'll be gone if you didn't capture it.
You don't need a full stack. A $49/month Statspresso subscription connected to your Stripe and product database gives you enough conversational analytics to answer real questions from day one — no data team, no warehouse, no SQL.
How to Build a Data-Driven Startup Culture
A great data strategy for startups isn't a dusty document. It's a culture you live every day. It’s the habit of asking "What does the data say?" before making a call. The goal is to move from having data to using data to get smarter and faster than your competition.
From Data Priesthood to Data Democracy
In too many companies, data is locked away with a "data priesthood." If you need an answer, you file a ticket and wait. For a startup, this model is a death sentence. The right approach is to democratize data access from day one. This simply means giving every team the tools to find their own answers. When anyone can quickly validate their ideas with numbers, the quality of your decisions goes through the roof.
Your First Data Hire Is Not a Data Scientist
Most startups mistakenly look for a "Data Scientist" first. Data Scientists are brilliant at building complex predictive models, but that’s rarely what you need at the beginning. Your most urgent problem isn't predicting the future; it's understanding what happened yesterday. Your first data hire should be a Data Analyst or an Analytics Engineer. Their job is to build the clean, reliable data foundation that makes self-service analytics possible. Of course, with a Conversational AI Data Analyst like Statspresso, you can put off that six-figure salary even longer.
Running Data-Informed Meetings
A data-driven culture truly comes to life in your meetings. Instead of debates that devolve into a battle of opinions, your team can pull up real numbers on the spot.
The Old Way (Opinion-Based) | The New Way (Data-Informed) |
|---|---|
"I think users are dropping off during onboarding." | "Let's ask Statspresso: 'Show me the user drop-off rate for each step of our onboarding flow.'" |
"Our latest campaign feels like it's working." | "Let's check: 'What was the customer acquisition cost for the Q3 campaign?'" |
"We should definitely build this new feature next." | "Hold on. 'What percentage of our paying customers have used Feature X in the last 30 days?'" |
This one change—asking questions of your data in real-time—creates a massive ripple effect. Statspresso is designed to be your partner in building this culture. It removes the technical barrier, making it effortless for anyone to bring data into any conversation. You can skip the SQL, just ask your data a question and get a chart back in seconds.
Ready to build a smarter, faster organization? Connect your first data source for free and ask your first question.
Frequently Asked Questions
As you start to think more seriously about data, questions naturally come up. Here are straightforward answers to the most common ones we get about building a data strategy for startups.
Do I Really Need a Data Warehouse as an Early-Stage Startup?
In short, yes—but don’t overcomplicate it. Think of a data warehouse like BigQuery or Snowflake as the central "single source of truth" for your company. It’s what stops the chaos of marketing and sales showing up with different numbers. Setting one up is far more affordable than most people realize. The cost is tiny compared to the price of making mistakes based on unreliable data.
What Is the Difference Between BI and Conversational AI?
Traditional Business Intelligence (BI) tools are built around static, pre-made dashboards. The minute you have a follow-up question that wasn't anticipated, you’re stuck. A Conversational AI Data Analyst like Statspresso flips that model. It’s all about self-serve analytics. You can ask complex questions in plain English—just like you would ask a colleague—and get an answer or a chart back instantly. This removes the data bottleneck.
Skip the SQL. Just ask your data a question and get a chart in seconds. That's the core difference. It’s the shift from waiting for reports to having a real-time conversation with your data.
How Much Does a Modern Data Stack Cost a Startup?
Probably a lot less than you think. A powerful, modern data stack is no longer a luxury for massive enterprises. Many of the best tools have generous free tiers or startup-friendly programs. You can stand up a surprisingly powerful and lean stack for just a few hundred dollars a month. That's a tiny fraction of the cost of hiring even one full-time data engineer. The key is to start small with tools that can grow with you.
Ready to stop wrestling with reports and start getting answers? With Statspresso, you can build a smarter, faster organization today. Connect your first data source for free and ask your first question.