Business Intelligence for Startups: A 2026 Guide

You have data. Tons of it. In your database, your CRM, your payment processor. But getting a simple answer feels impossible. Waiting weeks for a data analyst to build a dashboard is a relic of the past. For a startup, that’s a death sentence. Business intelligence for startups isn't a luxury; it's your survival kit. It's how you find product-market fit, spend money wisely, and outpace the competition before the cash runs out.
TL;DR: Your Guide to Startup BI
The Problem: Waiting for data analysts to write SQL is too slow. This kills momentum and decision-making speed.
The Solution: Modern BI is conversational. Anyone on your team should be able to ask data a question and get a chart in seconds.
The Stack: Keep it simple. Start with your core data sources (Postgres, HubSpot, Stripe) and connect them to a conversational AI layer like Statspresso.
The Metrics: Focus on what matters. Track user engagement (DAU, retention), marketing efficiency (LTV:CAC ratio), and financial health (MRR, runway).
The Action: Stop waiting. Connect your data and ask your first question today.
Why BI Is No Longer a Big Company Luxury
In the startup world, speed wins. It’s that simple. Yet, many founders are stuck. Valuable data sits in your Postgres database, your HubSpot account, and your Stripe dashboard, but getting a straight answer is a nightmare.
You file a ticket. You wait. Days—or even weeks—later, an analyst finds time to write a SQL query. By then, the moment is gone. This isn't just an inconvenience; it’s a massive competitive disadvantage. That static report you get is a snapshot of the past, not a guide for your next move.
The Shift from Dashboards to Conversations
Old-school BI revolved around complicated dashboards and the few technical people who could build them. That world is dead. Today, modern BI is about instant access and speed. It’s about giving everyone on your team—from marketing to product to sales—the power to answer their own questions with data.
This new approach is driven by conversational analytics. Imagine just asking a question in plain English, like you would a colleague, and getting a clear chart back in seconds. That's the new standard. And it’s powered by a Conversational AI Data Analyst like Statspresso.
"The reality of startup life is that you're in a race to achieve product/market fit before you run out of money. Nothing else much matters." - Marty Cagan, Author of Inspired
You can't win that race flying blind, waiting for someone else to pull a report. Constant, rapid course correction is the only way forward.
From Manual SQL to Instant Answers
Let’s be blunt: the traditional BI process is a bottleneck. It forces your most critical business questions into a slow-moving queue, killing momentum. It’s time for a new way.
The Old Way (Manual SQL) | The New Way (Statspresso) |
|---|---|
File a data request ticket. | Ask a question in plain English. |
Wait in an analyst's queue for days. | Get a chart or number in seconds. |
Receive a static, outdated report. | Receive a real-time, interactive answer. |
Need a follow-up? Start over. | Ask a follow-up question instantly. |
This is more than just saving time. It’s about building a culture of curiosity. When anyone can explore data without friction, you uncover insights that were previously buried. That's the edge you need to iterate faster and spend your limited resources with confidence. You skip the SQL. Just ask your data a question and get a chart in seconds.
Try asking Statspresso: "Show me our user signups by week for the last 3 months as a line chart."
Building Your First Startup BI Stack
The term "data stack" probably conjures images of server rooms, a team of engineers, and a painful budget. I get it. For a long time, that was true. But for a startup today, that model is obsolete. Your first business intelligence stack can be lean, cheap, and surprisingly simple to set up.
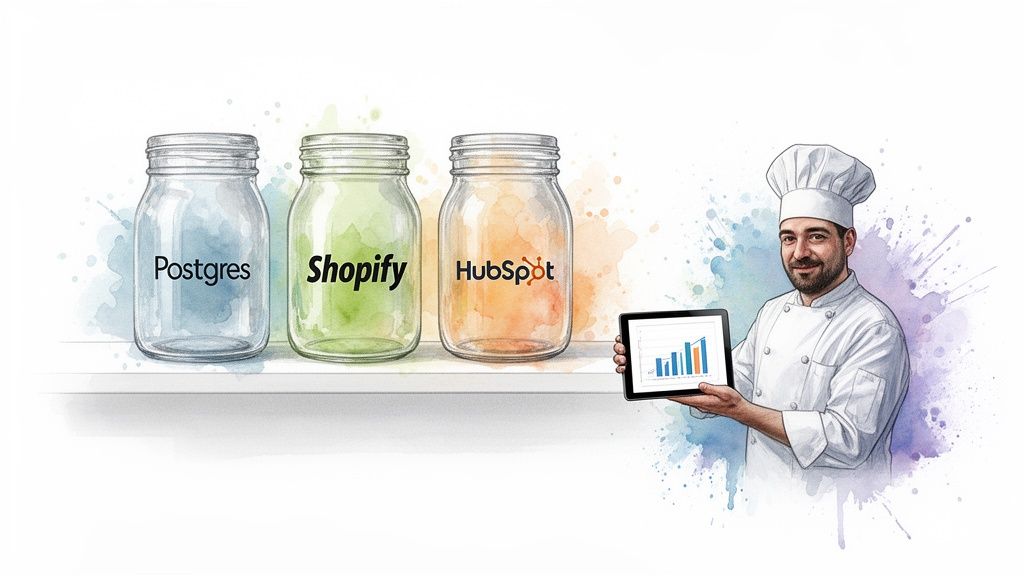
Think of it like setting up a kitchen. You don't need a Michelin-star setup to start cooking. You just need the essentials. Let's walk through the three core components.
Step 1: Your Raw Ingredients (Data Sources)
Every great meal starts with raw ingredients. In BI, your ingredients are your data sources—the tools you already use every day. This isn't about collecting more data; it's about using what you have.
Product & User Data: Your main database, likely Postgres or MySQL, is a goldmine. It holds critical info on user signups, in-app actions, and feature engagement.
Marketing & Sales Data: Tools like HubSpot or Google Analytics track the entire customer journey, from first ad click to closed deal.
Financial Data: Platforms like Stripe or Shopify are the source of truth for revenue, subscriptions, and transactions.
Keep it simple. Identify your top 3-5 most critical sources of truth. Don't try to connect everything at once. Focus on where the most important answers live.
Step 2: The Organized Pantry (Data Warehouse)
Once you have ingredients, you need an organized pantry. A data warehouse is just that: a central spot to store all your data from different sources in one clean place.
Why is this important? Because it lets you connect the dots. You can't calculate Customer Acquisition Cost (CAC) vs. Lifetime Value (LTV) if your ad spend data from Google and your subscription data from Stripe never meet. A warehouse brings them together.
Startups often try to skip this, but modern cloud platforms like Snowflake, BigQuery, or Redshift have made it incredibly accessible. They do the heavy lifting, centralizing your data without a massive upfront cost.
This organized pantry is what a Conversational AI Data Analyst like Statspresso connects to, providing a single, reliable source for the AI to work its magic.
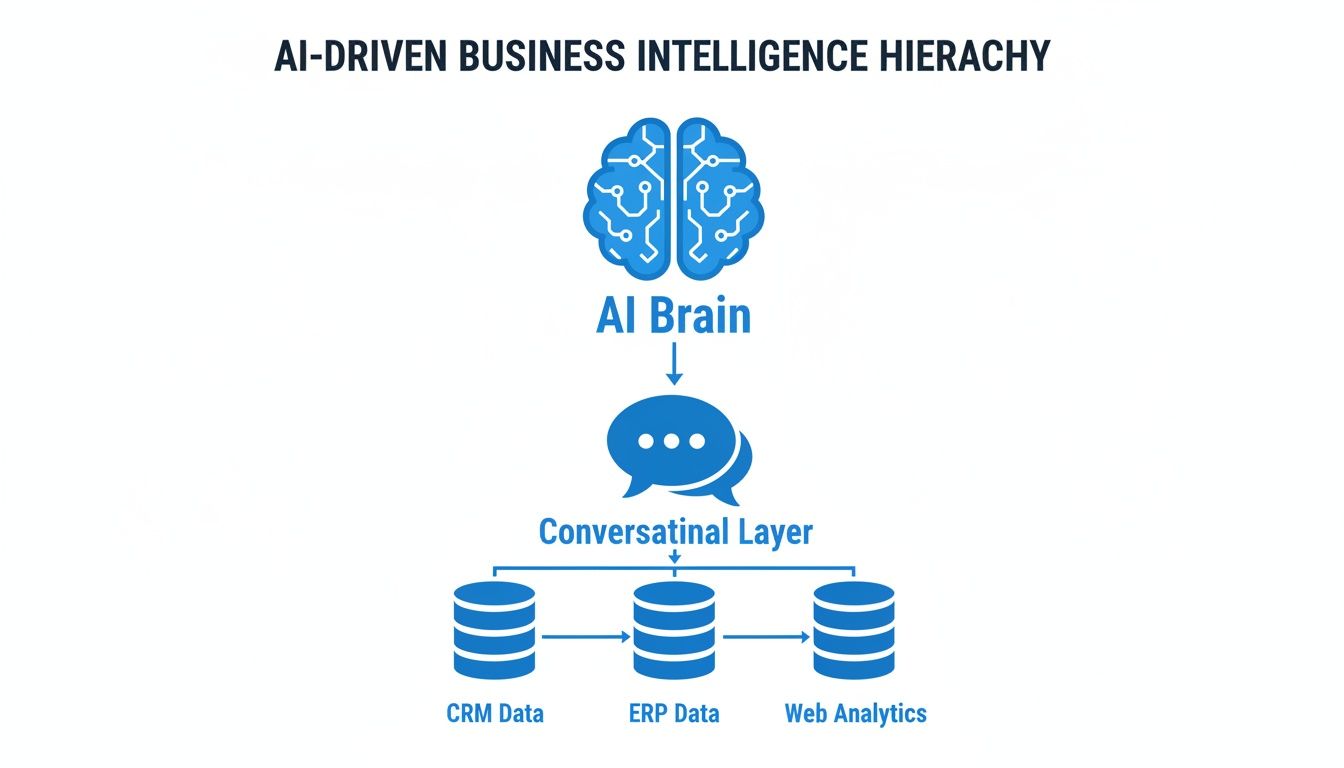
The conversational layer sits right on top of your organized data. This removes the complex tools between you and your answers.
Step 3: The AI Chef (The BI Layer)
You've got ingredients and an organized pantry. Now you need a chef. The business intelligence (BI) layer is where the magic happens—it’s the tool that visualizes your data and serves up insights.
Traditionally, this "chef" was a human analyst writing complex SQL or wrestling with clunky dashboards. For a startup, this is a huge bottleneck.
The modern chef is an AI. A tool like Statspresso sits directly on top of your data and lets anyone—from the CEO to a marketing manager—simply ask questions. You skip the SQL. You just ask your data a question and get a chart back in seconds.
This final layer is what makes data accessible to everyone. It transforms your data from a static resource into an interactive, conversational partner for your entire team.
Try asking Statspresso: "Combine my HubSpot and Stripe data to show me LTV to CAC ratio by marketing channel last quarter."
The Only Metrics That Really Matter for a Startup
Hard truth: if you track everything, you understand nothing. A classic startup mistake is getting buried under vanity metrics. The whole point of business intelligence for startups isn't to measure every click; it’s about identifying the handful of numbers that signal real, sustainable growth.
Let's cut to it. These are the essential metrics your teams should live and breathe. I’ll also show you how a Conversational AI Data Analyst like Statspresso puts these numbers at your fingertips. No SQL, no waiting. Just ask.
Metrics for Your Product Team
Your product team is hunting for product-market fit. Their world revolves around understanding what users love, what they ignore, and if they're coming back.
Daily Active Users (DAU): This is your product's heartbeat. A steady increase means people are building a habit around what you've built.
Feature Adoption Rate: You just shipped a new feature. Is anyone using it? This metric separates the hits from the misses.
User Retention Cohorts: This is the ultimate test of stickiness. It groups users by when they signed up and tracks what percentage are still active over time. Strong retention is the bedrock of a healthy business.
Getting these insights shouldn't require an analyst as a gatekeeper. Your Product Manager can just ask.
Try asking Statspresso: “Show me our user retention by weekly cohort for users who signed up in the last 6 months.”
Metrics for Your Marketing Team
Your marketing team drives growth, but growth-at-all-costs sinks startups. They need to know which channels work, how much it costs to get a customer, and if those customers are profitable.
Customer Acquisition Cost (CAC): How much does it cost to get one new paying customer? If you don't know your CAC, you're not marketing—you're just burning cash.
Customer Lifetime Value (LTV): The total revenue you can expect from a single customer over their entire relationship with you.
LTV to CAC Ratio: This is the magic number. A healthy business needs an LTV significantly higher than its CAC. Aim for 3:1 or greater. This single ratio tells you if your business model works.
In the past, figuring this out meant wrestling with spreadsheets. Now, it’s just a question.
Try asking Statspresso: “What was our LTV to CAC ratio by marketing channel last quarter? Show it as a bar chart.”
Metrics for Founders and Leadership
As a founder, you’re at the helm. You need a high-level, real-time view of the company’s financial health to make the big calls on hiring, fundraising, and spending.
Monthly Recurring Revenue (MRR): For any subscription business, MRR is your North Star. Its growth rate is a primary signal of your startup's momentum.
Burn Rate: How quickly your company is losing money. It’s calculated by subtracting monthly revenue from total monthly expenses.
Runway: How many months you have until the bank account hits zero. This is the ultimate reality check that dictates your fundraising timeline.
You shouldn't have to wait for your finance team to close the books to know your runway.
Try asking Statspresso: “What is our current cash runway based on last month's net burn rate?”
The Old Way vs. The New Way of Startup Analytics
For too long, getting an answer from your data was painful. You’d file a ticket, explain what you need, an analyst would write some SQL, and a week later, you’d get a chart that wasn't quite right. The whole cycle would start over.
This is the old way of analytics. For a startup that needs to move at lightning speed, it’s a crippling bottleneck.
That slow, frustrating loop is a relic. Waiting days for data is a death sentence when your market can pivot overnight. The friction of the old process punishes curiosity. Who will ask a follow-up if it means another three-day wait? This delay crushes your decision velocity—the speed at which your team can learn and make a change.
The Problem with Traditional BI
Traditional business intelligence was built around a centralized, gatekeeper model. Data was locked away, accessible only to a select few with specialized skills. For everyone else, data was something you requested, not something you could explore yourself.
This model creates massive problems for a startup:
It Kills Momentum: Your PM has an idea and needs data now, not next Thursday.
It Stifles Curiosity: If every question has a high "cost" in time, your team will stop asking.
It Creates Dependency: Your team's ability to make smart decisions becomes hostage to the bandwidth of one or two people.
A Radically Better Approach
Modern business intelligence for startups flips this model on its head. The goal isn't to build a few perfect, static dashboards. The real goal is to give everyone access to answers, instantly.
This is where a Conversational AI Data Analyst like Statspresso completely changes the game. Instead of a clunky, multi-step process, you have a single step: just ask a question.
It's a fundamental shift in how your team interacts with data.
Startup Analytics: The Old Way vs. The New Way
Metric | The Old Way (Manual SQL & Dashboards) | The New Way (Statspresso's Conversational AI) |
|---|---|---|
Time to Answer | Days or weeks | Seconds |
Who Gets Answers? | Only technical users or data analysts | Anyone on your team (product, marketing, sales) |
Process | File a ticket, wait in a queue, get a static report | Ask a direct question, get an interactive chart |
Follow-Up | Submit a new ticket and start the process again | Ask a follow-up question in the same chat |
The difference is stark. One path is a dead-end street of delays, while the other is an open highway for exploration and rapid insights.
This is the core shift: your team moves from being passive consumers of outdated reports to active explorers of real-time data. That freedom is what uncovers the most valuable insights—the ones you didn’t even know you were looking for.
Try asking Statspresso: "Show me user signups by week for the last 6 months."
Get Your Startup's BI Running in One Week
Implementing business intelligence for startups doesn't have to be a massive, multi-quarter project. You can skip the six-month plan and expensive consultants. With a modern approach, you can go from zero to data-driven in about a week.
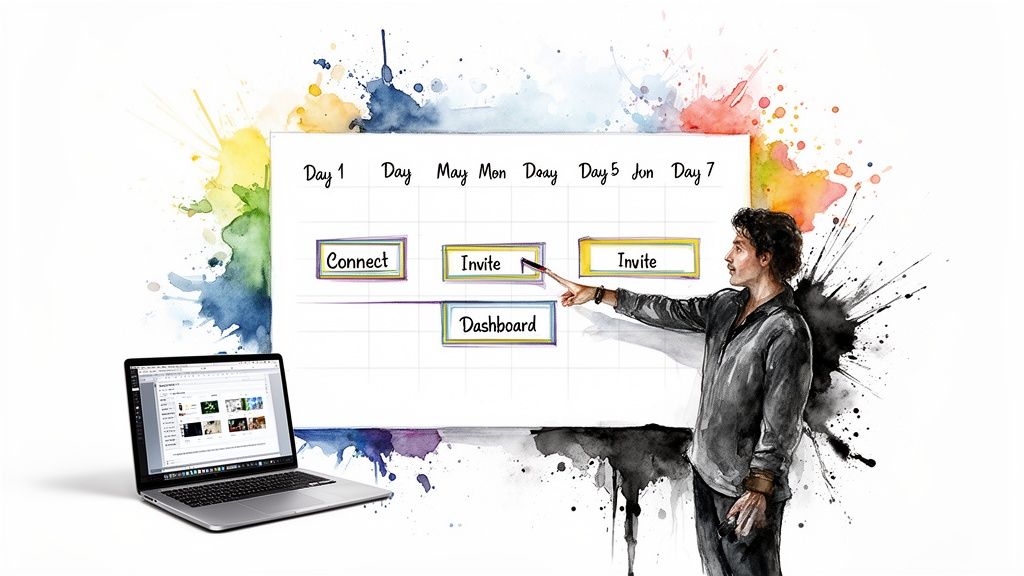
The trick is to think like a startup: start small, move fast, and chase immediate value. Don't try to boil the ocean. Here’s a practical, seven-day roadmap.
Days 1-2: Connect Your Core Data
First, where does your most important data live? For most startups, it's a small handful of platforms.
Don't overcomplicate it. Your only goal is to connect the 2-3 most critical sources of truth. These are usually:
Your production database: Where your core product data lives (Postgres or MySQL).
Your CRM or marketing platform: HubSpot or Salesforce for customer interactions.
Using a Conversational AI Data Analyst like Statspresso means this isn't a major engineering lift. You just authenticate your accounts, and the platform handles the rest. By day two, your ingredients are in the kitchen.
Days 3-4: Find Your North Star
With your data connected, it's time to focus. It's tempting to ask a million random questions, but that's a recipe for getting lost. Instead, decide what really matters right now.
Pick one “North Star” metric—the single number that best captures the core value your customers get. Is it Daily Active Users? Weekly Recurring Revenue? Just pick one.
Then, identify 3-5 supporting Key Performance Indicators (KPIs) that directly influence that North Star. If your North Star is retention, your KPIs might be feature adoption and time-to-first-value. Write them down. This isn't about building a giant dashboard; it's about giving the team a clear target.
Day 5: Invite the Team and Ask Away
Now, it gets fun. Get your product, marketing, and leadership teams into the tool. Forget a boring lecture. Just show them how easy it is to get an answer to a real question.
Spark curiosity with examples. Show them they can skip the SQL and just ask the data a question in plain English.
Try asking Statspresso: "Which landing pages have the highest conversion rates this month?"
This step is about building momentum. The moment a non-technical teammate asks their own question and gets a real chart back in seconds, the value of self-serve analytics clicks.
Days 6-7: Build Your First Dashboard
Your first dashboard shouldn't be a monolith. Think of it as a living document that answers the most important questions from day four.
As your team asks questions about your KPIs, simply save the most useful charts. A tool like Statspresso lets you add a chart directly from a conversation to a dashboard with one click. By week's end, you’ll have a focused dashboard showing your North Star and its supporting metrics in real-time.
This agile process delivers immediate value. The global BI market is projected to hit $72.21 billion by 2034, with small and medium-sized enterprises driving the fastest growth. Cloud-based tools are leading, with a dominant 50.55% market share expected in 2026, making it easier than ever for startups to get in the game. This rapid adoption of self-serve business intelligence is how nimble companies win.
Common BI Pitfalls Startups Should Avoid
It's easy to buy a BI tool. It's much harder to build a culture that actually uses it. Far too many startups nail the first part, only to watch their expensive platform gather digital dust. They fall into a few common, avoidable traps.
Getting value from business intelligence for startups isn't about the tech; it's about the habits you build around your data.
The "Boil the Ocean" Mistake
The urge to measure everything right away is powerful. It feels productive. But this instinct, “boiling the ocean,” is a classic mistake. When you track hundreds of metrics, the signals that matter get lost in the noise. Your team gets stuck in analysis paralysis—drowning in data but desperate for insight.
Be ruthless about focus. Pinpoint your North Star metric and the handful of KPIs that influence it. Everything else is a distraction.
Choosing Overly Complex Tools
Another common pitfall is falling for a BI tool built for a Fortune 500 company. They're powerful, but they often require a dedicated team of specialists just to keep them running. This recreates the exact data gatekeeper problem you were trying to eliminate.
If your product manager needs a training course to filter a report, you picked the wrong tool. The right platform should feel as easy as sending a message. A tool like Statspresso, a Conversational AI Data Analyst, was built for this. You skip the SQL, ask your data a question, and get a chart back in seconds. That low barrier to entry ensures the tool actually gets used.
Ignoring Data Governance
I know, "data governance" sounds like a boring, corporate buzzword. But ignoring it is the fastest way to kill your entire data strategy. When you have poor data governance—no clear definitions, no ownership—you erode the most critical asset you have: trust.
If marketing says you got 100 new users and product says 85, which is right? When people stop trusting the data, they stop using it. You’re back to making decisions on gut feelings, and your BI investment is a write-off.
This isn't hypothetical. One $400M firm torched $2.1M on an AI-BI tool that cratered with a dismal 11% adoption rate due to poor governance. Once they fixed the data trust issues, adoption skyrocketed to 78% in 90 days, unlocking $4.7M in gains. You can dive deeper into these trends at SR Analytics.
A tool like Statspresso helps rebuild trust by providing transparent, source-grounded answers. Every chart can be traced back to its origin, rebuilding confidence one query at a time. The best BI tool doesn’t just spit out answers; it makes people curious and helps build a culture guided by numbers they can actually believe in.
Try asking Statspresso: "What is the definition of an 'Active User' in our database?"
Got Questions About BI? Let's Get Them Answered.
It's smart to ask questions. It means you're thinking strategically. Here are straightforward answers to the questions I hear most often from founders about getting started with business intelligence.
Do I Really Need a Data Warehouse Right Away?
Honestly, probably not. While a data warehouse is powerful for large-scale operations, modern tools have changed the entry point for BI. You don't have to build a massive, expensive foundation just to start.
An AI analytics assistant like Statspresso can plug directly into your production databases (like Postgres) or the apps you already use (like HubSpot). A warehouse becomes essential later, when you're blending dozens of data sources for more complex recipes.
What’s a BI Tool Going to Cost My Startup?
The price range is massive, so be careful. Traditional BI platforms were built for enterprises with deep pockets. They're often a terrible fit for a lean startup.
The good news is that a new generation of tools has emerged specifically for startups. Look for platforms with generous free tiers or flexible, usage-based pricing that grows with you. This way, your analytics costs stay in sync with your revenue.
How Can I Get My Non-Technical Team to Actually Use This?
This is the million-dollar question. The secret? Make it ridiculously easy. If your team needs a week of training to pull a simple report, they won't use it. You've already failed.
Find a tool with virtually no learning curve. With a platform like Statspresso, a Conversational AI Data Analyst, the barrier is gone—if you can type a question, you can get an answer. Show a few quick wins to motivated team members. When your marketing manager sees campaign ROI in 10 seconds without asking an engineer, others will want in on the action.
This user-friendly approach is why AI in BI is exploding. Adoption is climbing from 45% at the seed stage to 68% at Series A. Startups that prioritize good data governance see 4.2x higher adoption and real results. Dive deeper into the statistics of AI in startups to see how fast this is moving.
Ready to stop guessing and start knowing? Statspresso is your team's on-demand Conversational AI Data Analyst, giving everyone the power to make smarter decisions. Connect your first data source for free and ask your first question.
You have data. Tons of it. In your database, your CRM, your payment processor. But getting a simple answer feels impossible. Waiting weeks for a data analyst to build a dashboard is a relic of the past. For a startup, that’s a death sentence. Business intelligence for startups isn't a luxury; it's your survival kit. It's how you find product-market fit, spend money wisely, and outpace the competition before the cash runs out.
TL;DR: Your Guide to Startup BI
The Problem: Waiting for data analysts to write SQL is too slow. This kills momentum and decision-making speed.
The Solution: Modern BI is conversational. Anyone on your team should be able to ask data a question and get a chart in seconds.
The Stack: Keep it simple. Start with your core data sources (Postgres, HubSpot, Stripe) and connect them to a conversational AI layer like Statspresso.
The Metrics: Focus on what matters. Track user engagement (DAU, retention), marketing efficiency (LTV:CAC ratio), and financial health (MRR, runway).
The Action: Stop waiting. Connect your data and ask your first question today.
Why BI Is No Longer a Big Company Luxury
In the startup world, speed wins. It’s that simple. Yet, many founders are stuck. Valuable data sits in your Postgres database, your HubSpot account, and your Stripe dashboard, but getting a straight answer is a nightmare.
You file a ticket. You wait. Days—or even weeks—later, an analyst finds time to write a SQL query. By then, the moment is gone. This isn't just an inconvenience; it’s a massive competitive disadvantage. That static report you get is a snapshot of the past, not a guide for your next move.
The Shift from Dashboards to Conversations
Old-school BI revolved around complicated dashboards and the few technical people who could build them. That world is dead. Today, modern BI is about instant access and speed. It’s about giving everyone on your team—from marketing to product to sales—the power to answer their own questions with data.
This new approach is driven by conversational analytics. Imagine just asking a question in plain English, like you would a colleague, and getting a clear chart back in seconds. That's the new standard. And it’s powered by a Conversational AI Data Analyst like Statspresso.
"The reality of startup life is that you're in a race to achieve product/market fit before you run out of money. Nothing else much matters." - Marty Cagan, Author of Inspired
You can't win that race flying blind, waiting for someone else to pull a report. Constant, rapid course correction is the only way forward.
From Manual SQL to Instant Answers
Let’s be blunt: the traditional BI process is a bottleneck. It forces your most critical business questions into a slow-moving queue, killing momentum. It’s time for a new way.
The Old Way (Manual SQL) | The New Way (Statspresso) |
|---|---|
File a data request ticket. | Ask a question in plain English. |
Wait in an analyst's queue for days. | Get a chart or number in seconds. |
Receive a static, outdated report. | Receive a real-time, interactive answer. |
Need a follow-up? Start over. | Ask a follow-up question instantly. |
This is more than just saving time. It’s about building a culture of curiosity. When anyone can explore data without friction, you uncover insights that were previously buried. That's the edge you need to iterate faster and spend your limited resources with confidence. You skip the SQL. Just ask your data a question and get a chart in seconds.
Try asking Statspresso: "Show me our user signups by week for the last 3 months as a line chart."
Building Your First Startup BI Stack
The term "data stack" probably conjures images of server rooms, a team of engineers, and a painful budget. I get it. For a long time, that was true. But for a startup today, that model is obsolete. Your first business intelligence stack can be lean, cheap, and surprisingly simple to set up.
Think of it like setting up a kitchen. You don't need a Michelin-star setup to start cooking. You just need the essentials. Let's walk through the three core components.
Step 1: Your Raw Ingredients (Data Sources)
Every great meal starts with raw ingredients. In BI, your ingredients are your data sources—the tools you already use every day. This isn't about collecting more data; it's about using what you have.
Product & User Data: Your main database, likely Postgres or MySQL, is a goldmine. It holds critical info on user signups, in-app actions, and feature engagement.
Marketing & Sales Data: Tools like HubSpot or Google Analytics track the entire customer journey, from first ad click to closed deal.
Financial Data: Platforms like Stripe or Shopify are the source of truth for revenue, subscriptions, and transactions.
Keep it simple. Identify your top 3-5 most critical sources of truth. Don't try to connect everything at once. Focus on where the most important answers live.
Step 2: The Organized Pantry (Data Warehouse)
Once you have ingredients, you need an organized pantry. A data warehouse is just that: a central spot to store all your data from different sources in one clean place.
Why is this important? Because it lets you connect the dots. You can't calculate Customer Acquisition Cost (CAC) vs. Lifetime Value (LTV) if your ad spend data from Google and your subscription data from Stripe never meet. A warehouse brings them together.
Startups often try to skip this, but modern cloud platforms like Snowflake, BigQuery, or Redshift have made it incredibly accessible. They do the heavy lifting, centralizing your data without a massive upfront cost.
This organized pantry is what a Conversational AI Data Analyst like Statspresso connects to, providing a single, reliable source for the AI to work its magic.
The conversational layer sits right on top of your organized data. This removes the complex tools between you and your answers.
Step 3: The AI Chef (The BI Layer)
You've got ingredients and an organized pantry. Now you need a chef. The business intelligence (BI) layer is where the magic happens—it’s the tool that visualizes your data and serves up insights.
Traditionally, this "chef" was a human analyst writing complex SQL or wrestling with clunky dashboards. For a startup, this is a huge bottleneck.
The modern chef is an AI. A tool like Statspresso sits directly on top of your data and lets anyone—from the CEO to a marketing manager—simply ask questions. You skip the SQL. You just ask your data a question and get a chart back in seconds.
This final layer is what makes data accessible to everyone. It transforms your data from a static resource into an interactive, conversational partner for your entire team.
Try asking Statspresso: "Combine my HubSpot and Stripe data to show me LTV to CAC ratio by marketing channel last quarter."
The Only Metrics That Really Matter for a Startup
Hard truth: if you track everything, you understand nothing. A classic startup mistake is getting buried under vanity metrics. The whole point of business intelligence for startups isn't to measure every click; it’s about identifying the handful of numbers that signal real, sustainable growth.
Let's cut to it. These are the essential metrics your teams should live and breathe. I’ll also show you how a Conversational AI Data Analyst like Statspresso puts these numbers at your fingertips. No SQL, no waiting. Just ask.
Metrics for Your Product Team
Your product team is hunting for product-market fit. Their world revolves around understanding what users love, what they ignore, and if they're coming back.
Daily Active Users (DAU): This is your product's heartbeat. A steady increase means people are building a habit around what you've built.
Feature Adoption Rate: You just shipped a new feature. Is anyone using it? This metric separates the hits from the misses.
User Retention Cohorts: This is the ultimate test of stickiness. It groups users by when they signed up and tracks what percentage are still active over time. Strong retention is the bedrock of a healthy business.
Getting these insights shouldn't require an analyst as a gatekeeper. Your Product Manager can just ask.
Try asking Statspresso: “Show me our user retention by weekly cohort for users who signed up in the last 6 months.”
Metrics for Your Marketing Team
Your marketing team drives growth, but growth-at-all-costs sinks startups. They need to know which channels work, how much it costs to get a customer, and if those customers are profitable.
Customer Acquisition Cost (CAC): How much does it cost to get one new paying customer? If you don't know your CAC, you're not marketing—you're just burning cash.
Customer Lifetime Value (LTV): The total revenue you can expect from a single customer over their entire relationship with you.
LTV to CAC Ratio: This is the magic number. A healthy business needs an LTV significantly higher than its CAC. Aim for 3:1 or greater. This single ratio tells you if your business model works.
In the past, figuring this out meant wrestling with spreadsheets. Now, it’s just a question.
Try asking Statspresso: “What was our LTV to CAC ratio by marketing channel last quarter? Show it as a bar chart.”
Metrics for Founders and Leadership
As a founder, you’re at the helm. You need a high-level, real-time view of the company’s financial health to make the big calls on hiring, fundraising, and spending.
Monthly Recurring Revenue (MRR): For any subscription business, MRR is your North Star. Its growth rate is a primary signal of your startup's momentum.
Burn Rate: How quickly your company is losing money. It’s calculated by subtracting monthly revenue from total monthly expenses.
Runway: How many months you have until the bank account hits zero. This is the ultimate reality check that dictates your fundraising timeline.
You shouldn't have to wait for your finance team to close the books to know your runway.
Try asking Statspresso: “What is our current cash runway based on last month's net burn rate?”
The Old Way vs. The New Way of Startup Analytics
For too long, getting an answer from your data was painful. You’d file a ticket, explain what you need, an analyst would write some SQL, and a week later, you’d get a chart that wasn't quite right. The whole cycle would start over.
This is the old way of analytics. For a startup that needs to move at lightning speed, it’s a crippling bottleneck.
That slow, frustrating loop is a relic. Waiting days for data is a death sentence when your market can pivot overnight. The friction of the old process punishes curiosity. Who will ask a follow-up if it means another three-day wait? This delay crushes your decision velocity—the speed at which your team can learn and make a change.
The Problem with Traditional BI
Traditional business intelligence was built around a centralized, gatekeeper model. Data was locked away, accessible only to a select few with specialized skills. For everyone else, data was something you requested, not something you could explore yourself.
This model creates massive problems for a startup:
It Kills Momentum: Your PM has an idea and needs data now, not next Thursday.
It Stifles Curiosity: If every question has a high "cost" in time, your team will stop asking.
It Creates Dependency: Your team's ability to make smart decisions becomes hostage to the bandwidth of one or two people.
A Radically Better Approach
Modern business intelligence for startups flips this model on its head. The goal isn't to build a few perfect, static dashboards. The real goal is to give everyone access to answers, instantly.
This is where a Conversational AI Data Analyst like Statspresso completely changes the game. Instead of a clunky, multi-step process, you have a single step: just ask a question.
It's a fundamental shift in how your team interacts with data.
Startup Analytics: The Old Way vs. The New Way
Metric | The Old Way (Manual SQL & Dashboards) | The New Way (Statspresso's Conversational AI) |
|---|---|---|
Time to Answer | Days or weeks | Seconds |
Who Gets Answers? | Only technical users or data analysts | Anyone on your team (product, marketing, sales) |
Process | File a ticket, wait in a queue, get a static report | Ask a direct question, get an interactive chart |
Follow-Up | Submit a new ticket and start the process again | Ask a follow-up question in the same chat |
The difference is stark. One path is a dead-end street of delays, while the other is an open highway for exploration and rapid insights.
This is the core shift: your team moves from being passive consumers of outdated reports to active explorers of real-time data. That freedom is what uncovers the most valuable insights—the ones you didn’t even know you were looking for.
Try asking Statspresso: "Show me user signups by week for the last 6 months."
Get Your Startup's BI Running in One Week
Implementing business intelligence for startups doesn't have to be a massive, multi-quarter project. You can skip the six-month plan and expensive consultants. With a modern approach, you can go from zero to data-driven in about a week.
The trick is to think like a startup: start small, move fast, and chase immediate value. Don't try to boil the ocean. Here’s a practical, seven-day roadmap.
Days 1-2: Connect Your Core Data
First, where does your most important data live? For most startups, it's a small handful of platforms.
Don't overcomplicate it. Your only goal is to connect the 2-3 most critical sources of truth. These are usually:
Your production database: Where your core product data lives (Postgres or MySQL).
Your CRM or marketing platform: HubSpot or Salesforce for customer interactions.
Using a Conversational AI Data Analyst like Statspresso means this isn't a major engineering lift. You just authenticate your accounts, and the platform handles the rest. By day two, your ingredients are in the kitchen.
Days 3-4: Find Your North Star
With your data connected, it's time to focus. It's tempting to ask a million random questions, but that's a recipe for getting lost. Instead, decide what really matters right now.
Pick one “North Star” metric—the single number that best captures the core value your customers get. Is it Daily Active Users? Weekly Recurring Revenue? Just pick one.
Then, identify 3-5 supporting Key Performance Indicators (KPIs) that directly influence that North Star. If your North Star is retention, your KPIs might be feature adoption and time-to-first-value. Write them down. This isn't about building a giant dashboard; it's about giving the team a clear target.
Day 5: Invite the Team and Ask Away
Now, it gets fun. Get your product, marketing, and leadership teams into the tool. Forget a boring lecture. Just show them how easy it is to get an answer to a real question.
Spark curiosity with examples. Show them they can skip the SQL and just ask the data a question in plain English.
Try asking Statspresso: "Which landing pages have the highest conversion rates this month?"
This step is about building momentum. The moment a non-technical teammate asks their own question and gets a real chart back in seconds, the value of self-serve analytics clicks.
Days 6-7: Build Your First Dashboard
Your first dashboard shouldn't be a monolith. Think of it as a living document that answers the most important questions from day four.
As your team asks questions about your KPIs, simply save the most useful charts. A tool like Statspresso lets you add a chart directly from a conversation to a dashboard with one click. By week's end, you’ll have a focused dashboard showing your North Star and its supporting metrics in real-time.
This agile process delivers immediate value. The global BI market is projected to hit $72.21 billion by 2034, with small and medium-sized enterprises driving the fastest growth. Cloud-based tools are leading, with a dominant 50.55% market share expected in 2026, making it easier than ever for startups to get in the game. This rapid adoption of self-serve business intelligence is how nimble companies win.
Common BI Pitfalls Startups Should Avoid
It's easy to buy a BI tool. It's much harder to build a culture that actually uses it. Far too many startups nail the first part, only to watch their expensive platform gather digital dust. They fall into a few common, avoidable traps.
Getting value from business intelligence for startups isn't about the tech; it's about the habits you build around your data.
The "Boil the Ocean" Mistake
The urge to measure everything right away is powerful. It feels productive. But this instinct, “boiling the ocean,” is a classic mistake. When you track hundreds of metrics, the signals that matter get lost in the noise. Your team gets stuck in analysis paralysis—drowning in data but desperate for insight.
Be ruthless about focus. Pinpoint your North Star metric and the handful of KPIs that influence it. Everything else is a distraction.
Choosing Overly Complex Tools
Another common pitfall is falling for a BI tool built for a Fortune 500 company. They're powerful, but they often require a dedicated team of specialists just to keep them running. This recreates the exact data gatekeeper problem you were trying to eliminate.
If your product manager needs a training course to filter a report, you picked the wrong tool. The right platform should feel as easy as sending a message. A tool like Statspresso, a Conversational AI Data Analyst, was built for this. You skip the SQL, ask your data a question, and get a chart back in seconds. That low barrier to entry ensures the tool actually gets used.
Ignoring Data Governance
I know, "data governance" sounds like a boring, corporate buzzword. But ignoring it is the fastest way to kill your entire data strategy. When you have poor data governance—no clear definitions, no ownership—you erode the most critical asset you have: trust.
If marketing says you got 100 new users and product says 85, which is right? When people stop trusting the data, they stop using it. You’re back to making decisions on gut feelings, and your BI investment is a write-off.
This isn't hypothetical. One $400M firm torched $2.1M on an AI-BI tool that cratered with a dismal 11% adoption rate due to poor governance. Once they fixed the data trust issues, adoption skyrocketed to 78% in 90 days, unlocking $4.7M in gains. You can dive deeper into these trends at SR Analytics.
A tool like Statspresso helps rebuild trust by providing transparent, source-grounded answers. Every chart can be traced back to its origin, rebuilding confidence one query at a time. The best BI tool doesn’t just spit out answers; it makes people curious and helps build a culture guided by numbers they can actually believe in.
Try asking Statspresso: "What is the definition of an 'Active User' in our database?"
Got Questions About BI? Let's Get Them Answered.
It's smart to ask questions. It means you're thinking strategically. Here are straightforward answers to the questions I hear most often from founders about getting started with business intelligence.
Do I Really Need a Data Warehouse Right Away?
Honestly, probably not. While a data warehouse is powerful for large-scale operations, modern tools have changed the entry point for BI. You don't have to build a massive, expensive foundation just to start.
An AI analytics assistant like Statspresso can plug directly into your production databases (like Postgres) or the apps you already use (like HubSpot). A warehouse becomes essential later, when you're blending dozens of data sources for more complex recipes.
What’s a BI Tool Going to Cost My Startup?
The price range is massive, so be careful. Traditional BI platforms were built for enterprises with deep pockets. They're often a terrible fit for a lean startup.
The good news is that a new generation of tools has emerged specifically for startups. Look for platforms with generous free tiers or flexible, usage-based pricing that grows with you. This way, your analytics costs stay in sync with your revenue.
How Can I Get My Non-Technical Team to Actually Use This?
This is the million-dollar question. The secret? Make it ridiculously easy. If your team needs a week of training to pull a simple report, they won't use it. You've already failed.
Find a tool with virtually no learning curve. With a platform like Statspresso, a Conversational AI Data Analyst, the barrier is gone—if you can type a question, you can get an answer. Show a few quick wins to motivated team members. When your marketing manager sees campaign ROI in 10 seconds without asking an engineer, others will want in on the action.
This user-friendly approach is why AI in BI is exploding. Adoption is climbing from 45% at the seed stage to 68% at Series A. Startups that prioritize good data governance see 4.2x higher adoption and real results. Dive deeper into the statistics of AI in startups to see how fast this is moving.
Ready to stop guessing and start knowing? Statspresso is your team's on-demand Conversational AI Data Analyst, giving everyone the power to make smarter decisions. Connect your first data source for free and ask your first question.