Self-Serve Business Intelligence (2026 Guide)

Staring at a dashboard that's two weeks out of date is a special kind of nightmare. You need to make a decision now, but your data is stuck in the past. Waiting weeks for an analyst to build a report is a relic. This frustrating cycle is exactly why self-serve business intelligence exists: to give you answers in seconds, not sprints.
TL;DR: Key Takeaways
The Old Way is Broken: Relying on a data team for every report creates a bottleneck, killing momentum.
Self-Serve is About Speed: It empowers non-technical teams (marketing, product, sales) to get their own answers instantly.
Conversational AI is the Key: Modern tools like Statspresso, a Conversational AI Data Analyst, let you skip the complexity. You don't need to learn SQL or a clunky dashboard builder.
The Core Benefit: Skip the SQL. Just ask your data a question and get a chart in seconds.
Getting Started is Easy: Connect your data sources like Postgres or Shopify and ask your first question.
Why Your Team is Still Waiting for Data Reports
The traditional model—filing a ticket and waiting for a data analyst—is fundamentally broken. By the time you get the numbers, the opportunity has vanished. This isn't the analyst's fault; they're buried under a mountain of requests. The real culprit is an outdated system that treats data like a locked treasure chest only a few people have the key to.
This slow, painful process creates a logjam where important questions go unanswered and smart decisions are delayed.
From Gatekeepers to Explorers
Self-serve business intelligence demolishes this old structure. It’s a mindset shift from data gatekeepers to data explorers. The entire point is to empower the people on the front lines—product managers, marketers, founders—to find answers for themselves, right when they need them.
Modern tools put data directly into the hands of those who understand the business context best. It’s not about adding more software; it’s about creating a faster, more agile way of working. Instead of filing a ticket and waiting, your team can ask questions and get instant, visual answers.
Try asking Statspresso: "Show me my top 5 marketing channels by user signups for last month."
That's the power of modern self-serve analytics. With a Conversational AI Data Analyst like Statspresso, you close the gap between technical and non-technical teams, turning data from a source of frustration into your company's most valuable asset.
So, What Is Self-Serve Business Intelligence?
Let's cut the jargon. Self-serve business intelligence gives your entire team a direct line to your company's data, no SQL-speaking translator required. It's the difference between waiting days for an answer and getting it yourself in seconds.
Traditional BI is like ordering from a fixed menu. You’re limited to what the data team prepared for you in a pre-built dashboard. Self-serve BI is like having a fully-stocked kitchen where you can instantly create any data visualization you can imagine, just by asking.
The Magic Under the Hood
This shift isn't magic; it's smart technology designed for people who aren't data analysts. Modern platforms pull this off with a few key ingredients:
Intuitive Interfaces: Forget complex drag-and-drop builders. Modern tools feel more like a search engine than clunky reporting software.
Automated Data Connectors: You shouldn't need an engineer to get started. Self-serve platforms offer simple connectors for everything from a Postgres database to your Shopify store.
Conversational Analytics: This is the real game-changer. Instead of learning the tool's language, you use your own. A Conversational AI Data Analyst like Statspresso lets you ask questions in plain English.
The market agrees. The global self-service BI market is projected to surge from $7.99 billion to $32.97 billion by 2034. This explosive growth signals a massive demand from businesses to empower their teams. You can learn more about the self-service BI market trends and see what this shift means for you.
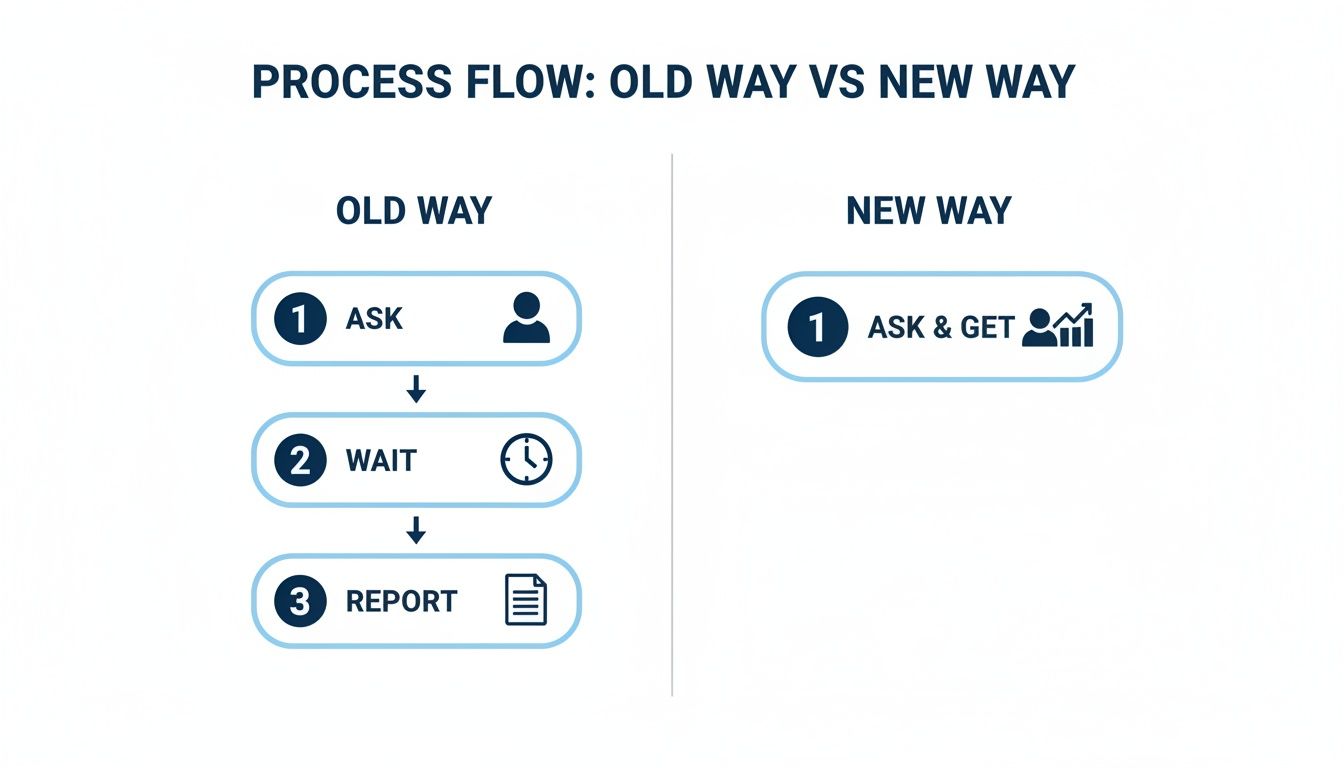
Old Way vs. New Way
The difference in workflow is night and day. The old way is a frustrating game of telephone. The new way is direct and immediate. Self-serve BI isn't just about faster reports. It’s about creating a culture where anyone can validate a hunch with data in seconds.
Task | Old Way (Manual SQL) | New Way (Statspresso) |
|---|---|---|
Get Started | Submit a ticket to the data team and wait. | Connect your data source in minutes. |
Ask a Question | Explain your business need to an analyst. | Type your question directly in plain English. |
Get an Answer | Wait days (or weeks) for a report. | Get an interactive chart in seconds. |
Ask a Follow-Up | Submit another ticket for a small change. | Ask your follow-up question immediately. |
This efficiency is a huge competitive advantage.
Try asking Statspresso: "Show me my revenue by month for the last year as a bar chart."
That’s how simple it should be. Skip the SQL. Just ask. This is the core promise of modern self-serve business intelligence—turning data from a bottleneck into an engine for growth.
The Three Pillars of a Successful Rollout
Buying a shiny new self-serve business intelligence tool and hoping a data-driven culture magically appears is a classic mistake. A successful rollout stands firmly on three pillars: People, Process, and Technology. Get them right, and the tool becomes the heartbeat of your company’s decision-making.
Pillar 1: People (Fostering Data Curiosity)
The human element is the most critical piece. Your goal isn’t to turn everyone into a data scientist. It’s to spark genuine curiosity. Make data feel less like a test and more like a superpower.
Start by training teams to ask better questions. Instead of a vague "How are sales?", get them thinking, "Which marketing channels drove the most sales in the last 30 days?" A Conversational AI Data Analyst like Statspresso is built for exactly these kinds of clear questions.
Empower your team with quick wins. When a product manager answers their own question in 30 seconds, they’ll be hooked. That's how you build momentum.
This diagram says it all: self-serve analytics eliminates the waiting game, collapsing a multi-day process into seconds.
Pillar 2: Process (Governing Without Bottlenecks)
With more people accessing data, you need some guardrails. The goal is data governance without recreating the very bottlenecks you’re trying to eliminate. This is all about establishing trust in your numbers.
The cornerstone is creating a "single source of truth." Everyone must agree on the definition of core metrics like "Monthly Recurring Revenue." Modern platforms enforce this through a centralized metric store, ensuring that when your marketing and finance leads ask about revenue, they get the same number.
Pillar 3: Technology (Choosing the Right Tool)
Finally, you need the right tech. A modern self-serve business intelligence tool has several non-negotiable features.
Here’s what to look for:
Seamless Data Connectors: Easily connect to all your data, whether it's Postgres, Shopify, or your HubSpot CRM.
A Truly Conversational Interface: The platform must understand plain English. If your team has to learn a clunky interface, you’ve already lost. The point is to skip the SQL and just ask.
Robust Security and Governance: You need granular control over who sees what. Look for row-level security and role-based access controls.
The global cloud BI market is projected to hit $15.2 billion by 2026, growing at a remarkable 22.8% CAGR. This trend is fueled by better performance and easy scalability. You can explore more statistics on the business intelligence market to see this shift in detail.
Try asking Statspresso: 'Compare user signups from our Google Ads campaign vs our organic blog traffic last quarter.'
This is the kind of question that moves your business forward. And with the right pillars in place, anyone on your team can get the answer.
How Teams Actually Win With Self-Serve Analytics
Let's talk real-world results. The value of self-serve business intelligence is in the tangible, day-to-day wins. We've seen teams slash their reporting time by 90%. Data stops being a bottleneck and starts being a partner in every decision.
For the Marketing Lead
It's the end of the month. You need to know which channel had the best return on ad spend (ROAS) to set next month's budget. The old way? File a ticket and wait.
With self-serve analytics, the process is immediate. A Conversational AI Data Analyst like Statspresso changes the game.
Try asking Statspresso: "What was our ROAS by marketing channel last month? Show me as a bar chart."
In seconds, you get a clean visual showing where your money is working hardest. You can confidently double down on what's working, often boosting campaign efficiency by 30% or more. No waiting. No guessing.
For the Product Manager
You just launched a new feature. Are people using it? Traditionally, you'd wait a week for the next analytics report. A modern self-serve BI platform gives you a live look at adoption.
The difference is night and day.
Task | Old Way (Manual SQL) | New Way (Statspresso) |
|---|---|---|
Question | "Is anyone using our new feature?" | "Is anyone using our new feature?" |
Action | File a ticket for the data team. | Ask your AI analyst directly. |
Wait Time | 3-5 business days. | About 10 seconds. |
Outcome | Get a static CSV or chart. | Get an interactive chart you can filter. |
The ability to skip the SQL and just ask transforms product management into a truly data-informed practice.
Try asking Statspresso: "Show me the daily active users for our new 'Project Templates' feature since launch."
This immediate feedback lets you iterate faster and build a product your customers actually want.
For the Founder
As a founder, you need a constant, up-to-the-minute view of your core metrics: MRR, churn, and LTV. Self-serve BI puts these vital signs directly in your hands.
Try asking Statspresso: "Plot my MRR growth and churn rate on the same chart for the last 12 months."
Having this clarity on demand is a massive advantage. It gives you confidence walking into board meetings and keeps the entire company laser-focused on the numbers that matter.
Sidestepping Common Pitfalls on Your BI Journey
Rolling out self-serve business intelligence is a huge leap forward, but it's not a silver bullet. Teams often hit the same roadblocks. The good news? They're completely preventable.
Mistake 1: The "Wild West" of Metrics
The most dangerous trap is "data chaos." This happens when you give everyone a tool without setting ground rules. Soon, marketing's "revenue" doesn't match finance's number, and trust in data erodes.
The fix is a single source of truth. Modern tools like Statspresso tackle this with a centralized metric gallery. Your data team defines critical business terms (like MRR) once. After that, anyone who asks a question about that metric gets the same standardized, trustworthy answer.
Mistake 2: The Expensive Tool No One Uses
It’s painful: you invest a fortune in a BI platform, and... nothing. This is a classic sign of poor user adoption, usually because the "self-serve" tool is actually difficult to use.
True self-service means the barrier to entry is near zero. This is where a Conversational AI Data Analyst changes the game. If your team can ask a question, they should get an answer. It's that simple.
Try asking Statspresso: "Which of our blog posts from last quarter drove the most user signups?"
This natural, chat-based approach drives real adoption. You skip the SQL and just ask, getting an instant chart with zero friction.
Mistake 3: Garbage In, Garbage Out
Remember the oldest rule in data: garbage in, garbage out. An incredible tool can't magically clean up messy data. Funneling bad data into a great platform just means you'll visualize flawed information faster.
To prevent this, prioritize keeping your data sources clean. A good self-serve tool should also offer total transparency. For instance, with every answer Statspresso provides, it shows you which data source and tables were used, so you can always trace an insight back to its origin.
Why Conversational AI Is The Future of BI
Dashboards were a great first step in self-serve business intelligence, but they were never the final destination. A dashboard is a static picture. It answers the questions you knew to ask last month. But what about the urgent questions that pop up today?
The next frontier is conversational AI. This isn't just a fancy chatbot; it's a fundamental shift in how we interact with data. Dashboards show you what you already asked for. Conversational analytics helps you discover the “unknown unknowns” through a natural dialogue.

This approach drops the barrier to entry to zero. If you can type a question, you can be your own data analyst.
Beyond Pre-Built Reports
Traditional dashboards are like a printed map. Conversational AI is like a GPS. You tell it where you want to go, and it charts the best course in real-time.
Imagine asking a question and getting a chart. You notice an interesting spike. Instead of filing a new ticket, you just ask a follow-up.
Try asking Statspresso: "Show me user signups by country for last month."
Follow up with: "Okay, now break down the United States by state."
This back-and-forth is where real insights are hiding. It makes data analysis feel less like a technical chore and more like a conversation with an incredibly smart colleague.
It's More Than Just a Chatbot
A true Conversational AI Data Analyst like Statspresso doesn't just recognize keywords; it understands business context.
Context-Awareness: It remembers your conversation, allowing for natural follow-ups.
Semantic Understanding: It connects your plain-English questions to precise, pre-defined metrics.
Direct Query Generation: Behind the scenes, it writes and runs SQL, visualizing the result in seconds.
This table shows why the conversational approach is such a massive leap forward.
Aspect | Old Way (Dashboards) | New Way (Conversational AI) |
|---|---|---|
Flexibility | Static; answers pre-defined questions. | Dynamic; answers any question on the fly. |
Speed to Insight | Slow; requires new builds for new questions. | Instant; get charts in seconds. |
User Experience | Can be complex; often requires training. | Intuitive; as easy as sending a message. |
Discovery | Limited to what's already on the dashboard. | Uncovers hidden patterns and correlations. |
This is the future of self-serve business intelligence. It’s about making data analysis as simple as having a conversation. The ultimate goal is to skip the SQL and just ask, turning curiosity into clarity instantly. You can learn more about how to chat with your data using AI and see the difference for yourself.
Frequently Asked Questions
Got questions? Good. Here are the most common ones I hear from founders, product managers, and marketing leads.
How is self-serve BI different from Google Analytics?
Tools like Google Analytics are great for website metrics, but that data lives on an island. True self-serve business intelligence platforms connect to all your data sources—your CRM, payment processor, and product database. This unified view lets you ask much bigger questions, like "Which of our marketing campaigns brought in customers with the highest lifetime value?" That’s the leap from isolated metrics to a complete business picture.
Does giving everyone data access create security risks?
A valid concern, and one that modern tools solve with strong data governance. This isn't about handing over the keys to the kingdom. Platforms like Statspresso have powerful, role-based access controls. You can define exactly who sees what, down to the individual row. You get the upside of data access without sacrificing security.
Do I need a data warehouse to get started?
Not anymore. While a data warehouse is a great long-term goal, it’s no longer a blocker. The best tools today connect directly to the sources you already use, from production databases to SaaS apps like Shopify or HubSpot. This means you can get answers in seconds, skipping the massive, upfront engineering project. A Conversational AI Data Analyst works with the data you have, so you can skip the SQL and just ask.
Ready to stop waiting and start asking? With Statspresso, your team gets insights in seconds, not weeks. Connect your first data source for free and ask your first question.
Staring at a dashboard that's two weeks out of date is a special kind of nightmare. You need to make a decision now, but your data is stuck in the past. Waiting weeks for an analyst to build a report is a relic. This frustrating cycle is exactly why self-serve business intelligence exists: to give you answers in seconds, not sprints.
TL;DR: Key Takeaways
The Old Way is Broken: Relying on a data team for every report creates a bottleneck, killing momentum.
Self-Serve is About Speed: It empowers non-technical teams (marketing, product, sales) to get their own answers instantly.
Conversational AI is the Key: Modern tools like Statspresso, a Conversational AI Data Analyst, let you skip the complexity. You don't need to learn SQL or a clunky dashboard builder.
The Core Benefit: Skip the SQL. Just ask your data a question and get a chart in seconds.
Getting Started is Easy: Connect your data sources like Postgres or Shopify and ask your first question.
Why Your Team is Still Waiting for Data Reports
The traditional model—filing a ticket and waiting for a data analyst—is fundamentally broken. By the time you get the numbers, the opportunity has vanished. This isn't the analyst's fault; they're buried under a mountain of requests. The real culprit is an outdated system that treats data like a locked treasure chest only a few people have the key to.
This slow, painful process creates a logjam where important questions go unanswered and smart decisions are delayed.
From Gatekeepers to Explorers
Self-serve business intelligence demolishes this old structure. It’s a mindset shift from data gatekeepers to data explorers. The entire point is to empower the people on the front lines—product managers, marketers, founders—to find answers for themselves, right when they need them.
Modern tools put data directly into the hands of those who understand the business context best. It’s not about adding more software; it’s about creating a faster, more agile way of working. Instead of filing a ticket and waiting, your team can ask questions and get instant, visual answers.
Try asking Statspresso: "Show me my top 5 marketing channels by user signups for last month."
That's the power of modern self-serve analytics. With a Conversational AI Data Analyst like Statspresso, you close the gap between technical and non-technical teams, turning data from a source of frustration into your company's most valuable asset.
So, What Is Self-Serve Business Intelligence?
Let's cut the jargon. Self-serve business intelligence gives your entire team a direct line to your company's data, no SQL-speaking translator required. It's the difference between waiting days for an answer and getting it yourself in seconds.
Traditional BI is like ordering from a fixed menu. You’re limited to what the data team prepared for you in a pre-built dashboard. Self-serve BI is like having a fully-stocked kitchen where you can instantly create any data visualization you can imagine, just by asking.
The Magic Under the Hood
This shift isn't magic; it's smart technology designed for people who aren't data analysts. Modern platforms pull this off with a few key ingredients:
Intuitive Interfaces: Forget complex drag-and-drop builders. Modern tools feel more like a search engine than clunky reporting software.
Automated Data Connectors: You shouldn't need an engineer to get started. Self-serve platforms offer simple connectors for everything from a Postgres database to your Shopify store.
Conversational Analytics: This is the real game-changer. Instead of learning the tool's language, you use your own. A Conversational AI Data Analyst like Statspresso lets you ask questions in plain English.
The market agrees. The global self-service BI market is projected to surge from $7.99 billion to $32.97 billion by 2034. This explosive growth signals a massive demand from businesses to empower their teams. You can learn more about the self-service BI market trends and see what this shift means for you.
Old Way vs. New Way
The difference in workflow is night and day. The old way is a frustrating game of telephone. The new way is direct and immediate. Self-serve BI isn't just about faster reports. It’s about creating a culture where anyone can validate a hunch with data in seconds.
Task | Old Way (Manual SQL) | New Way (Statspresso) |
|---|---|---|
Get Started | Submit a ticket to the data team and wait. | Connect your data source in minutes. |
Ask a Question | Explain your business need to an analyst. | Type your question directly in plain English. |
Get an Answer | Wait days (or weeks) for a report. | Get an interactive chart in seconds. |
Ask a Follow-Up | Submit another ticket for a small change. | Ask your follow-up question immediately. |
This efficiency is a huge competitive advantage.
Try asking Statspresso: "Show me my revenue by month for the last year as a bar chart."
That’s how simple it should be. Skip the SQL. Just ask. This is the core promise of modern self-serve business intelligence—turning data from a bottleneck into an engine for growth.
The Three Pillars of a Successful Rollout
Buying a shiny new self-serve business intelligence tool and hoping a data-driven culture magically appears is a classic mistake. A successful rollout stands firmly on three pillars: People, Process, and Technology. Get them right, and the tool becomes the heartbeat of your company’s decision-making.
Pillar 1: People (Fostering Data Curiosity)
The human element is the most critical piece. Your goal isn’t to turn everyone into a data scientist. It’s to spark genuine curiosity. Make data feel less like a test and more like a superpower.
Start by training teams to ask better questions. Instead of a vague "How are sales?", get them thinking, "Which marketing channels drove the most sales in the last 30 days?" A Conversational AI Data Analyst like Statspresso is built for exactly these kinds of clear questions.
Empower your team with quick wins. When a product manager answers their own question in 30 seconds, they’ll be hooked. That's how you build momentum.
This diagram says it all: self-serve analytics eliminates the waiting game, collapsing a multi-day process into seconds.
Pillar 2: Process (Governing Without Bottlenecks)
With more people accessing data, you need some guardrails. The goal is data governance without recreating the very bottlenecks you’re trying to eliminate. This is all about establishing trust in your numbers.
The cornerstone is creating a "single source of truth." Everyone must agree on the definition of core metrics like "Monthly Recurring Revenue." Modern platforms enforce this through a centralized metric store, ensuring that when your marketing and finance leads ask about revenue, they get the same number.
Pillar 3: Technology (Choosing the Right Tool)
Finally, you need the right tech. A modern self-serve business intelligence tool has several non-negotiable features.
Here’s what to look for:
Seamless Data Connectors: Easily connect to all your data, whether it's Postgres, Shopify, or your HubSpot CRM.
A Truly Conversational Interface: The platform must understand plain English. If your team has to learn a clunky interface, you’ve already lost. The point is to skip the SQL and just ask.
Robust Security and Governance: You need granular control over who sees what. Look for row-level security and role-based access controls.
The global cloud BI market is projected to hit $15.2 billion by 2026, growing at a remarkable 22.8% CAGR. This trend is fueled by better performance and easy scalability. You can explore more statistics on the business intelligence market to see this shift in detail.
Try asking Statspresso: 'Compare user signups from our Google Ads campaign vs our organic blog traffic last quarter.'
This is the kind of question that moves your business forward. And with the right pillars in place, anyone on your team can get the answer.
How Teams Actually Win With Self-Serve Analytics
Let's talk real-world results. The value of self-serve business intelligence is in the tangible, day-to-day wins. We've seen teams slash their reporting time by 90%. Data stops being a bottleneck and starts being a partner in every decision.
For the Marketing Lead
It's the end of the month. You need to know which channel had the best return on ad spend (ROAS) to set next month's budget. The old way? File a ticket and wait.
With self-serve analytics, the process is immediate. A Conversational AI Data Analyst like Statspresso changes the game.
Try asking Statspresso: "What was our ROAS by marketing channel last month? Show me as a bar chart."
In seconds, you get a clean visual showing where your money is working hardest. You can confidently double down on what's working, often boosting campaign efficiency by 30% or more. No waiting. No guessing.
For the Product Manager
You just launched a new feature. Are people using it? Traditionally, you'd wait a week for the next analytics report. A modern self-serve BI platform gives you a live look at adoption.
The difference is night and day.
Task | Old Way (Manual SQL) | New Way (Statspresso) |
|---|---|---|
Question | "Is anyone using our new feature?" | "Is anyone using our new feature?" |
Action | File a ticket for the data team. | Ask your AI analyst directly. |
Wait Time | 3-5 business days. | About 10 seconds. |
Outcome | Get a static CSV or chart. | Get an interactive chart you can filter. |
The ability to skip the SQL and just ask transforms product management into a truly data-informed practice.
Try asking Statspresso: "Show me the daily active users for our new 'Project Templates' feature since launch."
This immediate feedback lets you iterate faster and build a product your customers actually want.
For the Founder
As a founder, you need a constant, up-to-the-minute view of your core metrics: MRR, churn, and LTV. Self-serve BI puts these vital signs directly in your hands.
Try asking Statspresso: "Plot my MRR growth and churn rate on the same chart for the last 12 months."
Having this clarity on demand is a massive advantage. It gives you confidence walking into board meetings and keeps the entire company laser-focused on the numbers that matter.
Sidestepping Common Pitfalls on Your BI Journey
Rolling out self-serve business intelligence is a huge leap forward, but it's not a silver bullet. Teams often hit the same roadblocks. The good news? They're completely preventable.
Mistake 1: The "Wild West" of Metrics
The most dangerous trap is "data chaos." This happens when you give everyone a tool without setting ground rules. Soon, marketing's "revenue" doesn't match finance's number, and trust in data erodes.
The fix is a single source of truth. Modern tools like Statspresso tackle this with a centralized metric gallery. Your data team defines critical business terms (like MRR) once. After that, anyone who asks a question about that metric gets the same standardized, trustworthy answer.
Mistake 2: The Expensive Tool No One Uses
It’s painful: you invest a fortune in a BI platform, and... nothing. This is a classic sign of poor user adoption, usually because the "self-serve" tool is actually difficult to use.
True self-service means the barrier to entry is near zero. This is where a Conversational AI Data Analyst changes the game. If your team can ask a question, they should get an answer. It's that simple.
Try asking Statspresso: "Which of our blog posts from last quarter drove the most user signups?"
This natural, chat-based approach drives real adoption. You skip the SQL and just ask, getting an instant chart with zero friction.
Mistake 3: Garbage In, Garbage Out
Remember the oldest rule in data: garbage in, garbage out. An incredible tool can't magically clean up messy data. Funneling bad data into a great platform just means you'll visualize flawed information faster.
To prevent this, prioritize keeping your data sources clean. A good self-serve tool should also offer total transparency. For instance, with every answer Statspresso provides, it shows you which data source and tables were used, so you can always trace an insight back to its origin.
Why Conversational AI Is The Future of BI
Dashboards were a great first step in self-serve business intelligence, but they were never the final destination. A dashboard is a static picture. It answers the questions you knew to ask last month. But what about the urgent questions that pop up today?
The next frontier is conversational AI. This isn't just a fancy chatbot; it's a fundamental shift in how we interact with data. Dashboards show you what you already asked for. Conversational analytics helps you discover the “unknown unknowns” through a natural dialogue.
This approach drops the barrier to entry to zero. If you can type a question, you can be your own data analyst.
Beyond Pre-Built Reports
Traditional dashboards are like a printed map. Conversational AI is like a GPS. You tell it where you want to go, and it charts the best course in real-time.
Imagine asking a question and getting a chart. You notice an interesting spike. Instead of filing a new ticket, you just ask a follow-up.
Try asking Statspresso: "Show me user signups by country for last month."
Follow up with: "Okay, now break down the United States by state."
This back-and-forth is where real insights are hiding. It makes data analysis feel less like a technical chore and more like a conversation with an incredibly smart colleague.
It's More Than Just a Chatbot
A true Conversational AI Data Analyst like Statspresso doesn't just recognize keywords; it understands business context.
Context-Awareness: It remembers your conversation, allowing for natural follow-ups.
Semantic Understanding: It connects your plain-English questions to precise, pre-defined metrics.
Direct Query Generation: Behind the scenes, it writes and runs SQL, visualizing the result in seconds.
This table shows why the conversational approach is such a massive leap forward.
Aspect | Old Way (Dashboards) | New Way (Conversational AI) |
|---|---|---|
Flexibility | Static; answers pre-defined questions. | Dynamic; answers any question on the fly. |
Speed to Insight | Slow; requires new builds for new questions. | Instant; get charts in seconds. |
User Experience | Can be complex; often requires training. | Intuitive; as easy as sending a message. |
Discovery | Limited to what's already on the dashboard. | Uncovers hidden patterns and correlations. |
This is the future of self-serve business intelligence. It’s about making data analysis as simple as having a conversation. The ultimate goal is to skip the SQL and just ask, turning curiosity into clarity instantly. You can learn more about how to chat with your data using AI and see the difference for yourself.
Frequently Asked Questions
Got questions? Good. Here are the most common ones I hear from founders, product managers, and marketing leads.
How is self-serve BI different from Google Analytics?
Tools like Google Analytics are great for website metrics, but that data lives on an island. True self-serve business intelligence platforms connect to all your data sources—your CRM, payment processor, and product database. This unified view lets you ask much bigger questions, like "Which of our marketing campaigns brought in customers with the highest lifetime value?" That’s the leap from isolated metrics to a complete business picture.
Does giving everyone data access create security risks?
A valid concern, and one that modern tools solve with strong data governance. This isn't about handing over the keys to the kingdom. Platforms like Statspresso have powerful, role-based access controls. You can define exactly who sees what, down to the individual row. You get the upside of data access without sacrificing security.
Do I need a data warehouse to get started?
Not anymore. While a data warehouse is a great long-term goal, it’s no longer a blocker. The best tools today connect directly to the sources you already use, from production databases to SaaS apps like Shopify or HubSpot. This means you can get answers in seconds, skipping the massive, upfront engineering project. A Conversational AI Data Analyst works with the data you have, so you can skip the SQL and just ask.
Ready to stop waiting and start asking? With Statspresso, your team gets insights in seconds, not weeks. Connect your first data source for free and ask your first question.