Data Modeling in Data Warehouse (2026)

You know the answers are in your Shopify, HubSpot, and Postgres data. But trying to piece it all together feels like a mess. Waiting weeks for a data analyst to build a dashboard is a relic of the past. For a busy founder or product manager, this isn't just frustrating—it’s a roadblock to growth.
This is where data modeling in a data warehouse comes in. It’s the blueprint for taking all that raw, messy data and giving it a clear, logical structure that makes it genuinely useful for analysis.
Your Data Is Talking, But You Can’t Understand It
How often have you had a critical business question, only to be told you'll have to wait days—or weeks—for an analyst to build the right dashboard? That gap between question and answer is where opportunities die. The problem isn't the data; it's the chaos. Without a solid blueprint, your data warehouse is just an expensive, disorganized closet.
This guide will break down data modeling in a data warehouse into something you can actually use. We’ll show you how a well-structured data foundation is the key to unlocking the fast, reliable insights your business needs.

Why Good Modeling Is the Secret to Instant Answers
Let's skip the academic definitions. The goal here is simple: to help you ask a question in plain English and get a chart back in seconds. This isn't about turning you into a data engineer. It's about showing you how a well-modeled data warehouse eliminates the bottleneck between you and your data.
When your data is organized logically, new tools can do some incredible things. This is where a conversational AI data analyst like Statspresso shines.
The better your data model, the smarter the AI analyst. A clean structure allows you to skip the SQL and simply ask what you want to know. You get a chart back in seconds.
Once your sales and marketing data are modeled correctly, you can ask a direct business question without ever thinking about code.
Try asking Statspresso: "Show me my top 5 products by revenue this quarter and compare it to last quarter."
This guide gives you the core concepts to have productive conversations with your technical team. Together, you can ensure your data infrastructure is built for speed and clarity from the ground up. Let's get your data warehouse speaking your language.
The Building Blocks of a Smart Data Warehouse
Think of your data warehouse as a massive, unassembled LEGO set. Without a blueprint, all you have is a chaotic pile of bricks. A data model is that blueprint. It’s the thoughtful design that lets you build anything you can imagine, from a simple report to a complex sales forecast.
Data modeling in a data warehouse isn't some abstract technical exercise. It’s the practical process of organizing your business information so you can ask smart questions and, more importantly, get answers you can trust. Let's break down the essential components.
Facts: The Numbers That Matter
Everything starts with facts. These are the quantifiable, numeric values that track your business operations. Think of them as the verbs of your business—the actual events and actions taking place.
Facts are almost always:
Numeric: They are concrete numbers you can add, average, or count.
Event-Driven: Each fact corresponds to a specific business event, like a completed sale, a new user sign-up, or a click on a marketing email.
For an e-commerce store, your facts would be metrics like sales_amount, quantity_sold, and shipping_cost. These are the cold, hard numbers that tell you what’s happening.
A good data model makes these numbers useful. A well-designed fact table transforms raw data into a clear story about your performance—a story a conversational AI data analyst like Statspresso can translate for you in seconds.
Dimensions: The Context That Gives Numbers Meaning
A number on its own is meaningless. A sale of $100 is just... a number. But what if it was a $100 sale made yesterday, in New York, from a first-time customer who bought a blue t-shirt? Suddenly, you have a story.
Those descriptive details—the "who, what, where, when, and why"—are your dimensions. They provide the essential context that brings your facts to life.
Customers: Who made the purchase?
Products: What did they buy?
Geography: Where did the sale happen?
Time: When did the event take place?
Back in the 1990s, Ralph Kimball’s idea of dimensional modeling revolutionized data warehousing by separating measurable fact tables from contextual dimension tables. This design, known as the star schema, made queries faster and remains the foundation for many modern cloud data warehouses today, enabling tools like Statspresso to find patterns instantly without anyone needing to write complex SQL. You can learn more about how this changed data warehouse modeling on Integrate.io.
Grain: Defining Your Level of Detail
The final piece of the puzzle is the grain. The grain simply defines what a single row in your fact table actually represents. It sets the level of detail for your entire analysis.
For instance, is one row in your sales data:
An individual line item on a receipt? (This is a fine grain.)
A customer's total purchase for the day? (This is a coarser grain.)
A store's total sales for the week? (This is a very coarse grain.)
Choosing the right grain is a critical decision in data modeling in a data warehouse. A finer grain gives you incredible detail but creates larger data tables. A coarser grain is fast but limits the questions you can ask. As you think through these building blocks, it’s worth keeping an eye on where the field is headed, including the future of data warehousing in the age of AI.
Try asking Statspresso: "What were my total sales by product category last month?"
Choosing Your Blueprint: Star vs. Snowflake Schemas
Once you’ve got a handle on your facts and dimensions, the next big decision is how to arrange them. This is where you’ll find two battle-tested blueprints: the Star Schema and the Snowflake Schema. Think of this choice as picking between a sprinter and a meticulous organizer.
The Star Schema: Built for Speed
The Star Schema is the sprinter. It's simple, powerful, and designed for one goal: getting answers out of your data as fast as possible. The design is refreshingly straightforward—a central fact table holding your core numbers is directly linked to each of its descriptive dimension tables.
Fewer connections mean your queries run much faster. This is exactly what you want for self-service analytics and what makes tools like a conversational AI analyst truly shine. The name comes from its diagram, which looks like a star with the fact table at its center. It’s a denormalized model, which just means it allows for some repetitive data in exchange for raw query performance. For most modern analytics, the Star Schema is the hands-down winner. We dig deeper into this essential structure in our guide to the Star Schema data model.
This diagram gives you a clear visual of how facts, dimensions, and grain—the building blocks we've been discussing—all fit together to form a cohesive model.
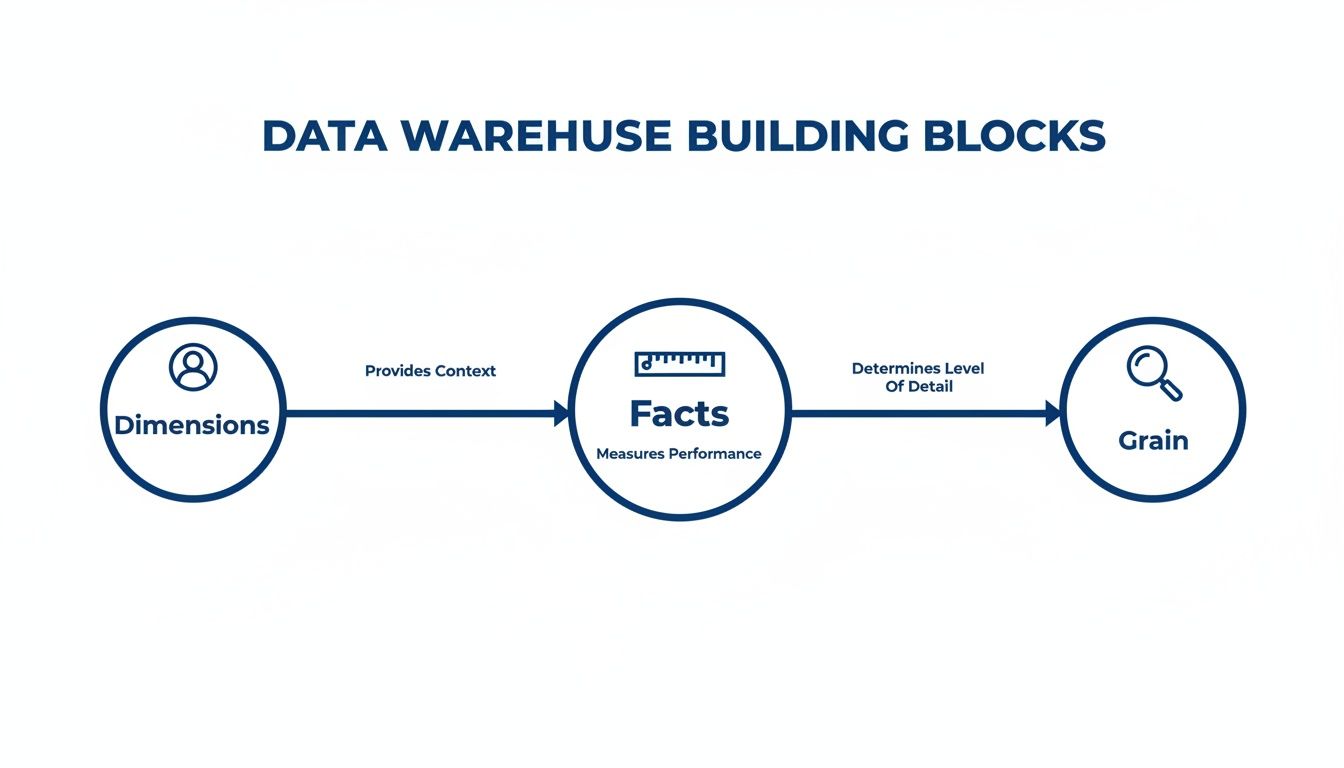
As you can see, dimensions provide the crucial "who, what, and where" context for your metrics (the facts), and your choice of facts sets the level of detail (the grain) for your analysis.
The Snowflake Schema: Built for Organization
The Snowflake Schema is the meticulous organizer. It takes the Star model and applies normalization, breaking down large dimension tables into smaller, related sub-tables to eliminate data redundancy. While this creates a beautifully organized and storage-efficient structure, that organization comes with a trade-off: query speed.
To answer a question, the database has to perform a series of complex joins, hopping from one small table to the next. This can dramatically slow down queries and make the data harder for both humans and analytics tools to navigate.
Star Schema vs. Snowflake Schema: Which Is Right For You?
A decade ago, when data storage was incredibly expensive, the space-saving benefits of the Snowflake Schema made it an attractive option. But with the low cost of modern cloud data warehouses like Snowflake, BigQuery, and Redshift, that advantage has largely disappeared. Today, the priority is speed-to-insight.
Attribute | Star Schema (The Sprinter) | Snowflake Schema (The Organizer) |
|---|---|---|
Query Speed | Fast. Fewer, simpler joins mean quick answers. | Slower. More joins increase query complexity and time. |
Structure | Simple & Intuitive. Easy for analysts and AI to understand. | Complex. A web of tables can be difficult to navigate. |
Maintenance | Easier. Fewer tables to manage and update. | Harder. More tables and relationships add overhead. |
Storage | Higher (due to data redundancy). | Lower (highly normalized). |
Best For | Most BI & Analytics. Perfect for fast, self-serve insights. | Niche cases with very complex, multi-level hierarchies. |
The Star Schema provides the ideal foundation for a conversational AI analyst like Statspresso. It creates a clean, fast, and understandable structure, empowering you to simply ask a question and get a chart back in seconds.
Try asking Statspresso: "Compare our revenue by product_category and customer_region for Q3."
The Modern Approach: Data Vault and Cloud-Native Modeling
Star and Snowflake schemas are the bedrock of data warehousing, but as data sources multiply, modern approaches are emerging to handle this new reality: Data Vault and cloud-native modeling. These represent a different way of thinking about building data infrastructure—one built for flexibility, historical accuracy, and massive scale.
Data Vault: The Unchangeable Historical Archive
Think of your data warehouse like a financial ledger. You never erase a previous transaction; you add a new one to reflect a change. That’s the idea behind the Data Vault model. It's built to be an "audit-proof" system of record.
Instead of facts and dimensions, a Data Vault uses three core building blocks:
Hubs: Core business concepts like
CustomersorProducts.Links: Connections that show how Hubs relate to each other.
Satellites: Descriptive details that "orbit" Hubs and Links. When an attribute changes, a new Satellite record is added with a timestamp, preserving a complete history.
This "insert-only" design means you never lose a single piece of your data's history. It's a game-changer for regulated industries. Adoption of Data Vault modeling is projected to surge in enterprise settings by 2026, as it offers total historical traceability. This agility allows a platform like Statspresso to generate trustworthy charts from a single source of truth. You can read more about these top data warehouse trends and their impact on Softweb Solutions.
Cloud-Native Modeling: Built for Infinite Scale
Cloud-native modeling is a mindset born from the power of modern platforms like Snowflake, BigQuery, and Redshift. For years, modelers obsessed with saving storage space. Today, storage is cheap, but compute power—the speed at which you can answer a question—is everything.
Cloud-native modeling fully embraces architectures that separate storage from compute. This lets you store petabytes of data affordably and, when you need to run a query, spin up a powerful compute cluster to get the answer in seconds.
This changes the trade-offs:
We can build much wider, denormalized tables (like in a Star Schema) without worrying about storage costs.
We can easily ingest and query semi-structured data like JSON.
We can scale analytics power up or down on demand.
This philosophy is less about a single, rigid schema and more about designing for raw speed, flexibility, and scalability.
This is exactly the kind of environment where a conversational AI data analyst like Statspresso thrives. When you combine a cloud-native model with on-demand compute, there’s no more waiting.
Try asking Statspresso: "Compare customer lifetime value for users acquired through our last three campaigns as a bar chart."
A question like that might have taken days on an older system. Now, it's a simple conversation. That's the real-world payoff of embracing modern data modeling in a data warehouse.
From Theory to Action: A 5-Step Modeling Guide
Alright, let's get practical. Building a great data model for a data warehouse is a straightforward process that begins and ends with your business questions. This five-step guide will help you lead the conversation with your technical team.
Step 1: Identify Business Processes
First: what are we trying to measure? Pinpoint the core activities that drive your business. For a typical SaaS business, the list is probably familiar:
User Sign-ups
Subscription Activations
Feature Usage Events
Customer Support Tickets
Marketing Campaign Clicks
Pick one process to start with, like subscription activations. Trying to model the entire business at once is a classic rookie mistake.
Step 2: Declare the Grain
Now for the most important step: declaring the grain. This is your decision about what a single row in your fact table will represent. It defines the level of detail for your analysis. For "subscription activation," what could the grain be?
One row per individual subscription activation. (Detailed.)
One row per customer, per day. (Summarized.)
One row per pricing plan, per month. (High-level.)
Getting the grain right is everything. When in doubt, lean toward the most detailed (or "atomic") grain possible. You can always roll up detailed data, but you can never break down summarized data.
For a structured framework, check out this guide on how to design database schema.
Step 3: Identify Dimensions
Next question: "How will I want to filter and group this data?" The answers are your dimensions. For our subscription activation event, the dimensions practically name themselves:
Customer: Who activated? (User ID, company size)
Time: When did it happen? (Date, month, quarter)
Product: What plan did they buy? (Plan name, price)
Marketing Channel: How did they find us? (Google Ads, referral)
These dimensions become the powerful levers you pull to slice and dice your data.
Step 4: Identify Facts
Facts are the numbers—the quantitative measurements associated with your business process. For our grain of "one row per subscription activation," the facts are obvious:
Monthly Recurring Revenue (MRR): The value of the new subscription.
Activation Count: This is often just a "1" on every row, making it easy to count activations.
Discount Amount: If a discount was applied, how much was it?
When you combine these numbers with your dimensions, a tool like Statspresso can tell the story.
Try asking Statspresso: "Show me my new MRR by marketing channel for the last 6 months."
Step 5: Build the Schema
Finally, your technical team assembles the pieces into a Star Schema. They are building the engine that will power your fast, intuitive reports. Thankfully, the modern data stack makes this process efficient. Cloud-native data modeling is now the standard, with 75% of companies expected to modernize their approach by 2025 to keep up with real-time analytics. By following these steps, you’re handing your engineers a business-focused plan that guarantees the model they build will give you the answers you need.
It's All About the Answers
You can spend months crafting the most elegant data model, but if it doesn't help you make smarter decisions, faster, what’s the point? The whole reason you invest in data modeling in a data warehouse is to unlock faster, more intuitive analytics. It’s the solid foundation that makes game-changing tools possible.
Old Way vs. New Way
For years, getting an answer from your data felt like pulling teeth. You’d file a ticket and wait days for an overworked analyst to write custom SQL. Here’s a comparison of that old workflow versus a modern conversational analytics tool.
Old Way (Manual SQL) vs New Way (Statspresso)
Task | The Old Way (Manual SQL & BI Dashboards) | The New Way (Statspresso AI Analyst) |
|---|---|---|
Get an Answer | File a ticket with the data team and wait in a queue. | Ask a question in plain English. |
Time to Insight | Days or weeks, depending on the analyst's backlog. | Seconds. You get a chart or number instantly. |
Expertise Needed | Requires deep knowledge of SQL, the database schema, and BI tools. | Just your own business curiosity. No code required. |
Follow-up Questions | File another ticket and start the process over. | Ask a follow-up question in the same conversation. |
Outcome | A static report or a pre-built (and often outdated) dashboard. | A dynamic, interactive chart and a clear explanation. |
See the difference? This "New Way" isn't magic. It’s the direct result of a well-designed data model. When your data is properly structured, a conversational AI data analyst like Statspresso can translate your plain-English business questions into accurate answers on the spot.
Your Model Makes the AI Smarter
The better your data model, the more powerful the questions you can ask.
A clean data model turns your data warehouse from a passive storage unit into an active, intelligent partner. You can finally skip the SQL and just ask your data a question.
With a solid foundation, you can connect your data source and immediately ask, 'Which marketing channel brought in our top 10% highest-LTV customers?' without any technical setup. The AI already understands the concepts because your model has defined them. Data modeling is about structuring data for answers.
TL;DR: Your Key Takeaways
Modeling is the blueprint: Data modeling organizes your raw data into a logical structure, turning a messy data closet into a useful library.
Focus on business questions: Start by identifying the business processes you need to measure, not with technical details.
Star Schema for speed: For most analytics, the simple, fast Star Schema is the best choice. It prioritizes speed-to-insight over perfect organization.
The model powers the AI: A well-structured data model is what allows a conversational AI analyst like Statspresso to understand your business and answer questions in seconds.
The goal is answers, not perfection: The ultimate purpose of a data model is to help you make smarter decisions, faster. A "good enough" model that gets you quick insights is better than a "perfect" model you wait months for.
Ready to stop waiting for reports and start a conversation with your data? Connect your first data source for free and ask your first question.
You know the answers are in your Shopify, HubSpot, and Postgres data. But trying to piece it all together feels like a mess. Waiting weeks for a data analyst to build a dashboard is a relic of the past. For a busy founder or product manager, this isn't just frustrating—it’s a roadblock to growth.
This is where data modeling in a data warehouse comes in. It’s the blueprint for taking all that raw, messy data and giving it a clear, logical structure that makes it genuinely useful for analysis.
Your Data Is Talking, But You Can’t Understand It
How often have you had a critical business question, only to be told you'll have to wait days—or weeks—for an analyst to build the right dashboard? That gap between question and answer is where opportunities die. The problem isn't the data; it's the chaos. Without a solid blueprint, your data warehouse is just an expensive, disorganized closet.
This guide will break down data modeling in a data warehouse into something you can actually use. We’ll show you how a well-structured data foundation is the key to unlocking the fast, reliable insights your business needs.
Why Good Modeling Is the Secret to Instant Answers
Let's skip the academic definitions. The goal here is simple: to help you ask a question in plain English and get a chart back in seconds. This isn't about turning you into a data engineer. It's about showing you how a well-modeled data warehouse eliminates the bottleneck between you and your data.
When your data is organized logically, new tools can do some incredible things. This is where a conversational AI data analyst like Statspresso shines.
The better your data model, the smarter the AI analyst. A clean structure allows you to skip the SQL and simply ask what you want to know. You get a chart back in seconds.
Once your sales and marketing data are modeled correctly, you can ask a direct business question without ever thinking about code.
Try asking Statspresso: "Show me my top 5 products by revenue this quarter and compare it to last quarter."
This guide gives you the core concepts to have productive conversations with your technical team. Together, you can ensure your data infrastructure is built for speed and clarity from the ground up. Let's get your data warehouse speaking your language.
The Building Blocks of a Smart Data Warehouse
Think of your data warehouse as a massive, unassembled LEGO set. Without a blueprint, all you have is a chaotic pile of bricks. A data model is that blueprint. It’s the thoughtful design that lets you build anything you can imagine, from a simple report to a complex sales forecast.
Data modeling in a data warehouse isn't some abstract technical exercise. It’s the practical process of organizing your business information so you can ask smart questions and, more importantly, get answers you can trust. Let's break down the essential components.
Facts: The Numbers That Matter
Everything starts with facts. These are the quantifiable, numeric values that track your business operations. Think of them as the verbs of your business—the actual events and actions taking place.
Facts are almost always:
Numeric: They are concrete numbers you can add, average, or count.
Event-Driven: Each fact corresponds to a specific business event, like a completed sale, a new user sign-up, or a click on a marketing email.
For an e-commerce store, your facts would be metrics like sales_amount, quantity_sold, and shipping_cost. These are the cold, hard numbers that tell you what’s happening.
A good data model makes these numbers useful. A well-designed fact table transforms raw data into a clear story about your performance—a story a conversational AI data analyst like Statspresso can translate for you in seconds.
Dimensions: The Context That Gives Numbers Meaning
A number on its own is meaningless. A sale of $100 is just... a number. But what if it was a $100 sale made yesterday, in New York, from a first-time customer who bought a blue t-shirt? Suddenly, you have a story.
Those descriptive details—the "who, what, where, when, and why"—are your dimensions. They provide the essential context that brings your facts to life.
Customers: Who made the purchase?
Products: What did they buy?
Geography: Where did the sale happen?
Time: When did the event take place?
Back in the 1990s, Ralph Kimball’s idea of dimensional modeling revolutionized data warehousing by separating measurable fact tables from contextual dimension tables. This design, known as the star schema, made queries faster and remains the foundation for many modern cloud data warehouses today, enabling tools like Statspresso to find patterns instantly without anyone needing to write complex SQL. You can learn more about how this changed data warehouse modeling on Integrate.io.
Grain: Defining Your Level of Detail
The final piece of the puzzle is the grain. The grain simply defines what a single row in your fact table actually represents. It sets the level of detail for your entire analysis.
For instance, is one row in your sales data:
An individual line item on a receipt? (This is a fine grain.)
A customer's total purchase for the day? (This is a coarser grain.)
A store's total sales for the week? (This is a very coarse grain.)
Choosing the right grain is a critical decision in data modeling in a data warehouse. A finer grain gives you incredible detail but creates larger data tables. A coarser grain is fast but limits the questions you can ask. As you think through these building blocks, it’s worth keeping an eye on where the field is headed, including the future of data warehousing in the age of AI.
Try asking Statspresso: "What were my total sales by product category last month?"
Choosing Your Blueprint: Star vs. Snowflake Schemas
Once you’ve got a handle on your facts and dimensions, the next big decision is how to arrange them. This is where you’ll find two battle-tested blueprints: the Star Schema and the Snowflake Schema. Think of this choice as picking between a sprinter and a meticulous organizer.
The Star Schema: Built for Speed
The Star Schema is the sprinter. It's simple, powerful, and designed for one goal: getting answers out of your data as fast as possible. The design is refreshingly straightforward—a central fact table holding your core numbers is directly linked to each of its descriptive dimension tables.
Fewer connections mean your queries run much faster. This is exactly what you want for self-service analytics and what makes tools like a conversational AI analyst truly shine. The name comes from its diagram, which looks like a star with the fact table at its center. It’s a denormalized model, which just means it allows for some repetitive data in exchange for raw query performance. For most modern analytics, the Star Schema is the hands-down winner. We dig deeper into this essential structure in our guide to the Star Schema data model.
This diagram gives you a clear visual of how facts, dimensions, and grain—the building blocks we've been discussing—all fit together to form a cohesive model.
As you can see, dimensions provide the crucial "who, what, and where" context for your metrics (the facts), and your choice of facts sets the level of detail (the grain) for your analysis.
The Snowflake Schema: Built for Organization
The Snowflake Schema is the meticulous organizer. It takes the Star model and applies normalization, breaking down large dimension tables into smaller, related sub-tables to eliminate data redundancy. While this creates a beautifully organized and storage-efficient structure, that organization comes with a trade-off: query speed.
To answer a question, the database has to perform a series of complex joins, hopping from one small table to the next. This can dramatically slow down queries and make the data harder for both humans and analytics tools to navigate.
Star Schema vs. Snowflake Schema: Which Is Right For You?
A decade ago, when data storage was incredibly expensive, the space-saving benefits of the Snowflake Schema made it an attractive option. But with the low cost of modern cloud data warehouses like Snowflake, BigQuery, and Redshift, that advantage has largely disappeared. Today, the priority is speed-to-insight.
Attribute | Star Schema (The Sprinter) | Snowflake Schema (The Organizer) |
|---|---|---|
Query Speed | Fast. Fewer, simpler joins mean quick answers. | Slower. More joins increase query complexity and time. |
Structure | Simple & Intuitive. Easy for analysts and AI to understand. | Complex. A web of tables can be difficult to navigate. |
Maintenance | Easier. Fewer tables to manage and update. | Harder. More tables and relationships add overhead. |
Storage | Higher (due to data redundancy). | Lower (highly normalized). |
Best For | Most BI & Analytics. Perfect for fast, self-serve insights. | Niche cases with very complex, multi-level hierarchies. |
The Star Schema provides the ideal foundation for a conversational AI analyst like Statspresso. It creates a clean, fast, and understandable structure, empowering you to simply ask a question and get a chart back in seconds.
Try asking Statspresso: "Compare our revenue by product_category and customer_region for Q3."
The Modern Approach: Data Vault and Cloud-Native Modeling
Star and Snowflake schemas are the bedrock of data warehousing, but as data sources multiply, modern approaches are emerging to handle this new reality: Data Vault and cloud-native modeling. These represent a different way of thinking about building data infrastructure—one built for flexibility, historical accuracy, and massive scale.
Data Vault: The Unchangeable Historical Archive
Think of your data warehouse like a financial ledger. You never erase a previous transaction; you add a new one to reflect a change. That’s the idea behind the Data Vault model. It's built to be an "audit-proof" system of record.
Instead of facts and dimensions, a Data Vault uses three core building blocks:
Hubs: Core business concepts like
CustomersorProducts.Links: Connections that show how Hubs relate to each other.
Satellites: Descriptive details that "orbit" Hubs and Links. When an attribute changes, a new Satellite record is added with a timestamp, preserving a complete history.
This "insert-only" design means you never lose a single piece of your data's history. It's a game-changer for regulated industries. Adoption of Data Vault modeling is projected to surge in enterprise settings by 2026, as it offers total historical traceability. This agility allows a platform like Statspresso to generate trustworthy charts from a single source of truth. You can read more about these top data warehouse trends and their impact on Softweb Solutions.
Cloud-Native Modeling: Built for Infinite Scale
Cloud-native modeling is a mindset born from the power of modern platforms like Snowflake, BigQuery, and Redshift. For years, modelers obsessed with saving storage space. Today, storage is cheap, but compute power—the speed at which you can answer a question—is everything.
Cloud-native modeling fully embraces architectures that separate storage from compute. This lets you store petabytes of data affordably and, when you need to run a query, spin up a powerful compute cluster to get the answer in seconds.
This changes the trade-offs:
We can build much wider, denormalized tables (like in a Star Schema) without worrying about storage costs.
We can easily ingest and query semi-structured data like JSON.
We can scale analytics power up or down on demand.
This philosophy is less about a single, rigid schema and more about designing for raw speed, flexibility, and scalability.
This is exactly the kind of environment where a conversational AI data analyst like Statspresso thrives. When you combine a cloud-native model with on-demand compute, there’s no more waiting.
Try asking Statspresso: "Compare customer lifetime value for users acquired through our last three campaigns as a bar chart."
A question like that might have taken days on an older system. Now, it's a simple conversation. That's the real-world payoff of embracing modern data modeling in a data warehouse.
From Theory to Action: A 5-Step Modeling Guide
Alright, let's get practical. Building a great data model for a data warehouse is a straightforward process that begins and ends with your business questions. This five-step guide will help you lead the conversation with your technical team.
Step 1: Identify Business Processes
First: what are we trying to measure? Pinpoint the core activities that drive your business. For a typical SaaS business, the list is probably familiar:
User Sign-ups
Subscription Activations
Feature Usage Events
Customer Support Tickets
Marketing Campaign Clicks
Pick one process to start with, like subscription activations. Trying to model the entire business at once is a classic rookie mistake.
Step 2: Declare the Grain
Now for the most important step: declaring the grain. This is your decision about what a single row in your fact table will represent. It defines the level of detail for your analysis. For "subscription activation," what could the grain be?
One row per individual subscription activation. (Detailed.)
One row per customer, per day. (Summarized.)
One row per pricing plan, per month. (High-level.)
Getting the grain right is everything. When in doubt, lean toward the most detailed (or "atomic") grain possible. You can always roll up detailed data, but you can never break down summarized data.
For a structured framework, check out this guide on how to design database schema.
Step 3: Identify Dimensions
Next question: "How will I want to filter and group this data?" The answers are your dimensions. For our subscription activation event, the dimensions practically name themselves:
Customer: Who activated? (User ID, company size)
Time: When did it happen? (Date, month, quarter)
Product: What plan did they buy? (Plan name, price)
Marketing Channel: How did they find us? (Google Ads, referral)
These dimensions become the powerful levers you pull to slice and dice your data.
Step 4: Identify Facts
Facts are the numbers—the quantitative measurements associated with your business process. For our grain of "one row per subscription activation," the facts are obvious:
Monthly Recurring Revenue (MRR): The value of the new subscription.
Activation Count: This is often just a "1" on every row, making it easy to count activations.
Discount Amount: If a discount was applied, how much was it?
When you combine these numbers with your dimensions, a tool like Statspresso can tell the story.
Try asking Statspresso: "Show me my new MRR by marketing channel for the last 6 months."
Step 5: Build the Schema
Finally, your technical team assembles the pieces into a Star Schema. They are building the engine that will power your fast, intuitive reports. Thankfully, the modern data stack makes this process efficient. Cloud-native data modeling is now the standard, with 75% of companies expected to modernize their approach by 2025 to keep up with real-time analytics. By following these steps, you’re handing your engineers a business-focused plan that guarantees the model they build will give you the answers you need.
It's All About the Answers
You can spend months crafting the most elegant data model, but if it doesn't help you make smarter decisions, faster, what’s the point? The whole reason you invest in data modeling in a data warehouse is to unlock faster, more intuitive analytics. It’s the solid foundation that makes game-changing tools possible.
Old Way vs. New Way
For years, getting an answer from your data felt like pulling teeth. You’d file a ticket and wait days for an overworked analyst to write custom SQL. Here’s a comparison of that old workflow versus a modern conversational analytics tool.
Old Way (Manual SQL) vs New Way (Statspresso)
Task | The Old Way (Manual SQL & BI Dashboards) | The New Way (Statspresso AI Analyst) |
|---|---|---|
Get an Answer | File a ticket with the data team and wait in a queue. | Ask a question in plain English. |
Time to Insight | Days or weeks, depending on the analyst's backlog. | Seconds. You get a chart or number instantly. |
Expertise Needed | Requires deep knowledge of SQL, the database schema, and BI tools. | Just your own business curiosity. No code required. |
Follow-up Questions | File another ticket and start the process over. | Ask a follow-up question in the same conversation. |
Outcome | A static report or a pre-built (and often outdated) dashboard. | A dynamic, interactive chart and a clear explanation. |
See the difference? This "New Way" isn't magic. It’s the direct result of a well-designed data model. When your data is properly structured, a conversational AI data analyst like Statspresso can translate your plain-English business questions into accurate answers on the spot.
Your Model Makes the AI Smarter
The better your data model, the more powerful the questions you can ask.
A clean data model turns your data warehouse from a passive storage unit into an active, intelligent partner. You can finally skip the SQL and just ask your data a question.
With a solid foundation, you can connect your data source and immediately ask, 'Which marketing channel brought in our top 10% highest-LTV customers?' without any technical setup. The AI already understands the concepts because your model has defined them. Data modeling is about structuring data for answers.
TL;DR: Your Key Takeaways
Modeling is the blueprint: Data modeling organizes your raw data into a logical structure, turning a messy data closet into a useful library.
Focus on business questions: Start by identifying the business processes you need to measure, not with technical details.
Star Schema for speed: For most analytics, the simple, fast Star Schema is the best choice. It prioritizes speed-to-insight over perfect organization.
The model powers the AI: A well-structured data model is what allows a conversational AI analyst like Statspresso to understand your business and answer questions in seconds.
The goal is answers, not perfection: The ultimate purpose of a data model is to help you make smarter decisions, faster. A "good enough" model that gets you quick insights is better than a "perfect" model you wait months for.
Ready to stop waiting for reports and start a conversation with your data? Connect your first data source for free and ask your first question.