A Guide to the Best Data Exploration Tool in 2026

You've got a mountain of data from Shopify, HubSpot, and your own product database. So why does getting a straight answer feel like pulling teeth? Waiting weeks for a data analyst to build a dashboard is a relic of the past. This isn't a data problem. It's an access problem, and it’s costing you time and money.
TL;DR: The Ultimate Cheat Sheet
For those of you who just want the highlights, here's the entire guide boiled down:
The Problem: You have plenty of data but no easy way to get answers from it. Waiting on analysts or data teams creates a major bottleneck.
The Solution: A modern data exploration tool that works like a search engine for your company’s numbers, letting anyone ask questions in plain English.
The "Old Way": Slow, manual work that depends on SQL experts and produces static dashboards that are often outdated by the time you see them.
The "New Way": Fast, conversational queries using a Conversational AI Data Analyst like Statspresso, which builds interactive charts and provides insights in seconds.
Must-Have Features: A genuinely no-code interface, a wide range of data connectors, automatic visualizations, and AI-driven insights.
Target Action: Move from reading about the problem to solving it. Connect your first data source to Statspresso for free and ask your first question.
Why You’re Drowning in Data but Starving for Answers

If you're a founder, product manager, or marketing lead, that probably hits close to home. Your company is sitting on a goldmine of information, but you feel like you're stuck on the sidelines, unable to use it. The old model of waiting for an analyst to build a dashboard just doesn't cut it anymore.
A lot of the time, the "drowning in data" feeling comes from having your information scattered across different, disconnected systems. Getting your house in order with solid master data management is a huge step toward creating a single source of truth. But even with perfect data, the real bottleneck is still there: access.
The Old, Slow Bottleneck
For years, getting insights meant filing a ticket with the data team. This kicked off a frustrating game of telephone where your urgent business question got lost in translation. The whole process was slow, rigid, and completely disconnected from the fast-paced reality of running a business.
This manual grind is a massive resource drain. A 2026 Forrester study revealed that data analysts waste over 20 hours a week on manual reporting tasks that could be automated. That’s half their time spent on work that doesn't move the needle.
The New Way: Get Answers Instantly
So, what if you could just skip the line entirely? Modern data exploration tools are like having a personal analyst on your team, ready to answer questions the moment you have them. This is where a Conversational AI Data Analyst like Statspresso completely changes the game.
Instead of writing complex SQL or waiting for a report, you just ask your question in plain English. This approach finally puts the power of data into the hands of the people who actually need it to make decisions.
Skip the SQL. Just ask your data a question and get a chart in seconds. This isn't some far-off dream; it's the new standard for getting work done. It empowers your team to move from curiosity to clarity in an instant.
With this kind of immediate access, you can test a hypothesis on the fly, dig deeper into a surprising trend, and make decisions with real confidence.
Try asking Statspresso: "Show me my revenue by month for the last year as a bar chart."
You no longer have to guess or wait. You just ask.
So, What Exactly Is a Data Exploration Tool?
Think of a data exploration tool as a powerful, company-wide search engine for your own internal data. It's less like a spreadsheet and more like having a sharp detective on your team who can instantly spot unusual patterns (outliers), see how different metrics influence each other (correlations), and piece together a clear story from mountains of information.
Instead of wrestling with complex formulas or waiting for an analyst to run a SQL query, you can just ask your question in plain English. The tool does the heavy lifting and brings back a clear, visual answer. It's designed to be an interactive conversation with your data, letting you ask follow-up questions and dig deeper whenever a new idea strikes.
This is all about breaking free from the old world of static, pre-built dashboards. You know the ones—they often create more questions than they actually answer. Real data exploration gives you the freedom to poke around, test a hunch, and follow your curiosity down any path you choose.
From Static Reports to Dynamic Conversations
Traditional business intelligence is a bit like being handed a printed map. It's great if you're following a pre-planned route, but what happens if you see something interesting just off the main road? You're stuck.
A modern data exploration tool, on the other hand, is your own personal GPS with a live satellite feed. You can ask for a different route on the fly, zoom in on a specific neighborhood, or point to something and ask, "what's that over there?" and get an instant answer. This live interactivity is what truly separates simple reporting from genuine conversational analytics.
A Conversational AI Data Analyst like Statspresso brings this new, faster way of working to life. It’s built to clear away the technical roadblocks so you can get straight to the insights you need to make a decision.
The market is clearly shifting to meet this demand for smarter, more accessible tools. The global GenBI (Generative Business Intelligence) market is on track to hit $28 billion by 2030, largely driven by AI integrations that automatically uncover trends you'd otherwise miss. You can discover more about these market trends and their impact on data tools. For a deeper dive, check out how specialized pricing analytic software can turn raw numbers into smart business strategies.
How Conversational Analytics Actually Works
The real magic here is in the workflow. The whole process is designed for speed and simplicity, putting the power of data analysis directly into the hands of non-technical people.
Here’s what a typical exploration session looks like in a visual analytics tool.
This chart, for example, could be plotting your customer segments against how often they make a purchase. Right away, you can see distinct clusters and a few outliers that deserve a closer look—something a flat table of numbers would never reveal so clearly.
From here, you could ask a direct follow-up question.
Try asking Statspresso: "Which of these customer segments has the highest lifetime value?"
It's this ability to go from a 30,000-foot view to a granular, specific question in seconds that defines a modern data exploration tool. You get to skip the SQL, avoid the support ticket queue, and get the answers you need, right when you need them.
Data Exploration: The Old Way vs. The New Way
Let's be honest—the old way of doing data analysis was painful. It was a slow, expensive, and frustrating process built around specialized technical teams, complicated software, and long waits for even the simplest of answers. That entire model is quickly becoming a relic.
A modern data exploration tool flips that system on its head. Instead of relying on a human translator to write SQL, you can finally talk directly to your data in plain English. This isn't just about saving time; it's about changing who gets access to the answers that drive your business forward.
The goal is to get from a question to an insight as quickly as possible, without unnecessary steps getting in the way.
This simple flow—moving straight from data to question to insight—is what modern tools make possible. All the friction and manual steps of traditional analysis are cut out.
Data Exploration: Old Way vs. New Way
The difference between the two approaches is night and day. The traditional workflow was built on bottlenecks, creating a system where business users were entirely dependent on data experts. A Conversational AI Data Analyst like Statspresso removes those dependencies entirely.
Phase | The Old Way (Manual SQL) | The New Way (Statspresso) |
|---|---|---|
Asking a Question | Submit a detailed ticket to the data team, hoping your request is understood. | Ask a question in plain English, just like you would ask a colleague. |
The Wait | Days or weeks. Your request sits in a queue behind other priorities. | Seconds. The AI queries the database and generates a chart instantly. |
Getting the Answer | Receive a static dashboard or a single chart via email. | Get an interactive chart right in the app. You can click, filter, and drill down. |
Follow-Up Questions | The chart raises new questions. You file another ticket and wait all over again. | Ask a follow-up question immediately. "Now show me that by region." |
Who Gets to Explore? | Only SQL experts and trained data analysts. | Everyone. Founders, product managers, and marketers can self-serve. |
The old way is defined by handoffs and waiting. Every step requires another person and another delay, turning a simple curiosity into a multi-day project. It's a system that actively discourages exploration. For a deeper look at the landscape, our The Guide to SQL Charting breaks down how different tools stack up.
Why This Shift Matters for Your Team
The new way isn't just faster; it's fundamentally more effective. It fosters a culture of curiosity where anyone on your team can test a hypothesis or validate a gut feeling with real data—in the moment.
Think about it. When your marketing lead can ask, "Which of our blog posts drove the most signups last month?" and get an answer instantly, they can make smarter decisions about their content strategy today, not next week.
This shift transforms data from a guarded resource into a company-wide utility. It's like switching from a librarian who has to fetch every book for you to having the entire library searchable from your own desk.
With a Conversational AI Data Analyst, the person with the business context is the same person doing the analysis. This closes the gap between question and insight, allowing for a fluid, continuous dialogue with your data.
Try asking Statspresso: "Compare our user signups from last month to this month by acquisition channel as a line chart."
You're no longer just a passive consumer of reports; you're an active participant in the discovery process.
Must-Have Features for a Modern Data Exploration Tool
Picking a new tool for your team can feel like navigating a minefield. Most platforms aren't built for busy, non-technical folks who don't have time to learn SQL. You just need to get from a question to an answer, fast.
So, forget the endless checklist of features. It’s about zeroing in on the capabilities that genuinely make your life easier and get you to a decision without waiting in line for an engineer.
1. A True No-Code Interface
Let's start with the absolute deal-breaker: a genuinely no-code, conversational interface. This means anyone on your team should be able to ask complex business questions in plain English, just like they’d ask a colleague on Slack. No more dragging and dropping a dozen fields just to build a simple chart.
A true no-code experience means you type a question, and you get an answer. It's that simple. If you have to sit through hours of training just to figure out your monthly recurring revenue, the tool has already failed you.
This is the whole point of a Conversational AI Data Analyst like Statspresso. The goal is to make data analysis as natural as having a conversation.
2. Broad Data Source Connectivity
Your data is scattered. It’s in your Postgres database, your Shopify store, your HubSpot CRM, and probably a half-dozen other places. A tool is only useful if it can tap into all those sources without a massive engineering headache.
Look for a platform with pre-built, one-click connectors for the services you rely on every day. Key connectors to look for:
SaaS Apps: Shopify, HubSpot, Stripe, Salesforce
3. Automated Visualization
A great tool does more than just spit out numbers; it shows you what they mean. When you ask to compare something over time, you should instantly get a line chart. This automated visualization is a massive time-saver and makes insights immediately clear.
A smart tool understands the intent behind your question and builds the right chart for you in seconds.
Try asking Statspresso: "Compare our user signups from last month to this month by acquisition channel as a line chart."
4. Simple Collaboration and Sharing
Data exploration isn't a solo sport. An insight is only as good as the action it inspires. Any tool you choose must make it incredibly simple to share what you've found and start a conversation. This means you should be able to:
Send a direct link to a specific chart or dashboard.
Add a new finding to a shared space with one click.
Leave comments on a visual to kick off a discussion.
Export charts to Slack, email, or PDFs for your next meeting.
Real-World Use Cases for Growth-Focused Teams
Knowing what a data exploration tool is doesn't mean much until you see what it can do. The real value isn't in fancy dashboards; it’s in getting fast, straightforward answers to the urgent questions that keep you up at night.
Use Case for Founders: Cash Flow Clarity
As a founder, cash is everything. You need a constant, real-time pulse on the financial health of your company. But waiting for monthly reports is like driving while looking in the rearview mirror.
Instead of wrestling with spreadsheets, you can just ask what you need to know.
Try asking Statspresso: "Show me my monthly recurring revenue and burn rate for the last six months."
In seconds, you get a clear chart mapping out your two most critical financial metrics. This isn't just data; it's the ability to spot a potential cash crunch weeks in advance.
Use Case for Product Managers: Feature Adoption Insights
Your team just spent weeks building a new feature. Now for the big question: is anyone actually using it? Traditionally, finding out meant filing a ticket and waiting for an engineer to run a custom query.
With a Conversational AI Data Analyst like Statspresso, you can find out for yourself in seconds.
Try asking Statspresso: "What percentage of users who signed up in May have used our new Zapier integration?"
The answer tells you instantly whether your launch was a hit or if you need to focus more on user onboarding. It’s the difference between guessing and knowing the impact of your work.
Use Case for Marketers: Optimized Campaign Spend
Your team is running ads on Google, campaigns on LinkedIn, and sending out emails. Leads are coming in, but which channel is really delivering the most value?
This is where quick data exploration becomes essential. In fact, market reports from 2026 show that 70% of teams adopting automated BI say exploration features are critical for their analysis. You can learn more about how data exploration features drive insights.
Try asking Statspresso: "Which marketing channel had the lowest customer acquisition cost last quarter?"
Getting an immediate answer allows you to reallocate your budget with confidence. A simple question, answered in seconds, can save you thousands and seriously improve your marketing ROI.
Get Your First Answer from Your Data in 5 Minutes

Alright, enough with the theory. It's time to actually do something with your own data. With a modern data exploration tool, you can get a real answer in less time than it takes to brew a pot of coffee. This is the moment you go from reading about a solution to seeing it work for you.
Your Quick-Start Guide to Instant Insights
The new way, which relies on a Conversational AI Data Analyst like Statspresso, is designed for immediate results. Here's how you can get from signup to your first chart in under five minutes.
Sign Up for Free: Kick off a free trial. No credit card, no sales pitch.
Connect Your Data: Use a one-click connector for a source you already use, like Postgres, Shopify, or HubSpot.
Authorize Securely: You'll grant secure, read-only access. Your original data is never changed or written to, keeping it completely safe.
Ask Your First Question: Just type a question in plain English, like the examples above.
That’s it. In seconds, you'll see a chart built from your data, not some canned demo.
The answers you need to grow your business are sitting right there in your data. It's time to stop waiting for someone else to find them for you. You can discover more about the history of data tools and see the trends that led us here.
Frequently Asked Questions
You're busy, you've got questions, and you need straight answers. We get it. Here are some of the most common things we hear from founders, PMs, and marketers.
How secure is my data?
This is the most important question. Statspresso is fully SOC 2 compliant, meaning our security practices have passed a rigorous, independent audit. Critically, we connect to your databases using read-only access. Our tool can look at your data to find answers, but it can never change, update, or delete anything.
Do I need a data warehouse to use this?
Absolutely not. You don’t need to kick off a massive engineering project just to get answers. Modern tools like Statspresso use direct, one-click connectors to link your existing business apps (like Shopify and HubSpot) in minutes. Our Conversational AI Data Analyst then queries the data right where it lives.
How is this different from Google Analytics or my dashboards?
Your existing dashboards and tools like Google Analytics are fantastic for tracking the "what"—things like daily active users or total revenue. A true data exploration tool is built to help you find the "why" behind those numbers. It’s designed for asking all the ad-hoc questions that pop up during the day.
Is this going to replace my data analyst?
Nope. It’s going to make them even more valuable. For your data analysts, it automates the flood of repetitive questions they get bombarded with. This frees them up to dig into deeper, more strategic work. For everyone else, it provides immediate, self-serve access to answers, ending the constant bottlenecks.
The answers you need to grow are already in your data. Statspresso just helps you find them in seconds.
Ready to stop waiting? Connect your first data source for free and ask your first question.
You've got a mountain of data from Shopify, HubSpot, and your own product database. So why does getting a straight answer feel like pulling teeth? Waiting weeks for a data analyst to build a dashboard is a relic of the past. This isn't a data problem. It's an access problem, and it’s costing you time and money.
TL;DR: The Ultimate Cheat Sheet
For those of you who just want the highlights, here's the entire guide boiled down:
The Problem: You have plenty of data but no easy way to get answers from it. Waiting on analysts or data teams creates a major bottleneck.
The Solution: A modern data exploration tool that works like a search engine for your company’s numbers, letting anyone ask questions in plain English.
The "Old Way": Slow, manual work that depends on SQL experts and produces static dashboards that are often outdated by the time you see them.
The "New Way": Fast, conversational queries using a Conversational AI Data Analyst like Statspresso, which builds interactive charts and provides insights in seconds.
Must-Have Features: A genuinely no-code interface, a wide range of data connectors, automatic visualizations, and AI-driven insights.
Target Action: Move from reading about the problem to solving it. Connect your first data source to Statspresso for free and ask your first question.
Why You’re Drowning in Data but Starving for Answers
If you're a founder, product manager, or marketing lead, that probably hits close to home. Your company is sitting on a goldmine of information, but you feel like you're stuck on the sidelines, unable to use it. The old model of waiting for an analyst to build a dashboard just doesn't cut it anymore.
A lot of the time, the "drowning in data" feeling comes from having your information scattered across different, disconnected systems. Getting your house in order with solid master data management is a huge step toward creating a single source of truth. But even with perfect data, the real bottleneck is still there: access.
The Old, Slow Bottleneck
For years, getting insights meant filing a ticket with the data team. This kicked off a frustrating game of telephone where your urgent business question got lost in translation. The whole process was slow, rigid, and completely disconnected from the fast-paced reality of running a business.
This manual grind is a massive resource drain. A 2026 Forrester study revealed that data analysts waste over 20 hours a week on manual reporting tasks that could be automated. That’s half their time spent on work that doesn't move the needle.
The New Way: Get Answers Instantly
So, what if you could just skip the line entirely? Modern data exploration tools are like having a personal analyst on your team, ready to answer questions the moment you have them. This is where a Conversational AI Data Analyst like Statspresso completely changes the game.
Instead of writing complex SQL or waiting for a report, you just ask your question in plain English. This approach finally puts the power of data into the hands of the people who actually need it to make decisions.
Skip the SQL. Just ask your data a question and get a chart in seconds. This isn't some far-off dream; it's the new standard for getting work done. It empowers your team to move from curiosity to clarity in an instant.
With this kind of immediate access, you can test a hypothesis on the fly, dig deeper into a surprising trend, and make decisions with real confidence.
Try asking Statspresso: "Show me my revenue by month for the last year as a bar chart."
You no longer have to guess or wait. You just ask.
So, What Exactly Is a Data Exploration Tool?
Think of a data exploration tool as a powerful, company-wide search engine for your own internal data. It's less like a spreadsheet and more like having a sharp detective on your team who can instantly spot unusual patterns (outliers), see how different metrics influence each other (correlations), and piece together a clear story from mountains of information.
Instead of wrestling with complex formulas or waiting for an analyst to run a SQL query, you can just ask your question in plain English. The tool does the heavy lifting and brings back a clear, visual answer. It's designed to be an interactive conversation with your data, letting you ask follow-up questions and dig deeper whenever a new idea strikes.
This is all about breaking free from the old world of static, pre-built dashboards. You know the ones—they often create more questions than they actually answer. Real data exploration gives you the freedom to poke around, test a hunch, and follow your curiosity down any path you choose.
From Static Reports to Dynamic Conversations
Traditional business intelligence is a bit like being handed a printed map. It's great if you're following a pre-planned route, but what happens if you see something interesting just off the main road? You're stuck.
A modern data exploration tool, on the other hand, is your own personal GPS with a live satellite feed. You can ask for a different route on the fly, zoom in on a specific neighborhood, or point to something and ask, "what's that over there?" and get an instant answer. This live interactivity is what truly separates simple reporting from genuine conversational analytics.
A Conversational AI Data Analyst like Statspresso brings this new, faster way of working to life. It’s built to clear away the technical roadblocks so you can get straight to the insights you need to make a decision.
The market is clearly shifting to meet this demand for smarter, more accessible tools. The global GenBI (Generative Business Intelligence) market is on track to hit $28 billion by 2030, largely driven by AI integrations that automatically uncover trends you'd otherwise miss. You can discover more about these market trends and their impact on data tools. For a deeper dive, check out how specialized pricing analytic software can turn raw numbers into smart business strategies.
How Conversational Analytics Actually Works
The real magic here is in the workflow. The whole process is designed for speed and simplicity, putting the power of data analysis directly into the hands of non-technical people.
Here’s what a typical exploration session looks like in a visual analytics tool.
This chart, for example, could be plotting your customer segments against how often they make a purchase. Right away, you can see distinct clusters and a few outliers that deserve a closer look—something a flat table of numbers would never reveal so clearly.
From here, you could ask a direct follow-up question.
Try asking Statspresso: "Which of these customer segments has the highest lifetime value?"
It's this ability to go from a 30,000-foot view to a granular, specific question in seconds that defines a modern data exploration tool. You get to skip the SQL, avoid the support ticket queue, and get the answers you need, right when you need them.
Data Exploration: The Old Way vs. The New Way
Let's be honest—the old way of doing data analysis was painful. It was a slow, expensive, and frustrating process built around specialized technical teams, complicated software, and long waits for even the simplest of answers. That entire model is quickly becoming a relic.
A modern data exploration tool flips that system on its head. Instead of relying on a human translator to write SQL, you can finally talk directly to your data in plain English. This isn't just about saving time; it's about changing who gets access to the answers that drive your business forward.
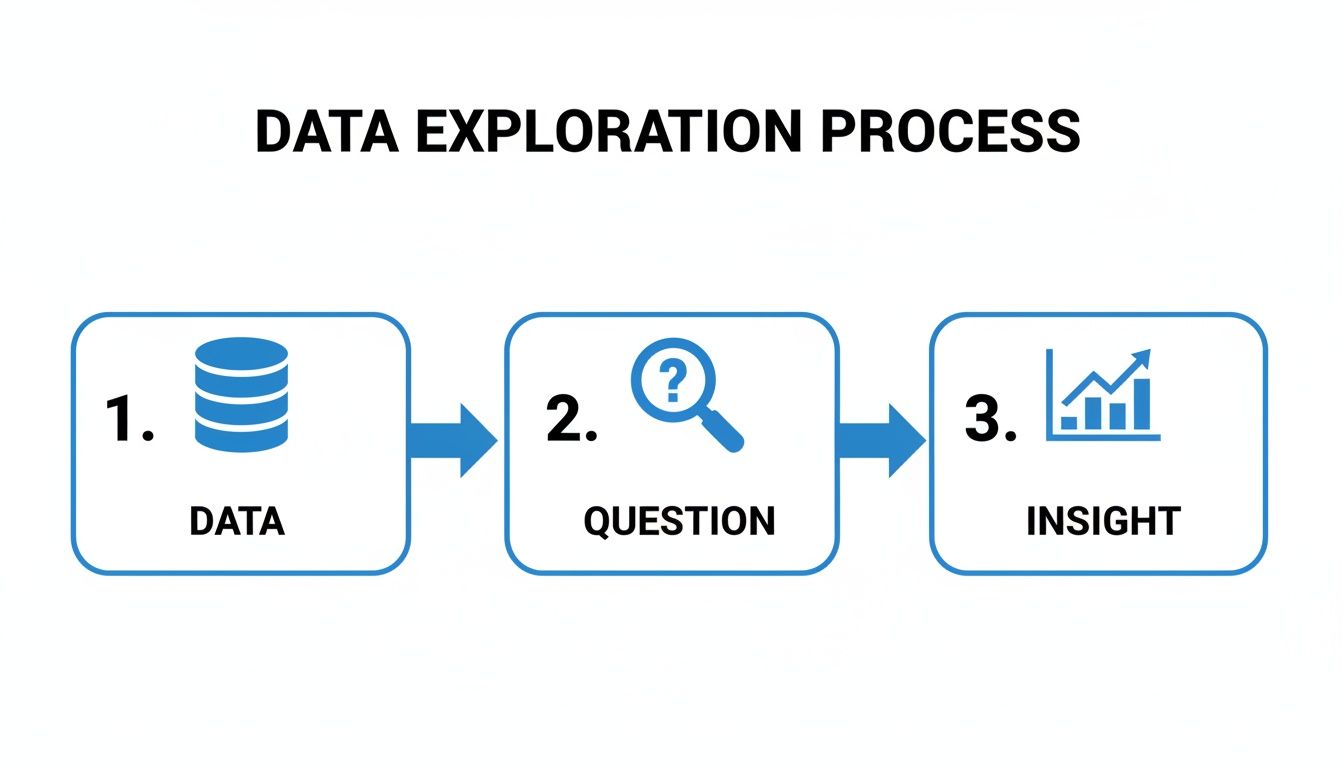
The goal is to get from a question to an insight as quickly as possible, without unnecessary steps getting in the way.
This simple flow—moving straight from data to question to insight—is what modern tools make possible. All the friction and manual steps of traditional analysis are cut out.
Data Exploration: Old Way vs. New Way
The difference between the two approaches is night and day. The traditional workflow was built on bottlenecks, creating a system where business users were entirely dependent on data experts. A Conversational AI Data Analyst like Statspresso removes those dependencies entirely.
Phase | The Old Way (Manual SQL) | The New Way (Statspresso) |
|---|---|---|
Asking a Question | Submit a detailed ticket to the data team, hoping your request is understood. | Ask a question in plain English, just like you would ask a colleague. |
The Wait | Days or weeks. Your request sits in a queue behind other priorities. | Seconds. The AI queries the database and generates a chart instantly. |
Getting the Answer | Receive a static dashboard or a single chart via email. | Get an interactive chart right in the app. You can click, filter, and drill down. |
Follow-Up Questions | The chart raises new questions. You file another ticket and wait all over again. | Ask a follow-up question immediately. "Now show me that by region." |
Who Gets to Explore? | Only SQL experts and trained data analysts. | Everyone. Founders, product managers, and marketers can self-serve. |
The old way is defined by handoffs and waiting. Every step requires another person and another delay, turning a simple curiosity into a multi-day project. It's a system that actively discourages exploration. For a deeper look at the landscape, our The Guide to SQL Charting breaks down how different tools stack up.
Why This Shift Matters for Your Team
The new way isn't just faster; it's fundamentally more effective. It fosters a culture of curiosity where anyone on your team can test a hypothesis or validate a gut feeling with real data—in the moment.
Think about it. When your marketing lead can ask, "Which of our blog posts drove the most signups last month?" and get an answer instantly, they can make smarter decisions about their content strategy today, not next week.
This shift transforms data from a guarded resource into a company-wide utility. It's like switching from a librarian who has to fetch every book for you to having the entire library searchable from your own desk.
With a Conversational AI Data Analyst, the person with the business context is the same person doing the analysis. This closes the gap between question and insight, allowing for a fluid, continuous dialogue with your data.
Try asking Statspresso: "Compare our user signups from last month to this month by acquisition channel as a line chart."
You're no longer just a passive consumer of reports; you're an active participant in the discovery process.
Must-Have Features for a Modern Data Exploration Tool
Picking a new tool for your team can feel like navigating a minefield. Most platforms aren't built for busy, non-technical folks who don't have time to learn SQL. You just need to get from a question to an answer, fast.
So, forget the endless checklist of features. It’s about zeroing in on the capabilities that genuinely make your life easier and get you to a decision without waiting in line for an engineer.
1. A True No-Code Interface
Let's start with the absolute deal-breaker: a genuinely no-code, conversational interface. This means anyone on your team should be able to ask complex business questions in plain English, just like they’d ask a colleague on Slack. No more dragging and dropping a dozen fields just to build a simple chart.
A true no-code experience means you type a question, and you get an answer. It's that simple. If you have to sit through hours of training just to figure out your monthly recurring revenue, the tool has already failed you.
This is the whole point of a Conversational AI Data Analyst like Statspresso. The goal is to make data analysis as natural as having a conversation.
2. Broad Data Source Connectivity
Your data is scattered. It’s in your Postgres database, your Shopify store, your HubSpot CRM, and probably a half-dozen other places. A tool is only useful if it can tap into all those sources without a massive engineering headache.
Look for a platform with pre-built, one-click connectors for the services you rely on every day. Key connectors to look for:
SaaS Apps: Shopify, HubSpot, Stripe, Salesforce
3. Automated Visualization
A great tool does more than just spit out numbers; it shows you what they mean. When you ask to compare something over time, you should instantly get a line chart. This automated visualization is a massive time-saver and makes insights immediately clear.
A smart tool understands the intent behind your question and builds the right chart for you in seconds.
Try asking Statspresso: "Compare our user signups from last month to this month by acquisition channel as a line chart."
4. Simple Collaboration and Sharing
Data exploration isn't a solo sport. An insight is only as good as the action it inspires. Any tool you choose must make it incredibly simple to share what you've found and start a conversation. This means you should be able to:
Send a direct link to a specific chart or dashboard.
Add a new finding to a shared space with one click.
Leave comments on a visual to kick off a discussion.
Export charts to Slack, email, or PDFs for your next meeting.
Real-World Use Cases for Growth-Focused Teams
Knowing what a data exploration tool is doesn't mean much until you see what it can do. The real value isn't in fancy dashboards; it’s in getting fast, straightforward answers to the urgent questions that keep you up at night.
Use Case for Founders: Cash Flow Clarity
As a founder, cash is everything. You need a constant, real-time pulse on the financial health of your company. But waiting for monthly reports is like driving while looking in the rearview mirror.
Instead of wrestling with spreadsheets, you can just ask what you need to know.
Try asking Statspresso: "Show me my monthly recurring revenue and burn rate for the last six months."
In seconds, you get a clear chart mapping out your two most critical financial metrics. This isn't just data; it's the ability to spot a potential cash crunch weeks in advance.
Use Case for Product Managers: Feature Adoption Insights
Your team just spent weeks building a new feature. Now for the big question: is anyone actually using it? Traditionally, finding out meant filing a ticket and waiting for an engineer to run a custom query.
With a Conversational AI Data Analyst like Statspresso, you can find out for yourself in seconds.
Try asking Statspresso: "What percentage of users who signed up in May have used our new Zapier integration?"
The answer tells you instantly whether your launch was a hit or if you need to focus more on user onboarding. It’s the difference between guessing and knowing the impact of your work.
Use Case for Marketers: Optimized Campaign Spend
Your team is running ads on Google, campaigns on LinkedIn, and sending out emails. Leads are coming in, but which channel is really delivering the most value?
This is where quick data exploration becomes essential. In fact, market reports from 2026 show that 70% of teams adopting automated BI say exploration features are critical for their analysis. You can learn more about how data exploration features drive insights.
Try asking Statspresso: "Which marketing channel had the lowest customer acquisition cost last quarter?"
Getting an immediate answer allows you to reallocate your budget with confidence. A simple question, answered in seconds, can save you thousands and seriously improve your marketing ROI.
Get Your First Answer from Your Data in 5 Minutes
Alright, enough with the theory. It's time to actually do something with your own data. With a modern data exploration tool, you can get a real answer in less time than it takes to brew a pot of coffee. This is the moment you go from reading about a solution to seeing it work for you.
Your Quick-Start Guide to Instant Insights
The new way, which relies on a Conversational AI Data Analyst like Statspresso, is designed for immediate results. Here's how you can get from signup to your first chart in under five minutes.
Sign Up for Free: Kick off a free trial. No credit card, no sales pitch.
Connect Your Data: Use a one-click connector for a source you already use, like Postgres, Shopify, or HubSpot.
Authorize Securely: You'll grant secure, read-only access. Your original data is never changed or written to, keeping it completely safe.
Ask Your First Question: Just type a question in plain English, like the examples above.
That’s it. In seconds, you'll see a chart built from your data, not some canned demo.
The answers you need to grow your business are sitting right there in your data. It's time to stop waiting for someone else to find them for you. You can discover more about the history of data tools and see the trends that led us here.
Frequently Asked Questions
You're busy, you've got questions, and you need straight answers. We get it. Here are some of the most common things we hear from founders, PMs, and marketers.
How secure is my data?
This is the most important question. Statspresso is fully SOC 2 compliant, meaning our security practices have passed a rigorous, independent audit. Critically, we connect to your databases using read-only access. Our tool can look at your data to find answers, but it can never change, update, or delete anything.
Do I need a data warehouse to use this?
Absolutely not. You don’t need to kick off a massive engineering project just to get answers. Modern tools like Statspresso use direct, one-click connectors to link your existing business apps (like Shopify and HubSpot) in minutes. Our Conversational AI Data Analyst then queries the data right where it lives.
How is this different from Google Analytics or my dashboards?
Your existing dashboards and tools like Google Analytics are fantastic for tracking the "what"—things like daily active users or total revenue. A true data exploration tool is built to help you find the "why" behind those numbers. It’s designed for asking all the ad-hoc questions that pop up during the day.
Is this going to replace my data analyst?
Nope. It’s going to make them even more valuable. For your data analysts, it automates the flood of repetitive questions they get bombarded with. This frees them up to dig into deeper, more strategic work. For everyone else, it provides immediate, self-serve access to answers, ending the constant bottlenecks.
The answers you need to grow are already in your data. Statspresso just helps you find them in seconds.
Ready to stop waiting? Connect your first data source for free and ask your first question.
You've got a mountain of data from Shopify, HubSpot, and your own product database. So why does getting a straight answer feel like pulling teeth? Waiting weeks for a data analyst to build a dashboard is a relic of the past. This isn't a data problem. It's an access problem, and it’s costing you time and money.
TL;DR: The Ultimate Cheat Sheet
For those of you who just want the highlights, here's the entire guide boiled down:
The Problem: You have plenty of data but no easy way to get answers from it. Waiting on analysts or data teams creates a major bottleneck.
The Solution: A modern data exploration tool that works like a search engine for your company’s numbers, letting anyone ask questions in plain English.
The "Old Way": Slow, manual work that depends on SQL experts and produces static dashboards that are often outdated by the time you see them.
The "New Way": Fast, conversational queries using a Conversational AI Data Analyst like Statspresso, which builds interactive charts and provides insights in seconds.
Must-Have Features: A genuinely no-code interface, a wide range of data connectors, automatic visualizations, and AI-driven insights.
Target Action: Move from reading about the problem to solving it. Connect your first data source to Statspresso for free and ask your first question.
Why You’re Drowning in Data but Starving for Answers
If you're a founder, product manager, or marketing lead, that probably hits close to home. Your company is sitting on a goldmine of information, but you feel like you're stuck on the sidelines, unable to use it. The old model of waiting for an analyst to build a dashboard just doesn't cut it anymore.
A lot of the time, the "drowning in data" feeling comes from having your information scattered across different, disconnected systems. Getting your house in order with solid master data management is a huge step toward creating a single source of truth. But even with perfect data, the real bottleneck is still there: access.
The Old, Slow Bottleneck
For years, getting insights meant filing a ticket with the data team. This kicked off a frustrating game of telephone where your urgent business question got lost in translation. The whole process was slow, rigid, and completely disconnected from the fast-paced reality of running a business.
This manual grind is a massive resource drain. A 2026 Forrester study revealed that data analysts waste over 20 hours a week on manual reporting tasks that could be automated. That’s half their time spent on work that doesn't move the needle.
The New Way: Get Answers Instantly
So, what if you could just skip the line entirely? Modern data exploration tools are like having a personal analyst on your team, ready to answer questions the moment you have them. This is where a Conversational AI Data Analyst like Statspresso completely changes the game.
Instead of writing complex SQL or waiting for a report, you just ask your question in plain English. This approach finally puts the power of data into the hands of the people who actually need it to make decisions.
Skip the SQL. Just ask your data a question and get a chart in seconds. This isn't some far-off dream; it's the new standard for getting work done. It empowers your team to move from curiosity to clarity in an instant.
With this kind of immediate access, you can test a hypothesis on the fly, dig deeper into a surprising trend, and make decisions with real confidence.
Try asking Statspresso: "Show me my revenue by month for the last year as a bar chart."
You no longer have to guess or wait. You just ask.
So, What Exactly Is a Data Exploration Tool?
Think of a data exploration tool as a powerful, company-wide search engine for your own internal data. It's less like a spreadsheet and more like having a sharp detective on your team who can instantly spot unusual patterns (outliers), see how different metrics influence each other (correlations), and piece together a clear story from mountains of information.
Instead of wrestling with complex formulas or waiting for an analyst to run a SQL query, you can just ask your question in plain English. The tool does the heavy lifting and brings back a clear, visual answer. It's designed to be an interactive conversation with your data, letting you ask follow-up questions and dig deeper whenever a new idea strikes.
This is all about breaking free from the old world of static, pre-built dashboards. You know the ones—they often create more questions than they actually answer. Real data exploration gives you the freedom to poke around, test a hunch, and follow your curiosity down any path you choose.
From Static Reports to Dynamic Conversations
Traditional business intelligence is a bit like being handed a printed map. It's great if you're following a pre-planned route, but what happens if you see something interesting just off the main road? You're stuck.
A modern data exploration tool, on the other hand, is your own personal GPS with a live satellite feed. You can ask for a different route on the fly, zoom in on a specific neighborhood, or point to something and ask, "what's that over there?" and get an instant answer. This live interactivity is what truly separates simple reporting from genuine conversational analytics.
A Conversational AI Data Analyst like Statspresso brings this new, faster way of working to life. It’s built to clear away the technical roadblocks so you can get straight to the insights you need to make a decision.
The market is clearly shifting to meet this demand for smarter, more accessible tools. The global GenBI (Generative Business Intelligence) market is on track to hit $28 billion by 2030, largely driven by AI integrations that automatically uncover trends you'd otherwise miss. You can discover more about these market trends and their impact on data tools. For a deeper dive, check out how specialized pricing analytic software can turn raw numbers into smart business strategies.
How Conversational Analytics Actually Works
The real magic here is in the workflow. The whole process is designed for speed and simplicity, putting the power of data analysis directly into the hands of non-technical people.
Here’s what a typical exploration session looks like in a visual analytics tool.
This chart, for example, could be plotting your customer segments against how often they make a purchase. Right away, you can see distinct clusters and a few outliers that deserve a closer look—something a flat table of numbers would never reveal so clearly.
From here, you could ask a direct follow-up question.
Try asking Statspresso: "Which of these customer segments has the highest lifetime value?"
It's this ability to go from a 30,000-foot view to a granular, specific question in seconds that defines a modern data exploration tool. You get to skip the SQL, avoid the support ticket queue, and get the answers you need, right when you need them.
Data Exploration: The Old Way vs. The New Way
Let's be honest—the old way of doing data analysis was painful. It was a slow, expensive, and frustrating process built around specialized technical teams, complicated software, and long waits for even the simplest of answers. That entire model is quickly becoming a relic.
A modern data exploration tool flips that system on its head. Instead of relying on a human translator to write SQL, you can finally talk directly to your data in plain English. This isn't just about saving time; it's about changing who gets access to the answers that drive your business forward.
The goal is to get from a question to an insight as quickly as possible, without unnecessary steps getting in the way.
This simple flow—moving straight from data to question to insight—is what modern tools make possible. All the friction and manual steps of traditional analysis are cut out.
Data Exploration: Old Way vs. New Way
The difference between the two approaches is night and day. The traditional workflow was built on bottlenecks, creating a system where business users were entirely dependent on data experts. A Conversational AI Data Analyst like Statspresso removes those dependencies entirely.
Phase | The Old Way (Manual SQL) | The New Way (Statspresso) |
|---|---|---|
Asking a Question | Submit a detailed ticket to the data team, hoping your request is understood. | Ask a question in plain English, just like you would ask a colleague. |
The Wait | Days or weeks. Your request sits in a queue behind other priorities. | Seconds. The AI queries the database and generates a chart instantly. |
Getting the Answer | Receive a static dashboard or a single chart via email. | Get an interactive chart right in the app. You can click, filter, and drill down. |
Follow-Up Questions | The chart raises new questions. You file another ticket and wait all over again. | Ask a follow-up question immediately. "Now show me that by region." |
Who Gets to Explore? | Only SQL experts and trained data analysts. | Everyone. Founders, product managers, and marketers can self-serve. |
The old way is defined by handoffs and waiting. Every step requires another person and another delay, turning a simple curiosity into a multi-day project. It's a system that actively discourages exploration. For a deeper look at the landscape, our The Guide to SQL Charting breaks down how different tools stack up.
Why This Shift Matters for Your Team
The new way isn't just faster; it's fundamentally more effective. It fosters a culture of curiosity where anyone on your team can test a hypothesis or validate a gut feeling with real data—in the moment.
Think about it. When your marketing lead can ask, "Which of our blog posts drove the most signups last month?" and get an answer instantly, they can make smarter decisions about their content strategy today, not next week.
This shift transforms data from a guarded resource into a company-wide utility. It's like switching from a librarian who has to fetch every book for you to having the entire library searchable from your own desk.
With a Conversational AI Data Analyst, the person with the business context is the same person doing the analysis. This closes the gap between question and insight, allowing for a fluid, continuous dialogue with your data.
Try asking Statspresso: "Compare our user signups from last month to this month by acquisition channel as a line chart."
You're no longer just a passive consumer of reports; you're an active participant in the discovery process.
Must-Have Features for a Modern Data Exploration Tool
Picking a new tool for your team can feel like navigating a minefield. Most platforms aren't built for busy, non-technical folks who don't have time to learn SQL. You just need to get from a question to an answer, fast.
So, forget the endless checklist of features. It’s about zeroing in on the capabilities that genuinely make your life easier and get you to a decision without waiting in line for an engineer.
1. A True No-Code Interface
Let's start with the absolute deal-breaker: a genuinely no-code, conversational interface. This means anyone on your team should be able to ask complex business questions in plain English, just like they’d ask a colleague on Slack. No more dragging and dropping a dozen fields just to build a simple chart.
A true no-code experience means you type a question, and you get an answer. It's that simple. If you have to sit through hours of training just to figure out your monthly recurring revenue, the tool has already failed you.
This is the whole point of a Conversational AI Data Analyst like Statspresso. The goal is to make data analysis as natural as having a conversation.
2. Broad Data Source Connectivity
Your data is scattered. It’s in your Postgres database, your Shopify store, your HubSpot CRM, and probably a half-dozen other places. A tool is only useful if it can tap into all those sources without a massive engineering headache.
Look for a platform with pre-built, one-click connectors for the services you rely on every day. Key connectors to look for:
SaaS Apps: Shopify, HubSpot, Stripe, Salesforce
3. Automated Visualization
A great tool does more than just spit out numbers; it shows you what they mean. When you ask to compare something over time, you should instantly get a line chart. This automated visualization is a massive time-saver and makes insights immediately clear.
A smart tool understands the intent behind your question and builds the right chart for you in seconds.
Try asking Statspresso: "Compare our user signups from last month to this month by acquisition channel as a line chart."
4. Simple Collaboration and Sharing
Data exploration isn't a solo sport. An insight is only as good as the action it inspires. Any tool you choose must make it incredibly simple to share what you've found and start a conversation. This means you should be able to:
Send a direct link to a specific chart or dashboard.
Add a new finding to a shared space with one click.
Leave comments on a visual to kick off a discussion.
Export charts to Slack, email, or PDFs for your next meeting.
Real-World Use Cases for Growth-Focused Teams
Knowing what a data exploration tool is doesn't mean much until you see what it can do. The real value isn't in fancy dashboards; it’s in getting fast, straightforward answers to the urgent questions that keep you up at night.
Use Case for Founders: Cash Flow Clarity
As a founder, cash is everything. You need a constant, real-time pulse on the financial health of your company. But waiting for monthly reports is like driving while looking in the rearview mirror.
Instead of wrestling with spreadsheets, you can just ask what you need to know.
Try asking Statspresso: "Show me my monthly recurring revenue and burn rate for the last six months."
In seconds, you get a clear chart mapping out your two most critical financial metrics. This isn't just data; it's the ability to spot a potential cash crunch weeks in advance.
Use Case for Product Managers: Feature Adoption Insights
Your team just spent weeks building a new feature. Now for the big question: is anyone actually using it? Traditionally, finding out meant filing a ticket and waiting for an engineer to run a custom query.
With a Conversational AI Data Analyst like Statspresso, you can find out for yourself in seconds.
Try asking Statspresso: "What percentage of users who signed up in May have used our new Zapier integration?"
The answer tells you instantly whether your launch was a hit or if you need to focus more on user onboarding. It’s the difference between guessing and knowing the impact of your work.
Use Case for Marketers: Optimized Campaign Spend
Your team is running ads on Google, campaigns on LinkedIn, and sending out emails. Leads are coming in, but which channel is really delivering the most value?
This is where quick data exploration becomes essential. In fact, market reports from 2026 show that 70% of teams adopting automated BI say exploration features are critical for their analysis. You can learn more about how data exploration features drive insights.
Try asking Statspresso: "Which marketing channel had the lowest customer acquisition cost last quarter?"
Getting an immediate answer allows you to reallocate your budget with confidence. A simple question, answered in seconds, can save you thousands and seriously improve your marketing ROI.
Get Your First Answer from Your Data in 5 Minutes
Alright, enough with the theory. It's time to actually do something with your own data. With a modern data exploration tool, you can get a real answer in less time than it takes to brew a pot of coffee. This is the moment you go from reading about a solution to seeing it work for you.
Your Quick-Start Guide to Instant Insights
The new way, which relies on a Conversational AI Data Analyst like Statspresso, is designed for immediate results. Here's how you can get from signup to your first chart in under five minutes.
Sign Up for Free: Kick off a free trial. No credit card, no sales pitch.
Connect Your Data: Use a one-click connector for a source you already use, like Postgres, Shopify, or HubSpot.
Authorize Securely: You'll grant secure, read-only access. Your original data is never changed or written to, keeping it completely safe.
Ask Your First Question: Just type a question in plain English, like the examples above.
That’s it. In seconds, you'll see a chart built from your data, not some canned demo.
The answers you need to grow your business are sitting right there in your data. It's time to stop waiting for someone else to find them for you. You can discover more about the history of data tools and see the trends that led us here.
Frequently Asked Questions
You're busy, you've got questions, and you need straight answers. We get it. Here are some of the most common things we hear from founders, PMs, and marketers.
How secure is my data?
This is the most important question. Statspresso is fully SOC 2 compliant, meaning our security practices have passed a rigorous, independent audit. Critically, we connect to your databases using read-only access. Our tool can look at your data to find answers, but it can never change, update, or delete anything.
Do I need a data warehouse to use this?
Absolutely not. You don’t need to kick off a massive engineering project just to get answers. Modern tools like Statspresso use direct, one-click connectors to link your existing business apps (like Shopify and HubSpot) in minutes. Our Conversational AI Data Analyst then queries the data right where it lives.
How is this different from Google Analytics or my dashboards?
Your existing dashboards and tools like Google Analytics are fantastic for tracking the "what"—things like daily active users or total revenue. A true data exploration tool is built to help you find the "why" behind those numbers. It’s designed for asking all the ad-hoc questions that pop up during the day.
Is this going to replace my data analyst?
Nope. It’s going to make them even more valuable. For your data analysts, it automates the flood of repetitive questions they get bombarded with. This frees them up to dig into deeper, more strategic work. For everyone else, it provides immediate, self-serve access to answers, ending the constant bottlenecks.
The answers you need to grow are already in your data. Statspresso just helps you find them in seconds.
Ready to stop waiting? Connect your first data source for free and ask your first question.