Collaborative Business Intelligence (2026 Guide)

Waiting weeks for a data analyst to build a simple dashboard is a relic of the past. If you're a busy founder or manager, you know the pain: you have urgent questions, but the answers are locked away. Collaborative business intelligence (BI) is here to fix that. It turns data from a guarded, siloed resource into a team sport. Think less "emailing a static PDF" and more "everyone jumping into a Google Doc"—but for your company's data.
Here's the TL;DR on making your data truly collaborative:
Old-School BI is Broken: The traditional model of filing a ticket and waiting for an analyst is slow, frustrating, and kills momentum.
Collaboration Has Three Pillars: True collaboration stands on Context (everyone uses the same definitions), Conversation (teams can discuss data live), and Consolidation (a single source of truth).
Conversational AI is the Key: The biggest leap forward comes from tools that let you skip the code. A Conversational AI Data Analyst like Statspresso lets you just ask your data a question and get a chart in seconds.
Start Small to Win Big: Don't boil the ocean. Connect one high-value data source, empower a small pilot team, and watch the "aha!" moments spread organically.
What Is Collaborative Business Intelligence Anyway?
Collaborative BI isn't just about sharing a dashboard link. It's a fundamental shift in how teams work with data. The goal is to close the gap between the people with questions (that’s you—the founder, product manager, or marketing lead) and the data that holds the answers. It makes data analysis an active, ongoing conversation, not a passive, one-way report.
The classic bottleneck is all too familiar: you need a number, so you file a ticket and wait for a busy analyst to write a SQL query. This grinds decisions to a halt and keeps critical insights locked up. Collaborative business intelligence shatters that cycle. It provides tools and processes that let everyone join the discovery process.
This approach transforms data from a guarded asset into a common language for your entire company. It’s how you build a culture where data isn't just for analysts—it's for anyone who needs to make a smarter decision, right now.
The Problem With Old-School BI
The traditional BI model was built for a different era, and it shows. Most teams know this painful dance:
A question pops up: "Which marketing campaign drove the most signups last quarter?"
A ticket is filed: Your question joins a long queue behind everyone else's.
A query is written: An analyst translates your simple question into complex SQL code.
A report is built: The results are plopped into a static chart or a rigid dashboard.
An answer finally arrives: By the time the report lands in your inbox weeks later, the opportunity has passed.
This workflow is the enemy of speed. It's slow, rigid, and benches non-technical players. It creates a total dependency on a small group of experts, turning them into data gatekeepers instead of strategic partners. For any busy leader, that means you're either flying blind or making decisions based on stale information.
The New Way Data-Driven Teams Work
Modern collaborative analytics flips that old model on its head. Instead of a one-way street of requests and reports, it creates a dynamic, interactive space where insights are developed together. The focus shifts from static reports to living conversations around data.
This is where a Conversational AI Data Analyst like Statspresso is a total game-changer. You skip the SQL and ditch the ticket queues. Just ask your data a question in plain English and get a chart in seconds.
Try asking Statspresso: "Show me my top 5 marketing campaigns by user signups last quarter as a bar chart."
This immediate feedback is the heart of collaborative BI. It gives team members the freedom to explore data, share findings, and build on each other's discoveries in real time. Your marketing lead gets an answer instantly, drops the chart into Slack, and kicks off a discussion with the product team. That's how you move from slow reporting to fast, team-driven action.
The Three Pillars of Modern Data Collaboration
Building a collaborative BI strategy isn't about buying new software; it's about changing how your team interacts with data. The whole concept breaks down into three core pillars that support a modern data workflow: Context, Conversation, and Consolidation.
Get these three right, and you'll shift from scattered spreadsheets to a dynamic space where anyone can find answers.
The journey from isolated data silos to collective insight is powered by a data enabler, as this visual shows.
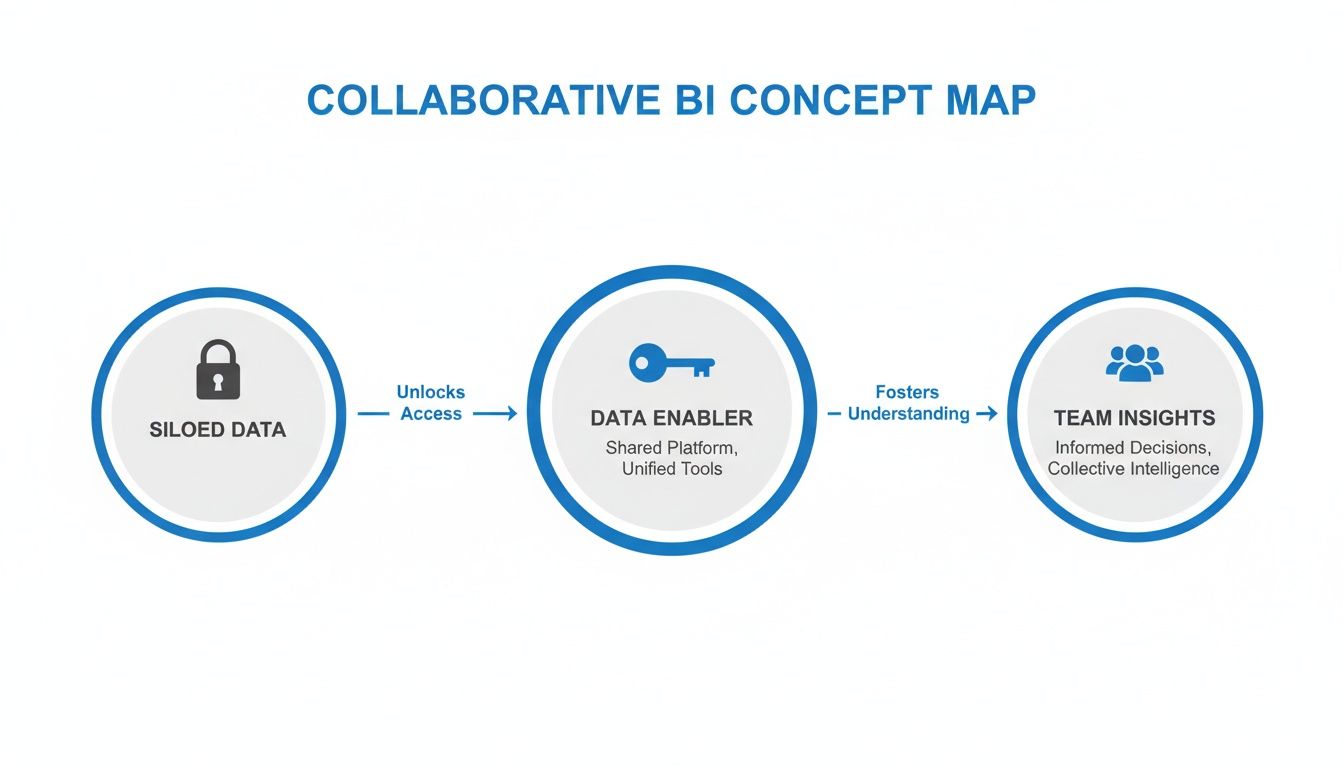
It’s a straightforward path: siloed, hard-to-reach data becomes a powerful team asset once a data enabler—like a collaborative BI tool—is in place.
Pillar 1: Context
Context is the bedrock of meaningful data collaboration. It's about ensuring everyone is looking at the same numbers and using the same definitions. This alone ends the classic, time-wasting debate: "Wait, my numbers don't match your numbers."
Without shared context, your marketing team might define a "lead" one way while sales defines it another. This leads to conflicting reports and flawed decisions. Effective collaborative BI creates a common language, building trust and eliminating confusion.
Pillar 2: Conversation
Conversation is where the magic happens. This is the ability for your team to ask questions, share findings, and challenge insights directly where the data lives. It transforms data from a static report into a living starting point for discussion.
Instead of exporting a chart to a slide deck and emailing it around, team members can comment, tag colleagues, and ask follow-up questions right on the analysis. A Conversational AI Data Analyst from a platform like Statspresso powers this. You don’t need to write a ticket; you just ask a question.
Try asking Statspresso: "What was our customer lifetime value by acquisition channel last quarter?"
This conversational approach sparks curiosity. It empowers anyone, regardless of technical skill, to dig deeper in real time.
Pillar 3: Consolidation
Finally, Consolidation brings it all together. This pillar is about establishing a single source of truth—a central, trusted place where all key metrics are built, stored, and shared. No more hunting through old email threads or someone's personal spreadsheet to find the "official" revenue number.
A consolidated environment ensures answers are pulled from a reliable source. This is more critical than ever, with industry reports showing that the cloud BI market is projected to hold a dominant share of 50.55% by 2026. Why? Because it enables teams to access a single, unified source of data from anywhere. You can learn more about the top analytics trends predicted for 2026.
When your data is consolidated, your team makes decisions with confidence. Together, these three pillars form the foundation of a modern BI strategy that drives faster, smarter decisions.
From Manual SQL to Conversational AI Analytics
Let's be honest: the old way of getting answers from data is broken. You have a simple question, but the journey to an answer involves filing a ticket, waiting in a queue, and hoping the SQL query the analyst writes actually helps. That cycle can eat up days or weeks—time you don't have.
Collaborative business intelligence is designed to eliminate this bottleneck. The goal is to shift from a rigid, manual workflow to a fluid, conversational one. Think of it as replacing a single-lane road riddled with traffic jams with a multi-lane insights highway.

The Old School vs. The New Wave: BI and Conversational Analytics
The difference between a traditional BI setup and modern, conversational analytics is night and day. One is built for waiting; the other is built for speed and self-service. The problem was never a lack of data, but the agonizing difficulty of getting to it.
The "Old Way" of BI is like ordering coffee by filling out a form and waiting a week. The "New Way" is like having a world-class barista at your desk, ready to make whatever you ask for, instantly. This shift is now possible with a Conversational AI Data Analyst like Statspresso. You can completely bypass the need for SQL. Skip the SQL. Just ask your data a question and get a chart in seconds. It’s a direct line from curiosity to clarity.
The Old Way vs The New Way Of Getting Data Answers
The gap in efficiency and accessibility is huge. Let's make it plain.
Metric | The Old Way (Manual SQL) | The New Way (Statspresso) |
|---|---|---|
Time to Answer | Days or even weeks. | Seconds to minutes. |
Required Skill | Deep knowledge of SQL or Tableau. | Plain English. If you can ask a question, you can get an answer. |
Who Can Get Insights | Data analysts and a few "power users." | Anyone on the team—from marketing to the CEO. |
Flexibility | Rigid. Need a different metric? File a new ticket and wait. | Dynamic. Ask follow-up questions on the spot. |
Collaboration | Happens after the report is done, usually over email or Slack. | Happens in real-time, directly where the data is being explored. |
This isn't a minor tweak. It’s a fundamental change that empowers everyone to be more curious and proactive.
From Theory to Practice: Putting Conversational AI to Work
The best part is that this isn't some far-off concept; it’s immediately useful. Once a data source is connected, your team can start asking questions right away.
Imagine your head of marketing needs to understand recent user growth. Instead of drafting an email to the data team, they just ask:
Try asking Statspresso: "Compare our user signups from last month to this month by marketing channel."
Within seconds, they get a chart. They can share that insight directly with the product team to discuss what it means for the roadmap. This is automated BI at its best—fast, accessible, and built for teamwork.
How to Implement Collaborative BI Without the Headaches
Thinking about adopting a new tool can feel overwhelming. But rolling out collaborative BI doesn't have to be a headache. The secret? Resist the urge to do everything at once. Start small, targeted, and quick to score an early win that gets people genuinely excited.
Once a small group sees how easily they can find answers, adoption will spread on its own.
Start with a Single High-Value Data Source
The most common mistake is trying to connect every data source from day one. This creates needless complexity and delays that crucial "aha!" moment. Instead, start with one high-value data source a specific team cares deeply about.
Pick the data that answers burning, everyday questions:
E-commerce teams: Connect your Shopify store to get a clear picture of sales trends.
Marketing teams: Hook up your HubSpot account to track campaign ROI.
Product teams: Link your Postgres database to understand feature adoption.
By focusing on a single, impactful dataset, you deliver immediate value. This is where a Conversational AI Data Analyst like Statspresso proves its worth—you can connect a source and ask your first question in minutes.
Identify a Pilot Team of Champions
Next, find a small "pilot team" of 3-5 enthusiastic champions. These are the folks always asking for data but tired of the roadblocks. They are the perfect pioneers for this new way of working.
Your pilot team doesn't need to be tech wizards. In fact, it's better if they aren't. Your mission is to prove that anyone can get answers. This team will test the workflow, give honest feedback, and become your internal evangelists.
The fastest way to show the magic of automated BI is to give a non-technical marketing manager the power to ask, "Show me our top 10 landing pages by conversion rate last month," and get an instant chart.
Once they get a taste of that freedom, they'll start telling other departments. For more on this, check out our guide on building a self-serve business intelligence culture.
Establish Simple Governance From the Start
"Data for everyone" doesn't have to mean chaos. Establishing a few simple governance rules from the start keeps collaboration productive and your data trustworthy. No hundred-page policy document needed. Just start with the basics.
Define a few key metrics that everyone agrees on in a shared workspace. For example:
"Monthly Active User (MAU)": A user who has logged in at least once in the last 30 days.
"Conversion Rate": The percentage of website visitors who complete a purchase.
"Net Revenue": Total sales minus refunds and discounts.
When you define these terms centrally, you create a single source of truth. Now, when sales and marketing both ask about revenue, they get the same number. This simple act builds incredible trust. With a platform like Statspresso, you can connect your first data source for free and start building that trusted environment today.
Measuring the Real-World Impact of Your Strategy
So, you're on board with collaborative BI. Great. But how do you prove it’s actually working? Forget vanity metrics like "number of dashboards built." To measure real impact, you have to look at concrete business outcomes. Are you making better decisions, faster? Are you saving time?
This isn’t just about a new tool. It’s about changing the rhythm of your team's operations. We need to move beyond tracking activity and start measuring efficiency and growth.
Key Metrics That Actually Matter
To get a true feel for your ROI, track metrics that show a real shift in speed and behavior. These are the vital signs of a healthy, data-fluent organization.
Focus on these three core KPIs:
Time to Insight: The total time from when a question is asked to when a data-backed answer is in hand. The goal is to crush this timeline from weeks or days to mere minutes.
Data Adoption Rate: How many non-technical team members are regularly using data to guide their work. When this number climbs, you know data is no longer locked away.
Decision Velocity: How much faster your team can make confident, informed choices. Validating a feature idea in an afternoon instead of waiting a month for a report is a huge win.
This move toward accessible analytics isn't a niche trend; it's a seismic shift. The global business intelligence market is projected to grow from around $50.4 billion in 2026 to $95.8 billion by 2033. This explosive growth shows how heavily companies are investing in data-driven cultures. You can dig deeper into these business intelligence market projections.
From Abstract KPIs to Concrete Wins
These metrics click when you see them in the real world. A Conversational AI Data Analyst like Statspresso directly moves the needle on all three.
Your "Time to Insight" plummets because a marketing manager can ask a question and get a chart instantly. Your "Data Adoption Rate" spikes when the sales team discovers they can track their pipeline without filing a ticket.
And that’s where you see the real return. A faster "Decision Velocity" means your team can jump on opportunities or squash problems before they grow. Instead of waiting for a quarterly review to discover a campaign is tanking, your team can spot the trend in real-time and pivot.
Try asking Statspresso: "Show me customer churn rate by month for the past year."
Getting that answer in seconds isn’t just a cool party trick; it's a direct measure of improved efficiency. When anyone can do that, you've tied your BI strategy to tangible business value.
Collaborative BI Tools Compared (2026)
Not every BI tool is built for collaboration. Some are analyst-first — powerful but gated behind SQL. Others democratize access but trade depth for simplicity. Here's how the main options stack up for teams who want data to be a team sport, not a specialist skill.
Tool | Collaboration model | SQL required? | Best for | Weakness |
|---|---|---|---|---|
Statspresso | Conversational — ask questions in plain English, share live charts, build dashboards together | No | Non-technical teams, founders, cross-functional squads | Newer product — smaller connector library than Tableau/Power BI |
Tableau | Dashboard-sharing and commenting; collaboration happens around static reports | No (drag-and-drop) but complex queries still need SQL | Large BI teams with dedicated analysts | Expensive ($70+/user/mo), steep learning curve, slow for ad hoc questions |
Power BI | Report publishing and workspace sharing within Microsoft 365 ecosystem | DAX required for anything beyond basic | Microsoft shops with existing Azure/M365 infrastructure | DAX learning curve, licensing complexity, not built for conversational queries |
Metabase | Shared questions and dashboards; open-source, self-hosted option | No for basic; SQL for advanced | Technical startups who want free self-hosted BI | Self-hosting requires DevOps; cloud plan gets expensive at scale |
Looker | LookML data model shared across org; strong governance | LookML (proprietary) | Mid-market and enterprise with a dedicated data team | Expensive, requires significant analyst setup time before non-technical users can self-serve |
The core trade-off: tools like Tableau, Power BI, and Looker give you depth and governance, but they require technical expertise to unlock. For a team where the goal is giving every person direct access to answers, a conversational tool like Statspresso's AI Data Chat removes the biggest barrier — the requirement to know SQL or LookML before you can ask a question.
Collaborative BI by Role: Quick-Win Questions
The real test of collaborative BI is whether it actually changes what happens in Monday morning standups. Here's what each function gains when data is no longer gated:
Founders and Executives
You need the pulse of the business without scheduling a reporting call. With collaborative BI, you pull it yourself.
"What's our MRR trend over the last 6 months and where did growth slow down?"
"Which customer segment has the highest 90-day retention rate?"
"Show me CAC by acquisition channel this quarter vs last quarter."
Product Managers
Feature adoption questions used to mean a ticket to engineering. Now they're instant.
"How many users activated the new onboarding flow in the last 14 days?"
"What's the drop-off rate between step 2 and step 3 of our setup wizard?"
"Compare DAU for users who completed onboarding vs users who didn't."
Marketing Leads
Cross-channel attribution used to require a data export and three spreadsheet joins. Not any more.
"Which campaign drove the most signups with the lowest CAC last month?"
"What's the conversion rate from trial to paid for HubSpot vs organic leads?"
"Show me email open rate trends over the last 8 weeks broken down by segment."
Sales and Revenue Ops
Pipeline questions that previously needed a CRM admin are now self-serve.
"How many deals moved from qualified to proposal this week vs last week?"
"What's our average time-to-close by deal size over the last quarter?"
"Which rep has the highest win rate on deals over $5K?"
When questions like these get answered in seconds instead of days, the whole organization moves faster. That's the compounding return of collaborative BI done right.
What's Next? Putting Collaborative BI Into Practice
If you're fed up with data bottlenecks and agonizingly slow decisions, it all boils down to a few key ideas.
Waiting for Data Is Over: The old way—filing a ticket and waiting weeks for a simple report—is officially dead.
Collaboration is a Team Sport: It's a live, ongoing conversation where anyone can ask questions and dig deeper.
Conversational AI is the Key: This technology finally lets non-technical people ask data questions in plain English.
Start Small, Win Big: Connect one data source and empower a small group of champions. They'll show everyone else what's possible.
From Questions to Clarity to Action
At the end of the day, this is all about turning data into action. Knowledge locked away in a database might as well not exist.
The entire point of a collaborative business intelligence strategy is to get insights to the people on the front lines—the ones who can use it to make smarter, faster decisions. This is how you build a culture where curiosity is rewarded with instant answers, not a spot at the back of a long queue.
For too long, the promise of being "data-driven" has been held back by clunky tools. The solution isn't just more dashboards; it's removing friction. It’s giving your team the power to find their own answers. This is precisely where a Conversational AI Data Analyst like Statspresso makes a difference. It’s designed for busy leaders who have data but no time to learn SQL.
Ready to stop waiting and start acting? Connect your first data source to Statspresso for free and ask your first question. See for yourself how quickly your team can go from questions to clarity—and from clarity to confident action.
Waiting weeks for a data analyst to build a simple dashboard is a relic of the past. If you're a busy founder or manager, you know the pain: you have urgent questions, but the answers are locked away. Collaborative business intelligence (BI) is here to fix that. It turns data from a guarded, siloed resource into a team sport. Think less "emailing a static PDF" and more "everyone jumping into a Google Doc"—but for your company's data.
Here's the TL;DR on making your data truly collaborative:
Old-School BI is Broken: The traditional model of filing a ticket and waiting for an analyst is slow, frustrating, and kills momentum.
Collaboration Has Three Pillars: True collaboration stands on Context (everyone uses the same definitions), Conversation (teams can discuss data live), and Consolidation (a single source of truth).
Conversational AI is the Key: The biggest leap forward comes from tools that let you skip the code. A Conversational AI Data Analyst like Statspresso lets you just ask your data a question and get a chart in seconds.
Start Small to Win Big: Don't boil the ocean. Connect one high-value data source, empower a small pilot team, and watch the "aha!" moments spread organically.
What Is Collaborative Business Intelligence Anyway?
Collaborative BI isn't just about sharing a dashboard link. It's a fundamental shift in how teams work with data. The goal is to close the gap between the people with questions (that’s you—the founder, product manager, or marketing lead) and the data that holds the answers. It makes data analysis an active, ongoing conversation, not a passive, one-way report.
The classic bottleneck is all too familiar: you need a number, so you file a ticket and wait for a busy analyst to write a SQL query. This grinds decisions to a halt and keeps critical insights locked up. Collaborative business intelligence shatters that cycle. It provides tools and processes that let everyone join the discovery process.
This approach transforms data from a guarded asset into a common language for your entire company. It’s how you build a culture where data isn't just for analysts—it's for anyone who needs to make a smarter decision, right now.
The Problem With Old-School BI
The traditional BI model was built for a different era, and it shows. Most teams know this painful dance:
A question pops up: "Which marketing campaign drove the most signups last quarter?"
A ticket is filed: Your question joins a long queue behind everyone else's.
A query is written: An analyst translates your simple question into complex SQL code.
A report is built: The results are plopped into a static chart or a rigid dashboard.
An answer finally arrives: By the time the report lands in your inbox weeks later, the opportunity has passed.
This workflow is the enemy of speed. It's slow, rigid, and benches non-technical players. It creates a total dependency on a small group of experts, turning them into data gatekeepers instead of strategic partners. For any busy leader, that means you're either flying blind or making decisions based on stale information.
The New Way Data-Driven Teams Work
Modern collaborative analytics flips that old model on its head. Instead of a one-way street of requests and reports, it creates a dynamic, interactive space where insights are developed together. The focus shifts from static reports to living conversations around data.
This is where a Conversational AI Data Analyst like Statspresso is a total game-changer. You skip the SQL and ditch the ticket queues. Just ask your data a question in plain English and get a chart in seconds.
Try asking Statspresso: "Show me my top 5 marketing campaigns by user signups last quarter as a bar chart."
This immediate feedback is the heart of collaborative BI. It gives team members the freedom to explore data, share findings, and build on each other's discoveries in real time. Your marketing lead gets an answer instantly, drops the chart into Slack, and kicks off a discussion with the product team. That's how you move from slow reporting to fast, team-driven action.
The Three Pillars of Modern Data Collaboration
Building a collaborative BI strategy isn't about buying new software; it's about changing how your team interacts with data. The whole concept breaks down into three core pillars that support a modern data workflow: Context, Conversation, and Consolidation.
Get these three right, and you'll shift from scattered spreadsheets to a dynamic space where anyone can find answers.
The journey from isolated data silos to collective insight is powered by a data enabler, as this visual shows.
It’s a straightforward path: siloed, hard-to-reach data becomes a powerful team asset once a data enabler—like a collaborative BI tool—is in place.
Pillar 1: Context
Context is the bedrock of meaningful data collaboration. It's about ensuring everyone is looking at the same numbers and using the same definitions. This alone ends the classic, time-wasting debate: "Wait, my numbers don't match your numbers."
Without shared context, your marketing team might define a "lead" one way while sales defines it another. This leads to conflicting reports and flawed decisions. Effective collaborative BI creates a common language, building trust and eliminating confusion.
Pillar 2: Conversation
Conversation is where the magic happens. This is the ability for your team to ask questions, share findings, and challenge insights directly where the data lives. It transforms data from a static report into a living starting point for discussion.
Instead of exporting a chart to a slide deck and emailing it around, team members can comment, tag colleagues, and ask follow-up questions right on the analysis. A Conversational AI Data Analyst from a platform like Statspresso powers this. You don’t need to write a ticket; you just ask a question.
Try asking Statspresso: "What was our customer lifetime value by acquisition channel last quarter?"
This conversational approach sparks curiosity. It empowers anyone, regardless of technical skill, to dig deeper in real time.
Pillar 3: Consolidation
Finally, Consolidation brings it all together. This pillar is about establishing a single source of truth—a central, trusted place where all key metrics are built, stored, and shared. No more hunting through old email threads or someone's personal spreadsheet to find the "official" revenue number.
A consolidated environment ensures answers are pulled from a reliable source. This is more critical than ever, with industry reports showing that the cloud BI market is projected to hold a dominant share of 50.55% by 2026. Why? Because it enables teams to access a single, unified source of data from anywhere. You can learn more about the top analytics trends predicted for 2026.
When your data is consolidated, your team makes decisions with confidence. Together, these three pillars form the foundation of a modern BI strategy that drives faster, smarter decisions.
From Manual SQL to Conversational AI Analytics
Let's be honest: the old way of getting answers from data is broken. You have a simple question, but the journey to an answer involves filing a ticket, waiting in a queue, and hoping the SQL query the analyst writes actually helps. That cycle can eat up days or weeks—time you don't have.
Collaborative business intelligence is designed to eliminate this bottleneck. The goal is to shift from a rigid, manual workflow to a fluid, conversational one. Think of it as replacing a single-lane road riddled with traffic jams with a multi-lane insights highway.
The Old School vs. The New Wave: BI and Conversational Analytics
The difference between a traditional BI setup and modern, conversational analytics is night and day. One is built for waiting; the other is built for speed and self-service. The problem was never a lack of data, but the agonizing difficulty of getting to it.
The "Old Way" of BI is like ordering coffee by filling out a form and waiting a week. The "New Way" is like having a world-class barista at your desk, ready to make whatever you ask for, instantly. This shift is now possible with a Conversational AI Data Analyst like Statspresso. You can completely bypass the need for SQL. Skip the SQL. Just ask your data a question and get a chart in seconds. It’s a direct line from curiosity to clarity.
The Old Way vs The New Way Of Getting Data Answers
The gap in efficiency and accessibility is huge. Let's make it plain.
Metric | The Old Way (Manual SQL) | The New Way (Statspresso) |
|---|---|---|
Time to Answer | Days or even weeks. | Seconds to minutes. |
Required Skill | Deep knowledge of SQL or Tableau. | Plain English. If you can ask a question, you can get an answer. |
Who Can Get Insights | Data analysts and a few "power users." | Anyone on the team—from marketing to the CEO. |
Flexibility | Rigid. Need a different metric? File a new ticket and wait. | Dynamic. Ask follow-up questions on the spot. |
Collaboration | Happens after the report is done, usually over email or Slack. | Happens in real-time, directly where the data is being explored. |
This isn't a minor tweak. It’s a fundamental change that empowers everyone to be more curious and proactive.
From Theory to Practice: Putting Conversational AI to Work
The best part is that this isn't some far-off concept; it’s immediately useful. Once a data source is connected, your team can start asking questions right away.
Imagine your head of marketing needs to understand recent user growth. Instead of drafting an email to the data team, they just ask:
Try asking Statspresso: "Compare our user signups from last month to this month by marketing channel."
Within seconds, they get a chart. They can share that insight directly with the product team to discuss what it means for the roadmap. This is automated BI at its best—fast, accessible, and built for teamwork.
How to Implement Collaborative BI Without the Headaches
Thinking about adopting a new tool can feel overwhelming. But rolling out collaborative BI doesn't have to be a headache. The secret? Resist the urge to do everything at once. Start small, targeted, and quick to score an early win that gets people genuinely excited.
Once a small group sees how easily they can find answers, adoption will spread on its own.
Start with a Single High-Value Data Source
The most common mistake is trying to connect every data source from day one. This creates needless complexity and delays that crucial "aha!" moment. Instead, start with one high-value data source a specific team cares deeply about.
Pick the data that answers burning, everyday questions:
E-commerce teams: Connect your Shopify store to get a clear picture of sales trends.
Marketing teams: Hook up your HubSpot account to track campaign ROI.
Product teams: Link your Postgres database to understand feature adoption.
By focusing on a single, impactful dataset, you deliver immediate value. This is where a Conversational AI Data Analyst like Statspresso proves its worth—you can connect a source and ask your first question in minutes.
Identify a Pilot Team of Champions
Next, find a small "pilot team" of 3-5 enthusiastic champions. These are the folks always asking for data but tired of the roadblocks. They are the perfect pioneers for this new way of working.
Your pilot team doesn't need to be tech wizards. In fact, it's better if they aren't. Your mission is to prove that anyone can get answers. This team will test the workflow, give honest feedback, and become your internal evangelists.
The fastest way to show the magic of automated BI is to give a non-technical marketing manager the power to ask, "Show me our top 10 landing pages by conversion rate last month," and get an instant chart.
Once they get a taste of that freedom, they'll start telling other departments. For more on this, check out our guide on building a self-serve business intelligence culture.
Establish Simple Governance From the Start
"Data for everyone" doesn't have to mean chaos. Establishing a few simple governance rules from the start keeps collaboration productive and your data trustworthy. No hundred-page policy document needed. Just start with the basics.
Define a few key metrics that everyone agrees on in a shared workspace. For example:
"Monthly Active User (MAU)": A user who has logged in at least once in the last 30 days.
"Conversion Rate": The percentage of website visitors who complete a purchase.
"Net Revenue": Total sales minus refunds and discounts.
When you define these terms centrally, you create a single source of truth. Now, when sales and marketing both ask about revenue, they get the same number. This simple act builds incredible trust. With a platform like Statspresso, you can connect your first data source for free and start building that trusted environment today.
Measuring the Real-World Impact of Your Strategy
So, you're on board with collaborative BI. Great. But how do you prove it’s actually working? Forget vanity metrics like "number of dashboards built." To measure real impact, you have to look at concrete business outcomes. Are you making better decisions, faster? Are you saving time?
This isn’t just about a new tool. It’s about changing the rhythm of your team's operations. We need to move beyond tracking activity and start measuring efficiency and growth.
Key Metrics That Actually Matter
To get a true feel for your ROI, track metrics that show a real shift in speed and behavior. These are the vital signs of a healthy, data-fluent organization.
Focus on these three core KPIs:
Time to Insight: The total time from when a question is asked to when a data-backed answer is in hand. The goal is to crush this timeline from weeks or days to mere minutes.
Data Adoption Rate: How many non-technical team members are regularly using data to guide their work. When this number climbs, you know data is no longer locked away.
Decision Velocity: How much faster your team can make confident, informed choices. Validating a feature idea in an afternoon instead of waiting a month for a report is a huge win.
This move toward accessible analytics isn't a niche trend; it's a seismic shift. The global business intelligence market is projected to grow from around $50.4 billion in 2026 to $95.8 billion by 2033. This explosive growth shows how heavily companies are investing in data-driven cultures. You can dig deeper into these business intelligence market projections.
From Abstract KPIs to Concrete Wins
These metrics click when you see them in the real world. A Conversational AI Data Analyst like Statspresso directly moves the needle on all three.
Your "Time to Insight" plummets because a marketing manager can ask a question and get a chart instantly. Your "Data Adoption Rate" spikes when the sales team discovers they can track their pipeline without filing a ticket.
And that’s where you see the real return. A faster "Decision Velocity" means your team can jump on opportunities or squash problems before they grow. Instead of waiting for a quarterly review to discover a campaign is tanking, your team can spot the trend in real-time and pivot.
Try asking Statspresso: "Show me customer churn rate by month for the past year."
Getting that answer in seconds isn’t just a cool party trick; it's a direct measure of improved efficiency. When anyone can do that, you've tied your BI strategy to tangible business value.
Collaborative BI Tools Compared (2026)
Not every BI tool is built for collaboration. Some are analyst-first — powerful but gated behind SQL. Others democratize access but trade depth for simplicity. Here's how the main options stack up for teams who want data to be a team sport, not a specialist skill.
Tool | Collaboration model | SQL required? | Best for | Weakness |
|---|---|---|---|---|
Statspresso | Conversational — ask questions in plain English, share live charts, build dashboards together | No | Non-technical teams, founders, cross-functional squads | Newer product — smaller connector library than Tableau/Power BI |
Tableau | Dashboard-sharing and commenting; collaboration happens around static reports | No (drag-and-drop) but complex queries still need SQL | Large BI teams with dedicated analysts | Expensive ($70+/user/mo), steep learning curve, slow for ad hoc questions |
Power BI | Report publishing and workspace sharing within Microsoft 365 ecosystem | DAX required for anything beyond basic | Microsoft shops with existing Azure/M365 infrastructure | DAX learning curve, licensing complexity, not built for conversational queries |
Metabase | Shared questions and dashboards; open-source, self-hosted option | No for basic; SQL for advanced | Technical startups who want free self-hosted BI | Self-hosting requires DevOps; cloud plan gets expensive at scale |
Looker | LookML data model shared across org; strong governance | LookML (proprietary) | Mid-market and enterprise with a dedicated data team | Expensive, requires significant analyst setup time before non-technical users can self-serve |
The core trade-off: tools like Tableau, Power BI, and Looker give you depth and governance, but they require technical expertise to unlock. For a team where the goal is giving every person direct access to answers, a conversational tool like Statspresso's AI Data Chat removes the biggest barrier — the requirement to know SQL or LookML before you can ask a question.
Collaborative BI by Role: Quick-Win Questions
The real test of collaborative BI is whether it actually changes what happens in Monday morning standups. Here's what each function gains when data is no longer gated:
Founders and Executives
You need the pulse of the business without scheduling a reporting call. With collaborative BI, you pull it yourself.
"What's our MRR trend over the last 6 months and where did growth slow down?"
"Which customer segment has the highest 90-day retention rate?"
"Show me CAC by acquisition channel this quarter vs last quarter."
Product Managers
Feature adoption questions used to mean a ticket to engineering. Now they're instant.
"How many users activated the new onboarding flow in the last 14 days?"
"What's the drop-off rate between step 2 and step 3 of our setup wizard?"
"Compare DAU for users who completed onboarding vs users who didn't."
Marketing Leads
Cross-channel attribution used to require a data export and three spreadsheet joins. Not any more.
"Which campaign drove the most signups with the lowest CAC last month?"
"What's the conversion rate from trial to paid for HubSpot vs organic leads?"
"Show me email open rate trends over the last 8 weeks broken down by segment."
Sales and Revenue Ops
Pipeline questions that previously needed a CRM admin are now self-serve.
"How many deals moved from qualified to proposal this week vs last week?"
"What's our average time-to-close by deal size over the last quarter?"
"Which rep has the highest win rate on deals over $5K?"
When questions like these get answered in seconds instead of days, the whole organization moves faster. That's the compounding return of collaborative BI done right.
What's Next? Putting Collaborative BI Into Practice
If you're fed up with data bottlenecks and agonizingly slow decisions, it all boils down to a few key ideas.
Waiting for Data Is Over: The old way—filing a ticket and waiting weeks for a simple report—is officially dead.
Collaboration is a Team Sport: It's a live, ongoing conversation where anyone can ask questions and dig deeper.
Conversational AI is the Key: This technology finally lets non-technical people ask data questions in plain English.
Start Small, Win Big: Connect one data source and empower a small group of champions. They'll show everyone else what's possible.
From Questions to Clarity to Action
At the end of the day, this is all about turning data into action. Knowledge locked away in a database might as well not exist.
The entire point of a collaborative business intelligence strategy is to get insights to the people on the front lines—the ones who can use it to make smarter, faster decisions. This is how you build a culture where curiosity is rewarded with instant answers, not a spot at the back of a long queue.
For too long, the promise of being "data-driven" has been held back by clunky tools. The solution isn't just more dashboards; it's removing friction. It’s giving your team the power to find their own answers. This is precisely where a Conversational AI Data Analyst like Statspresso makes a difference. It’s designed for busy leaders who have data but no time to learn SQL.
Ready to stop waiting and start acting? Connect your first data source to Statspresso for free and ask your first question. See for yourself how quickly your team can go from questions to clarity—and from clarity to confident action.