Data Governance Best Practices for Startups (2026)

Data governance is what lets a startup answer basic questions quickly and trust the answer. Done well, it cuts rework, reduces analyst queues, and gives teams a safe way to use self-serve analytics instead of waiting on IT to bless every report.
That matters because fast growth creates messy data fast. Shopify, HubSpot, product events, billing records, and a few "temporary" spreadsheets pile up until every metric turns into a debate. The problem usually is not data access. It is unclear ownership, inconsistent definitions, and no shared rules for what is safe and reliable to use.
Good governance fixes that by making the right data easier to find and easier to trust. It gives teams enough structure to move faster with tools like Statspresso, instead of slowing everyone down with approval loops and one-off dashboard requests. The trade-off is real. A little discipline up front saves a lot of cleanup later.
If you want the short version first, here are some actionable data governance tips. If you want the practical version, keep going.
1. Build a data catalog before you buy more dashboards
A company without a catalog usually has the same problem as a garage with no shelves. The tools aren't the issue. Nobody knows where anything is, which version is current, or whether the thing they found still works.
A usable data catalog should answer basic questions fast. What data exists? Where does it live? Who owns it? Is it safe to use? If a growth lead opens "customers_final_v2_revised," that file name alone tells you governance has already lost.
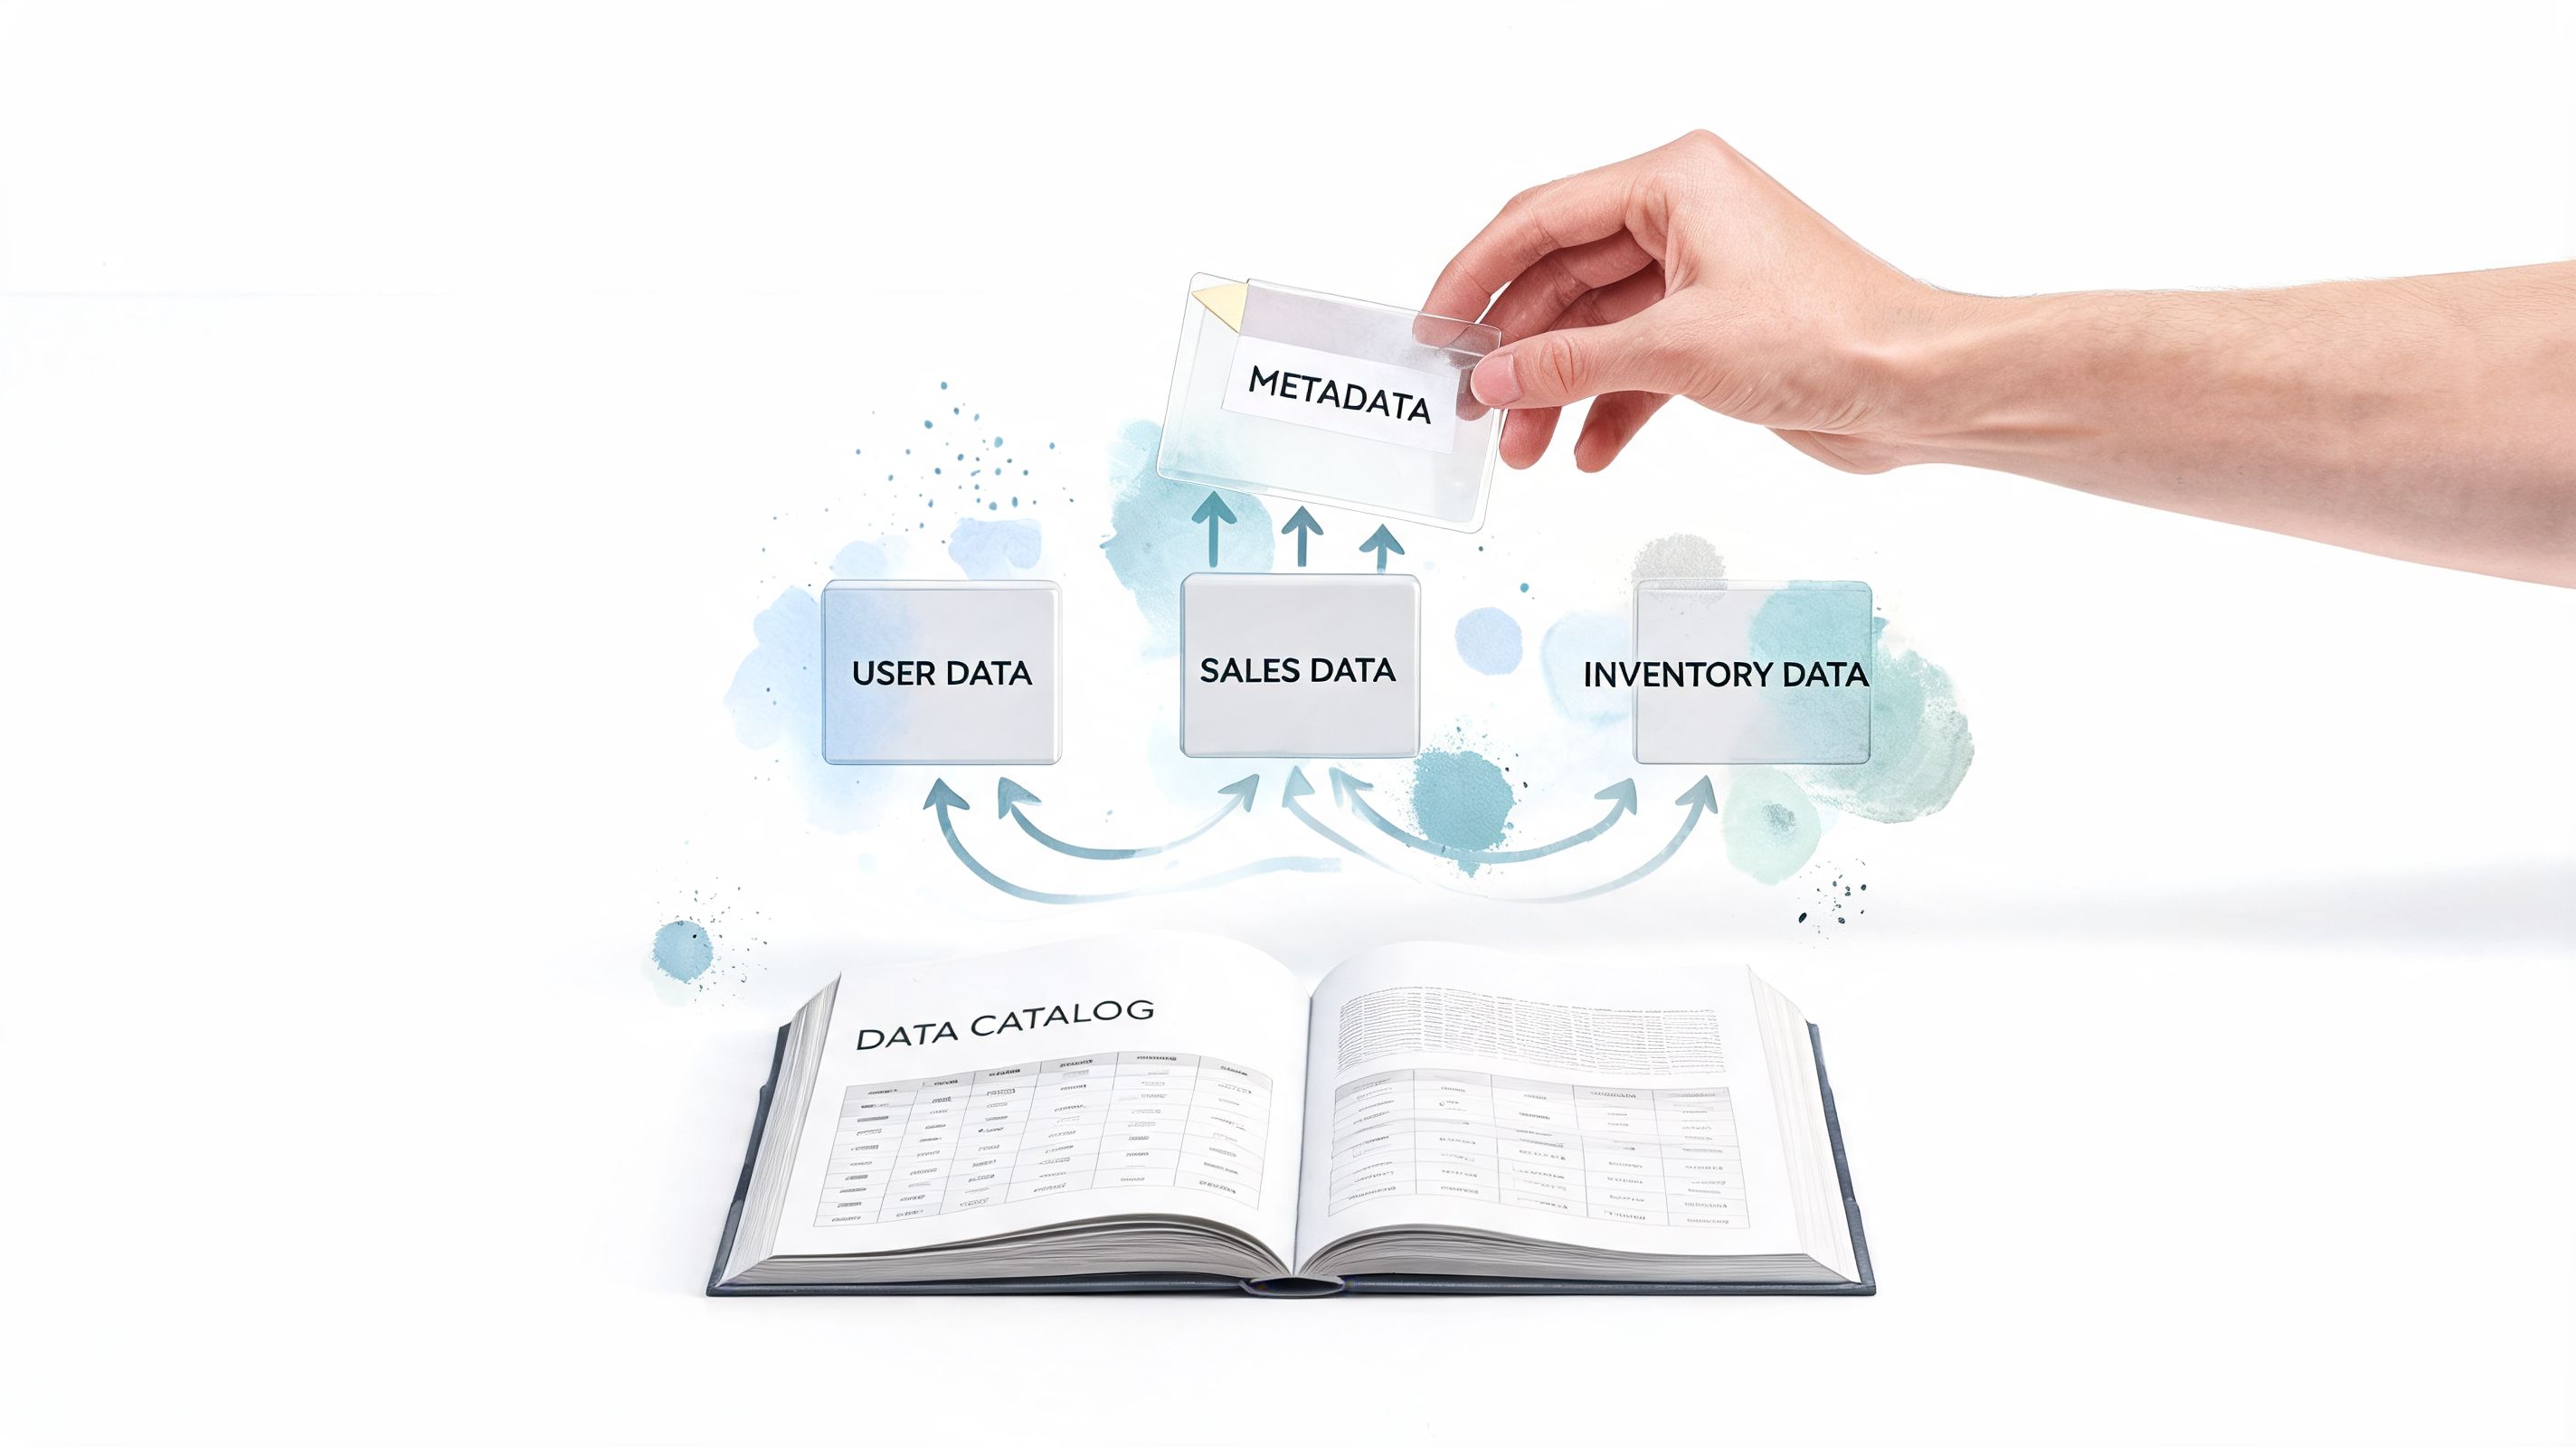
What a useful catalog actually includes
The best catalogs aren't giant museum archives. They're practical inventories tied to day-to-day work.
Business meaning: Define what a table or field represents in plain English, not warehouse shorthand.
Ownership: Show the person or team responsible for keeping it accurate and documented.
Sensitivity: Mark whether the data includes customer, financial, or other restricted information.
Lineage clues: Show where the data came from and what it feeds downstream.
Trust signals: Mark certified or approved datasets so self-serve users don't grab the wrong one.
Start with the sources people ask about every week. Revenue. Customers. Pipeline. Product usage. Don't begin with obscure archival data that no one touches.
Practical rule: If a new PM can't find the right revenue table in a few minutes, your catalog isn't done.
This matters even more if you're using a Conversational AI Data Analyst like Statspresso. AI can answer quickly, but it still needs the right map. Well-tagged metadata helps the system surface trusted metrics instead of random lookalikes.
Try asking Statspresso: "What are the certified datasets for revenue, customers, and subscriptions?"
2. Assign owners like you mean it
If nobody owns a dataset, your self-serve analytics will slow to a crawl. People stop trusting the numbers, questions pile up in Slack, and every dashboard review turns into a debate about whose version is right.
Ownership fixes that. Fast.
The mistake I see in startups is assigning responsibility to "the data team" and calling it done. That works for about five minutes. Then marketing changes lead stages, finance updates revenue logic, product renames events, and no one knows who can approve the fallout. Clear ownership is what keeps self-serve tools useful instead of turning them into very fast ways to spread confusion.
Pick an ownership model that matches how the company runs
A single central team sounds tidy, but it often becomes a bottleneck. A fully decentralized model moves faster at first, then definitions drift and reporting breaks across teams.
A hybrid model usually holds up better. Core data such as customer, revenue, billing, and compliance-heavy fields can have tighter central oversight. Domain teams like product, growth, sales, and operations should still own the meaning and day-to-day decisions for the data they create.
That split reflects real life. Platform teams manage the pipes. Business teams own the context.
A practical model looks like this:
Data owners: Decide what the dataset means, who should use it, and what "correct" looks like for the business.
Data stewards: Keep documentation current, follow up on issues, and make sure changes do not die in a backlog.
Platform or engineering teams: Run pipelines, storage, permissions, and technical controls.
If your CRM data is used by sales, marketing, finance, and support, someone still needs final say on definitions and change approval. Shared data needs named accountability, not shared ambiguity.
Make ownership visible and operational
Ownership only works if people can find it in the moment they need help. Put the owner next to the dataset in your catalog, glossary, BI tool, and request workflow. If a founder spots a broken MRR number before a board meeting, they should know exactly who to contact.
Set a few simple operating rules too. Who approves a metric change? Who responds when a source breaks? Who signs off before a field gets deprecated? Write those rules down. Keep them short enough that people will read them.
Data without an owner works like a shared office kitchen. Everyone uses it, but nobody cleans up the mess.
This matters even more with self-serve analytics and AI tools like Statspresso. The tool can surface an answer fast. It still needs a clear signal for who owns the source, who approved the metric, and who should review exceptions.
Try asking Statspresso: "Who owns our customer acquisition datasets and which metrics depend on them?"
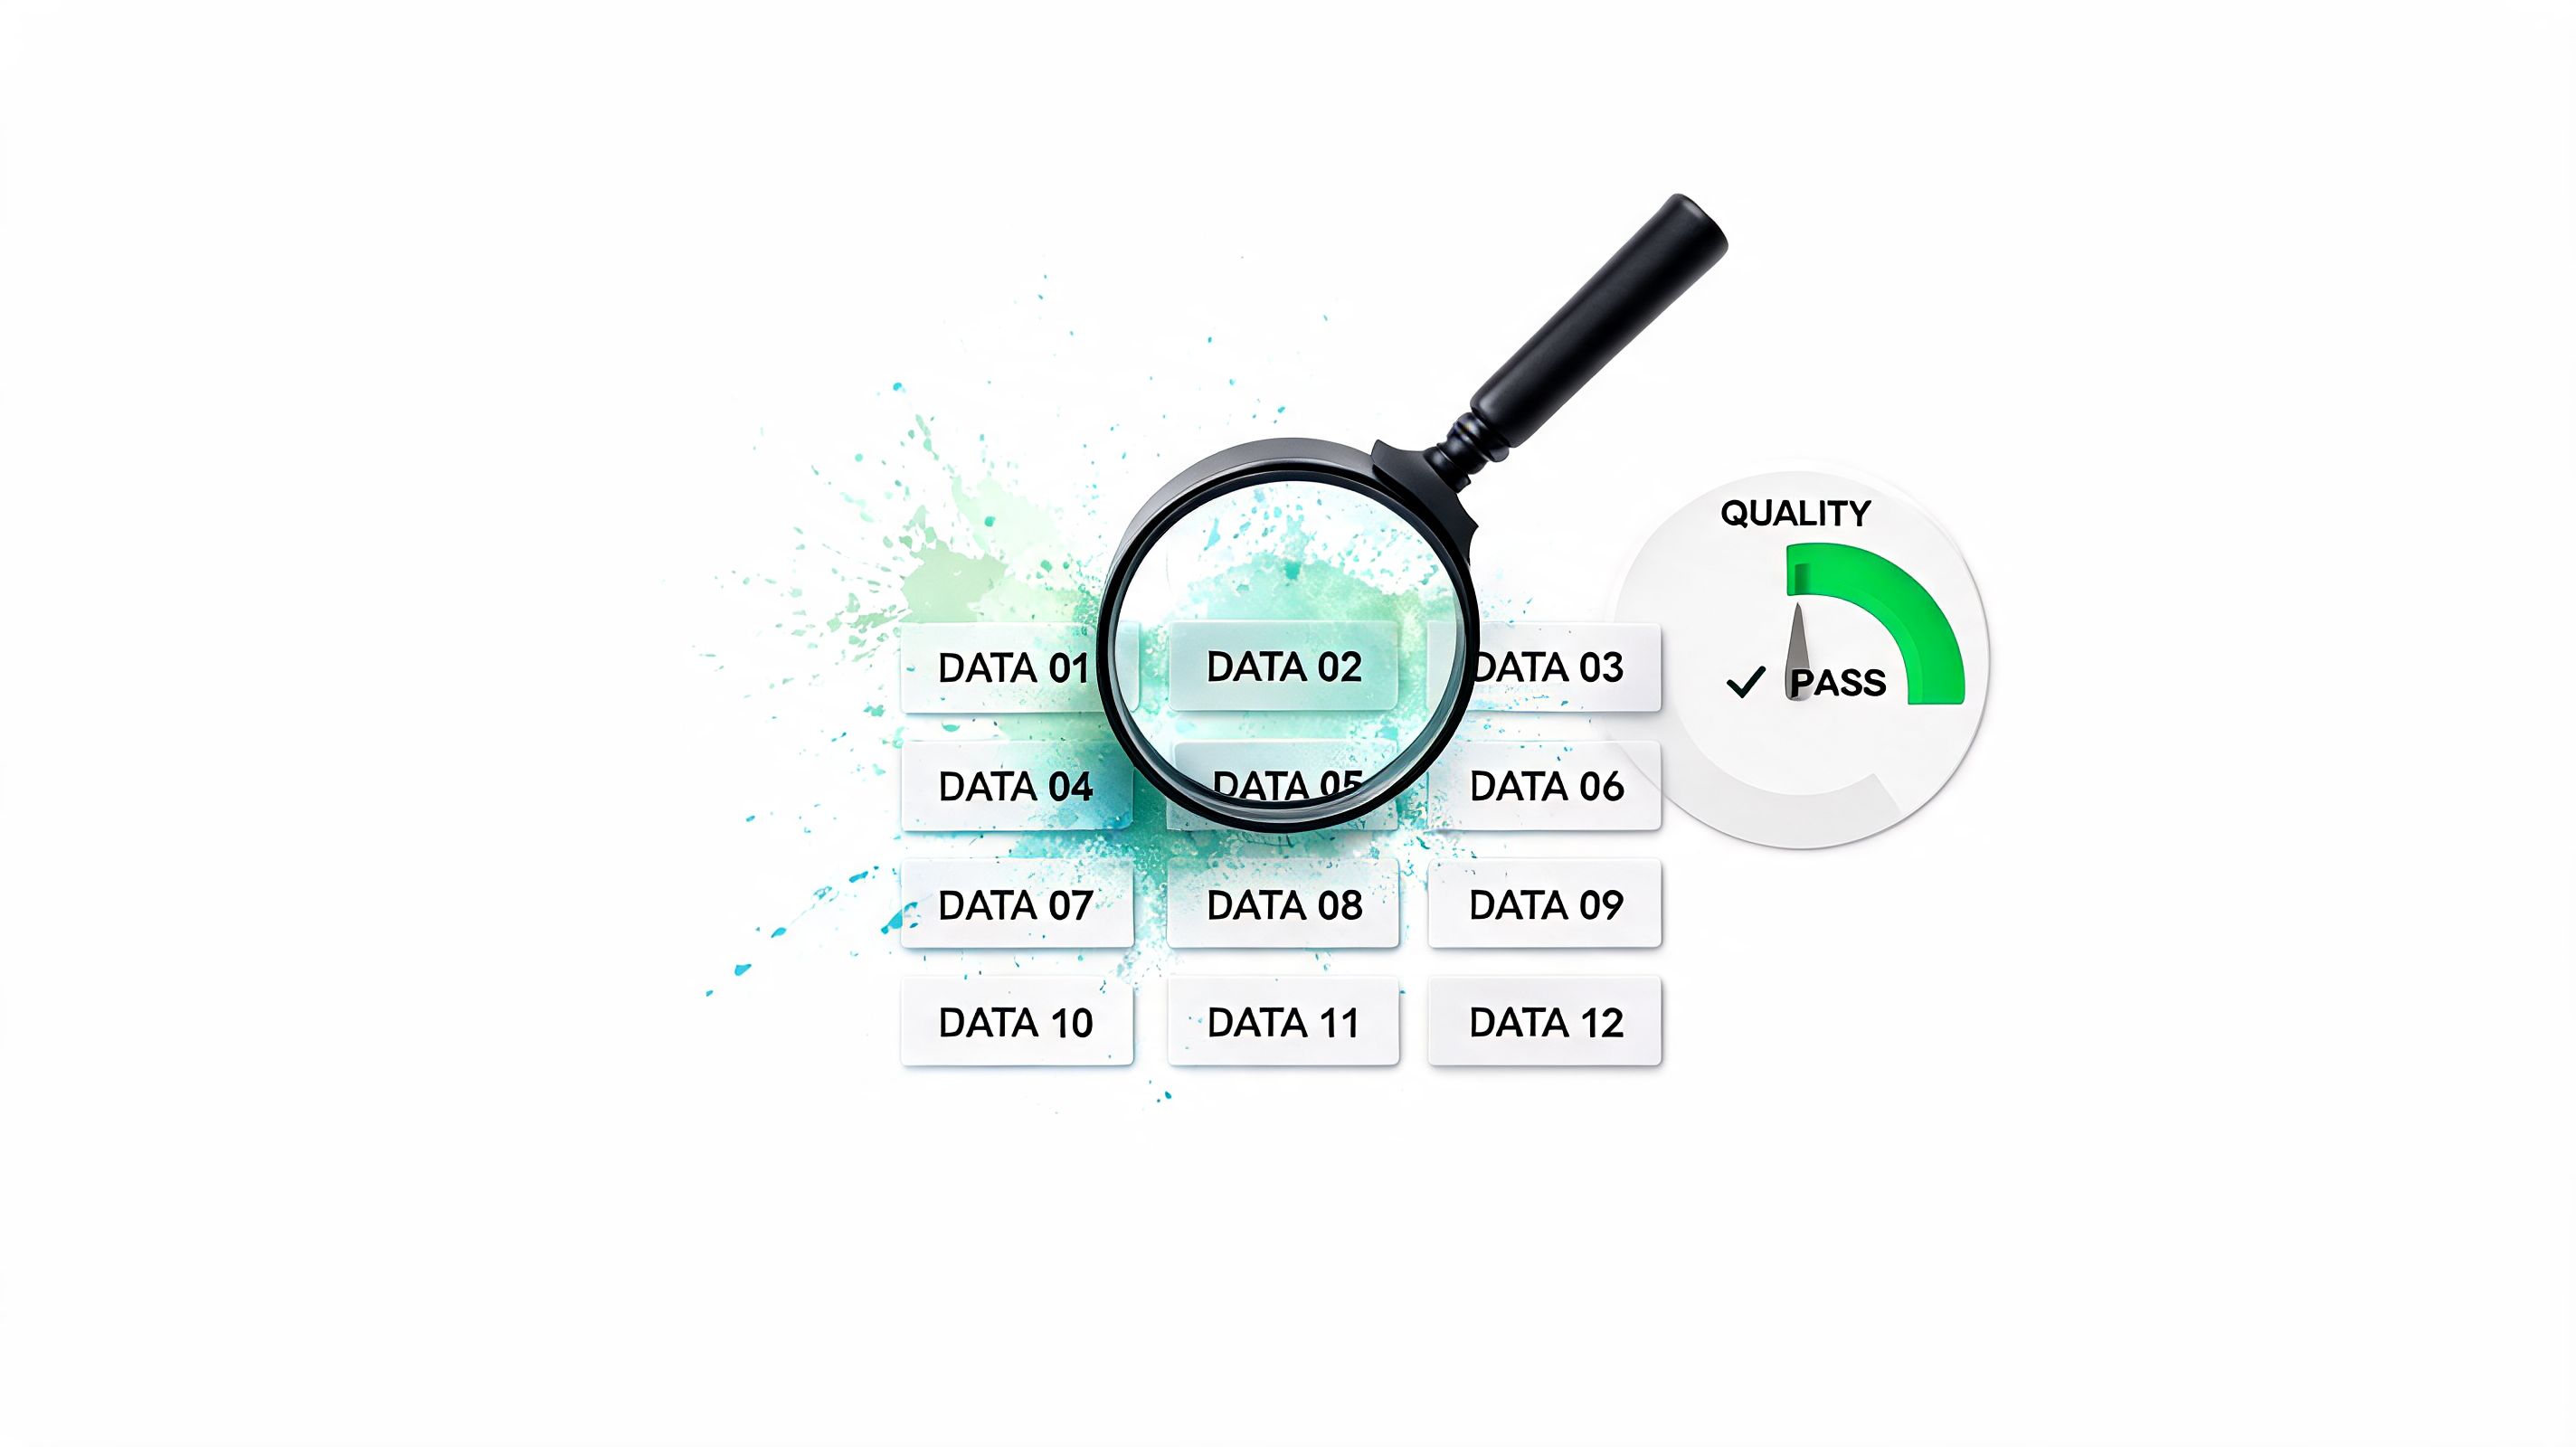
3. Set data quality rules that match business reality
Bad data does not slow teams down in theory. It burns real hours, creates boardroom arguments, and makes self-serve analytics feel risky. If leaders cannot trust the revenue chart or customer counts, they go back to Slack threads and analyst fire drills.
The fix is not a giant quality program. It is a short list of rules tied to decisions people make every week.
Start with business risk, not abstract perfection
Busy startup teams do not need every field cleaned to laboratory standards. They need the numbers that drive pricing, hiring, pipeline reviews, retention work, and investor updates to hold up under pressure.
That means setting quality rules around the data that changes decisions first: revenue, customer lifecycle stage, product usage events, sales stages, inventory, and attribution. A messy free-text field can wait. A broken booking total cannot.
I usually ask one blunt question: if this field is wrong for a month, who makes a bad decision and what does it cost? That question cuts through a lot of governance theater.
Use rules people outside data can explain
A useful quality standard fits into plain English. Four checks cover most of the ground:
Accuracy: Does the value match what happened in the business?
Completeness: Are required fields present at the point they are needed?
Uniqueness: Are duplicate customers, orders, accounts, or leads creeping in?
Consistency: Does the same metric or label mean the same thing across systems?
That is enough to get started. If the team creates fifty rules with no clear owner or consequence, they will fail. A smaller set tied to business pain usually gets fixed faster and earns trust faster too.
A simple example helps. If finance closes revenue from the billing system, sales forecasts from the CRM, and product teams report active customers from app events, consistency rules matter more than cosmetic cleanup. Three systems can all be "correct" in isolation and still produce three different stories.
Put checks where data breaks
Quality checks belong in pipelines, ingestion jobs, and metric definitions. They do not belong only in a quarterly review deck.
Good rules usually cover a few predictable failure modes:
Schema changes: A source field changes type, disappears, or gets renamed.
Null spikes: Required values suddenly go missing after a form change or sync failure.
Duplicate records: Orders, contacts, or subscriptions get counted twice.
Freshness issues: Yesterday's load never arrived, but the dashboard still looks official.
Threshold exceptions: Refunds, conversion rates, or signups jump in a way that needs review.
Startups win or lose trust in self-serve tools through this critical interaction. If a founder asks Statspresso for weekly MRR and the source table failed six hours earlier, the system should surface the warning, not just return a confident-looking answer.
Define what happens after a rule fails
A failed check without a response path is just a notification nobody wants. Route issues to the right owner, log the decision, and show what downstream metrics may be affected.
Keep the workflow simple:
Detect the issue early
Send it to a named owner
Record whether it was fixed, accepted, or deferred
Flag impacted dashboards, metrics, or AI-generated answers
That last step matters more than teams expect. People can work around known issues. They lose trust when problems stay hidden and show up later in a board deck.
For a practical reminder of how bad inputs corrupt every downstream output, see TrainsetAI's data quality insights.
Try asking Statspresso: "Show me missing value trends and freshness checks for our order, customer, and revenue datasets."
4. Lock down sensitive data without locking up the business
Some teams hear "governance" and picture a giant red STOP sign. That's bad governance. Good governance is a traffic system. It keeps the dangerous stuff controlled while letting normal movement keep flowing.
Access control should follow least privilege. People should see what they need to do their jobs, and not much more. That sounds obvious until an intern can query payroll-adjacent tables because someone cloned an old analyst role six months ago.
Put guardrails where risk actually lives
The cleanest setup usually combines role-based access with more precise controls where needed. If you're handling client data, healthcare information, finance records, or customer PII, broad table access isn't enough.
Practical controls include:
Role-based access: Finance, product, marketing, and support shouldn't all get the same data by default.
Row-level security: Let users analyze patterns without exposing every raw record.
Field restrictions: Hide or mask sensitive columns like email, payment details, or health information.
Tenant isolation: Critical for agencies and SaaS products serving multiple customers in one environment.
An agency using Statspresso, for example, should let each client see only their own analytics. A SaaS company embedding analytics should isolate tenant data at the data layer, not rely on good intentions.
TrainsetAI's take on garbage-in-garbage-out data quality is a useful reminder here. Bad access and bad quality often travel together. When teams pull data into shadow spreadsheets because official access is too rigid, governance gets weaker, not stronger.
Review permissions like they're temporary
Access tends to accumulate. People switch roles. Contractors leave. Old projects die. Permissions stay.
Use recurring audits to remove stale access, check whether classification still makes sense, and confirm that high-risk data has stronger handling rules. Privacy policy isn't just a legal document. It's a product design choice, an analytics design choice, and a trust choice.
Try asking Statspresso: "Which datasets in this workspace contain restricted fields, and who can access them?"
5. Govern the plumbing, not just the reports
Most reporting problems start upstream. The dashboard didn't "break itself." Something changed in Shopify, HubSpot, Stripe, Postgres, or the transformation layer between them.
That's why source system management belongs on any serious list of best practices for data governance. If ingestion is chaotic, every polished chart at the end is built on wobbly flooring.
Standardize what comes in
Different systems describe the same business reality in different ways. One tool says "customer." Another says "contact." A product database stores "user_id," while billing uses "account_id." If nobody maps those consistently, teams argue forever about basic counts.
Create a small set of standard business entities and map source data into them. Customer. Account. Order. Subscription. Product. Campaign. Ticket. Keep the model boring. Boring scales.
A disciplined integration setup usually includes:
Source mapping rules: Document how each field from Shopify, HubSpot, or Postgres maps into shared entities.
Ingestion checks: Validate schema expectations and required fields before bad data spreads.
Transformation tests: Confirm that joins, currency handling, status mappings, and time logic behave as expected.
Pipeline visibility: Show failures fast so teams don't discover them in a board meeting.
Don't let tribal knowledge run your pipelines
If only one analyst understands how leads become "qualified pipeline" in the warehouse, you don't have a pipeline. You have a hostage situation.
Document transformation logic in language business teams can follow. Why was a field renamed? Why does one order table exclude refunds while another includes them? Why is timezone handling different for app events and CRM events? The answers should exist somewhere besides one person's memory.
Reliable analytics starts long before the chart. It starts where the data enters the building.
Try asking Statspresso: "Compare source totals from Shopify and our modeled sales table for the last completed month."
6. Create a business glossary before arguments become policy
If your team needs a meeting to decide what a metric means, governance already failed.
The fight usually starts with familiar terms that sound obvious. "Active customer." "Churn." "Pipeline." "Net revenue." Sales means one thing, finance means another, product has a third version in Mixpanel, and the CEO assumes everyone is talking about the same number. They are not.
A business glossary gives shared terms a definition, an owner, and enough context to settle the argument before it turns into a reporting policy nobody trusts. For a startup, that matters because self-serve analytics only works when people can pull numbers without reopening old debates. Fast access to data is useless if every answer needs translation.
Define the metrics that burn time first
Start with the terms that repeatedly slow decisions down. Revenue. Active users. MRR. ARR. Churn. Qualified lead. Conversion. Retention. CAC. Refunds. Net sales.
Keep the first version small and used. That approach lines up with Atlan's guidance on governance adoption challenges, which notes that adoption breaks down when governance gets too broad and disconnected from daily work. I have seen teams spend months building a giant dictionary, then continue arguing over three numbers in the board deck because nobody maintained the entries that mattered.
Each glossary entry should answer five practical questions:
What does it mean? Write the definition in plain English.
How is it calculated? Include enough logic to reproduce the number.
What does it depend on? Name the source tables, filters, and exclusions.
Who owns it? One person or team approves changes.
How fresh should it be? Set expectation for update cadence and lag.
Good glossary entries prevent fake alignment. Two teams can both agree that "churn" matters while measuring completely different behaviors. The glossary forces the hard part. Picking one definition, recording the trade-off, and using it consistently.
Put definitions where people actually look
A glossary buried in Notion helps the data team. It does not help a founder checking a dashboard five minutes before an investor call.
Definitions need to show up where decisions happen, inside the BI layer, next to the metric, or in the analytics tool people already use. That is how governance speeds the business up instead of slowing it down. Statspresso can support that model by surfacing approved metric definitions when someone asks a question, so users get the answer and the meaning at the same time.
Try asking Statspresso: "Define active customer, net revenue, and pipeline coverage using our approved business glossary."
7. Track lineage so changes don't turn into surprises
Lineage sounds technical, but the idea is simple. If a number changes, can you trace where it came from and what else it affects?
Without lineage, every broken metric becomes a scavenger hunt. The CRM field changed. A dbt model updated. A warehouse table got deprecated. A dashboard still points at the old logic. Nobody notices until leadership asks why revenue changed.
Start with the metrics people trust most
You don't need complete lineage for every table on day one. Begin with the high-stakes stuff. Board metrics. Revenue reporting. Customer growth. Product engagement. Sales pipeline. Anything that feeds major decisions or AI-generated summaries.
Map the flow from source to output:
Origin: Which source system or operational table starts the chain?
Transformations: What models, joins, filters, or calculations alter it?
Consumption points: Which dashboards, exports, or analytics tools depend on it?
Change risk: Who needs a heads-up if the schema or logic changes?
Governance takes on a very practical dimension. A PM doesn't need to love metadata. They just need to know whether renaming a field will inadvertently wreck six downstream reports.
Use impact analysis before changing shared data
The cheapest time to catch a data problem is before the change ships. If you're updating event names, replacing a pipeline, or deprecating a field, run impact analysis first.
That means asking simple questions. What uses this field today? Which teams rely on this metric? Which AI answers or dashboards may change? If the answer is "we're not sure," stop and map it before touching production.
The point of lineage isn't documentation for its own sake. It's fewer nasty surprises on Monday morning.
Try asking Statspresso: "Which source systems and modeled datasets feed our trial-to-paid conversion metric?"
8. Enable self serve analytics with guardrails
Self-serve analytics fails for one of two reasons. Either it's so open that everyone creates their own truth, or it's so restricted that nobody uses it. The sweet spot is governed discovery.
That means people can explore without asking for SQL help every time, but they do it inside boundaries that preserve trust. Access controls run in the background. Certified metrics are easy to find. Sensitive data stays protected. Definitions are visible.

Make the safe path the easy path
Most users won't resist governance if it saves them time. They resist busywork. If the approved metric is buried and the ungoverned CSV is easier to access, guess which one wins.
Good governed self-service usually includes:
Certified starting points: Put trusted datasets and metrics first.
Natural-language access: Let non-technical users ask business questions directly.
Embedded definitions: Show what a metric means at the moment it's used.
Invisible enforcement: Permissions and data rules should work in the background.
That model is a big part of why teams move toward self-serve business intelligence. You don't want every question to become a backlog ticket.
Give people examples, not just permission
Users need a starting script. A blank query box can feel smarter than it is.
For a Conversational AI Data Analyst like Statspresso, practical prompts matter:
Revenue question: "Show monthly net revenue as a line chart."
Marketing question: "Break down qualified leads by channel for the last full quarter."
Product question: "Which features were used most by active accounts this month?"
Customer question: "Compare churned accounts versus retained accounts by plan."
If governance is working, users get fast answers from approved data without needing to understand warehouse internals.
9. Measure governance like an operating system
Governance needs the same discipline as finance, uptime, or customer support. If you cannot measure whether it is working, it turns into a policy archive that nobody trusts and nobody uses.
That matters even more in a startup. Leaders do not fund governance to feel organized. They fund it so teams can answer questions faster, trust shared metrics, and stop burning hours in Slack debates about which number is right.
OneTrust's data governance framework recommends setting clear goals and metrics so teams can monitor progress and improve over time. Varonis outlines data governance KPIs such as stale data removed, folders with assigned owners, and sensitive data creation. Both point to the same operating principle. Measure the work that keeps data usable, safe, and ready for self-serve analysis.
Start with a small scorecard
Skip the giant maturity exercise unless you need it for an audit or board process. Early-stage teams usually need a scoreboard, not a six-month taxonomy project.
A useful governance scorecard fits on one page and answers a simple question: can people get trusted answers without creating new risk?
Track a few indicators that tie directly to daily use:
Ownership coverage: The share of critical datasets with a named owner who responds when something breaks.
Definition coverage: The share of priority metrics with an approved business definition.
Issue resolution time: How long data-quality incidents stay open before someone fixes them.
Access hygiene: Whether outdated permissions, stale files, and abandoned assets are being cleaned up.
Policy adherence: Whether sensitive data is stored, shared, and queried the way your rules say it should be.
Those measures are boring. Good. Boring metrics run companies.
Measure trust, speed, and cleanup
I have seen plenty of teams track policy counts because they are easy to present. That misses the point. Fifty policies do not help a growth lead who needs a reliable pipeline number before the Monday forecast call.
Good governance metrics usually fall into three buckets.
Trust: Do people believe the approved numbers?
Speed: Can they get answers without waiting on the data team?
Cleanup: Are you reducing the mess that creates future errors and access risk?
That framing keeps governance tied to outcomes instead of paperwork. It also makes ROI easier to explain to a founder. Fewer broken dashboards. Faster reporting cycles. Less analyst time spent reconciling exports. More confidence in tools like Statspresso because the underlying data is owned, defined, and monitored.
Improve in short rounds
Treat governance like product ops. Ship a small control set, measure what happened, fix what did not work, and expand from there.
For a startup, that might mean one domain first. Revenue data, customer data, or marketing attribution. Get ownership coverage up. Certify the handful of metrics people use in every planning meeting. Reduce open data issues. Then move to the next domain.
A functioning house beats a blueprint for a mansion.
Try asking Statspresso: "Show stewarded asset coverage, open data issues, and time to resolution by business domain."
10. Treat governance as a people problem first
The hardest part of governance isn't the metadata model. It's getting humans to care before the next fire drill.
Policies fail when they live outside normal work. Teams ignore them, work around them, or treat them as "data team stuff." Then the same trust problems keep showing up under new names.
Tie governance to daily behavior
People adopt governance when it helps them avoid pain. Better campaign reporting. Fewer metric disputes. Less time spent validating dashboards. Faster answers for leadership. Safer client reporting.
The fix is operational, not inspirational:
Train by role: Owners, analysts, PMs, marketers, and executives need different guidance.
Build into tools: Put definitions, ownership, and access controls where people already work.
Celebrate wins: Share examples where governance reduced confusion or sped up a decision.
Keep language simple: "Who owns this?" works better than "Please align with enterprise stewardship protocols."
Leadership has to model it
If executives ignore defined metrics and ask for one-off spreadsheet numbers, everyone else will too. If leaders use approved definitions and ask who owns disputed data, governance becomes normal.
The best programs make trust visible. Teams know which numbers are approved. They know who to ask. They know how issues get resolved. That's culture, even if nobody calls it that.
Governance sticks when people feel its absence immediately. A broken trusted metric gets attention. A forgotten policy document doesn't.
Try asking Statspresso: "Which teams use uncertified metrics most often, and where should we tighten documentation?"
Data Governance for Shopify Stores
Shopify creates governance challenges that generic data governance frameworks don't anticipate. The data model is messier than it looks: a single "customer" can have multiple email addresses, multiple Shopify accounts (guest checkout vs. registered), and purchase history split across your main store and any secondary storefronts. Before you can govern anything, you have to decide what you're governing.
Here are the five governance decisions every Shopify operator needs to make before their data gets complicated:
1. Define what "customer" means in your Shopify data
Shopify creates a customer record when an email address places an order. But a guest checkout and a registered account with the same email are not automatically merged. Your repeat purchase rate, CLV, and retention numbers will be wrong if you're counting email addresses instead of actual people.
The governance decision: choose a canonical customer identifier (email is usually safest), deduplicate on it, and document the rule. Set who owns it — typically the person running Shopify or your growth analytics. Without that decision in writing, every CLV number is a guess.
2. Standardize your order status definitions
Shopify order statuses (pending, authorized, paid, partially_refunded, refunded, voided) don't map directly to business outcomes without interpretation. "Paid" doesn't mean fulfilled. "Refunded" doesn't always mean a return. A partial refund can mean a discount applied after the fact, a damaged item replaced, or a genuine return.
Write one sentence for each order state: what it means for your business, whether it counts toward revenue, and who can change the definition. This is boring work. It prevents four different revenue numbers appearing in the same board meeting.
3. Agree on your attribution window rules
Shopify's Marketing report uses a last-click, 30-day window by default. Your Meta Ads account probably uses a 7-day click / 1-day view window. Your email tool has its own attribution. If you're connecting these sources in any analytics tool, you need one rule — or explicit labeling of which window each number uses — or you'll be triple-counting conversions across channels.
The governance decision: pick one attribution model for business decisions (not reporting to each ad platform), document it, and use it consistently everywhere. Most Shopify businesses use last-click, 14-day for internal reporting. What matters is consistency, not perfection.
4. Catalog your third-party app data
The average Shopify store over $500K in revenue runs 12–20 apps. Each one creates its own data: reviews, loyalty points, subscription billing records, upsell events, post-purchase surveys. Most founders don't know which data lives where and what's actually queryable.
A simple Shopify data catalog lists every app, what data it generates, where that data is (Shopify metafields, the app's own database, or an export), and whether it's being used in any report. This takes one afternoon to build and saves days of confusion later. Connect what you need — Statspresso connects Shopify directly and lets you query orders, customers, products, and refunds in plain English — and document which app data is excluded.
5. Set a definition for "active subscriber" if you run subscriptions
If you sell subscriptions on Shopify (via ReCharge, Shopify Subscriptions, or Bold), "subscriber count" is ambiguous out of the box. Does it include paused subscriptions? Subscriptions that skipped the last charge? Subscriptions pending cancellation? Each platform counts differently.
Pick a definition (typically: active means charged within the last billing cycle, not paused, not pending cancellation) and set it as the agreed-upon rule. One sentence. Named owner. Done.
Data Governance Checklist by Company Stage
Governance needs grow with the company. What matters at $500K ARR is different from what matters at $5M. Here's the right level of governance rigor for each stage:
Stage | Revenue range | Must-do governance | Nice-to-have | Skip for now |
|---|---|---|---|---|
Pre-PMF | $0–$500K ARR | Clean customer email list; define "revenue" (gross or net); name one data owner | Basic glossary (5 terms) | Formal lineage tracking, access roles |
Early traction | $500K–$2M ARR | Standardize 5–8 KPIs; document data sources; assign domain ownership (sales, marketing, product) | Metric definitions in your BI tool; lightweight catalog | Full metadata taxonomy, automated quality checks |
Growth | $2M–$10M ARR | Formal business glossary; ingestion quality checks; role-based data access; lineage for board metrics | Self-serve analytics with guardrails; data contracts between teams | Enterprise-grade DLP, cross-cloud governance tooling |
Scale | $10M+ ARR | Full data catalog; automated quality monitoring; tenant isolation (for B2B SaaS); compliance controls | Governance maturity model; cross-functional data council | Nothing — everything belongs at this stage |
The most common mistake: applying scale-stage governance to an early-traction business. Sixty-page data governance policies and enterprise catalog tools create compliance theater without delivering faster decisions. Start with the decisions in the row that matches your current stage, do them well, and move to the next row when the company size demands it.
10-Point Data Governance Best Practices Comparison
Practice | Implementation complexity | Resource requirements | Expected outcomes | Ideal use cases | Key advantages |
|---|---|---|---|---|---|
Data Catalog and Metadata Management | High initial effort, moderate ongoing | Metadata tools, data engineers, stewards | Faster discovery, lineage visibility, trusted sources | Organizations with many data assets, AI analytics platforms | Improved discoverability, onboarding, compliance |
Data Ownership and Stewardship Model | Medium (policy + org change) | Designated owners/stewards, training, governance time | Clear accountability, faster issue resolution | Self-serve analytics, cross-functional teams | Ownership-driven data quality, faster decisions |
Data Quality Standards and Monitoring | Medium–High (rule definition + tooling) | Monitoring tools, SRE/data engineers, QA workflows | Early detection of issues, reliable analytics | High-stakes reporting, ML training datasets | Prevents bad data, reduces manual validation |
Data Access Control and Privacy Framework | High (granular controls + compliance) | Security tooling, legal/compliance, ops maintenance | Protected data, regulatory compliance, safe sharing | Regulated industries, multi-tenant SaaS, sensitive data | Reduces breach risk, enables compliant sharing |
Data Integration and Source System Management | Medium–High (pipelines & transformations) | ETL/ELT tools, integration engineers, docs | Consistent normalized data, scalable ingestion | Multi-source environments (Shopify, HubSpot, Postgres) | Reliable pipelines, faster time-to-insight |
Metrics Definition and Business Glossary | Medium (consensus + documentation) | SMEs, documentation platform, governance cadence | Consistent KPIs, clearer reporting, aligned language | Organizations needing unified metrics and reporting | Eliminates ambiguity, trusted metrics, consistent reporting |
Data Lineage and Impact Analysis | High (metadata aggregation + visualization) | Lineage tools, metadata sources, engineering effort | Faster root-cause, safer schema changes, impact visibility | Complex pipelines, frequent schema or ETL changes | Traceability, impact forecasting, reduced breakages |
Self-Service Analytics with Governed Discovery | Medium (requires governance foundations) | Analytics platform, curated metrics, user training | Faster answers, wider adoption, lower BI backlog | Product managers, growth teams, non-technical users | Empowers users, increases decision velocity, preserves guardrails |
Data Governance Maturity Model and Continuous Improvement | Low–Medium (framework + assessments) | Stakeholder time, assessment tools, roadmap planning | Prioritized improvements, measurable progress over time | Organizations plann... |
Data governance is what lets a startup answer basic questions quickly and trust the answer. Done well, it cuts rework, reduces analyst queues, and gives teams a safe way to use self-serve analytics instead of waiting on IT to bless every report.
That matters because fast growth creates messy data fast. Shopify, HubSpot, product events, billing records, and a few "temporary" spreadsheets pile up until every metric turns into a debate. The problem usually is not data access. It is unclear ownership, inconsistent definitions, and no shared rules for what is safe and reliable to use.
Good governance fixes that by making the right data easier to find and easier to trust. It gives teams enough structure to move faster with tools like Statspresso, instead of slowing everyone down with approval loops and one-off dashboard requests. The trade-off is real. A little discipline up front saves a lot of cleanup later.
If you want the short version first, here are some actionable data governance tips. If you want the practical version, keep going.
1. Build a data catalog before you buy more dashboards
A company without a catalog usually has the same problem as a garage with no shelves. The tools aren't the issue. Nobody knows where anything is, which version is current, or whether the thing they found still works.
A usable data catalog should answer basic questions fast. What data exists? Where does it live? Who owns it? Is it safe to use? If a growth lead opens "customers_final_v2_revised," that file name alone tells you governance has already lost.
What a useful catalog actually includes
The best catalogs aren't giant museum archives. They're practical inventories tied to day-to-day work.
Business meaning: Define what a table or field represents in plain English, not warehouse shorthand.
Ownership: Show the person or team responsible for keeping it accurate and documented.
Sensitivity: Mark whether the data includes customer, financial, or other restricted information.
Lineage clues: Show where the data came from and what it feeds downstream.
Trust signals: Mark certified or approved datasets so self-serve users don't grab the wrong one.
Start with the sources people ask about every week. Revenue. Customers. Pipeline. Product usage. Don't begin with obscure archival data that no one touches.
Practical rule: If a new PM can't find the right revenue table in a few minutes, your catalog isn't done.
This matters even more if you're using a Conversational AI Data Analyst like Statspresso. AI can answer quickly, but it still needs the right map. Well-tagged metadata helps the system surface trusted metrics instead of random lookalikes.
Try asking Statspresso: "What are the certified datasets for revenue, customers, and subscriptions?"
2. Assign owners like you mean it
If nobody owns a dataset, your self-serve analytics will slow to a crawl. People stop trusting the numbers, questions pile up in Slack, and every dashboard review turns into a debate about whose version is right.
Ownership fixes that. Fast.
The mistake I see in startups is assigning responsibility to "the data team" and calling it done. That works for about five minutes. Then marketing changes lead stages, finance updates revenue logic, product renames events, and no one knows who can approve the fallout. Clear ownership is what keeps self-serve tools useful instead of turning them into very fast ways to spread confusion.
Pick an ownership model that matches how the company runs
A single central team sounds tidy, but it often becomes a bottleneck. A fully decentralized model moves faster at first, then definitions drift and reporting breaks across teams.
A hybrid model usually holds up better. Core data such as customer, revenue, billing, and compliance-heavy fields can have tighter central oversight. Domain teams like product, growth, sales, and operations should still own the meaning and day-to-day decisions for the data they create.
That split reflects real life. Platform teams manage the pipes. Business teams own the context.
A practical model looks like this:
Data owners: Decide what the dataset means, who should use it, and what "correct" looks like for the business.
Data stewards: Keep documentation current, follow up on issues, and make sure changes do not die in a backlog.
Platform or engineering teams: Run pipelines, storage, permissions, and technical controls.
If your CRM data is used by sales, marketing, finance, and support, someone still needs final say on definitions and change approval. Shared data needs named accountability, not shared ambiguity.
Make ownership visible and operational
Ownership only works if people can find it in the moment they need help. Put the owner next to the dataset in your catalog, glossary, BI tool, and request workflow. If a founder spots a broken MRR number before a board meeting, they should know exactly who to contact.
Set a few simple operating rules too. Who approves a metric change? Who responds when a source breaks? Who signs off before a field gets deprecated? Write those rules down. Keep them short enough that people will read them.
Data without an owner works like a shared office kitchen. Everyone uses it, but nobody cleans up the mess.
This matters even more with self-serve analytics and AI tools like Statspresso. The tool can surface an answer fast. It still needs a clear signal for who owns the source, who approved the metric, and who should review exceptions.
Try asking Statspresso: "Who owns our customer acquisition datasets and which metrics depend on them?"
3. Set data quality rules that match business reality
Bad data does not slow teams down in theory. It burns real hours, creates boardroom arguments, and makes self-serve analytics feel risky. If leaders cannot trust the revenue chart or customer counts, they go back to Slack threads and analyst fire drills.
The fix is not a giant quality program. It is a short list of rules tied to decisions people make every week.
Start with business risk, not abstract perfection
Busy startup teams do not need every field cleaned to laboratory standards. They need the numbers that drive pricing, hiring, pipeline reviews, retention work, and investor updates to hold up under pressure.
That means setting quality rules around the data that changes decisions first: revenue, customer lifecycle stage, product usage events, sales stages, inventory, and attribution. A messy free-text field can wait. A broken booking total cannot.
I usually ask one blunt question: if this field is wrong for a month, who makes a bad decision and what does it cost? That question cuts through a lot of governance theater.
Use rules people outside data can explain
A useful quality standard fits into plain English. Four checks cover most of the ground:
Accuracy: Does the value match what happened in the business?
Completeness: Are required fields present at the point they are needed?
Uniqueness: Are duplicate customers, orders, accounts, or leads creeping in?
Consistency: Does the same metric or label mean the same thing across systems?
That is enough to get started. If the team creates fifty rules with no clear owner or consequence, they will fail. A smaller set tied to business pain usually gets fixed faster and earns trust faster too.
A simple example helps. If finance closes revenue from the billing system, sales forecasts from the CRM, and product teams report active customers from app events, consistency rules matter more than cosmetic cleanup. Three systems can all be "correct" in isolation and still produce three different stories.
Put checks where data breaks
Quality checks belong in pipelines, ingestion jobs, and metric definitions. They do not belong only in a quarterly review deck.
Good rules usually cover a few predictable failure modes:
Schema changes: A source field changes type, disappears, or gets renamed.
Null spikes: Required values suddenly go missing after a form change or sync failure.
Duplicate records: Orders, contacts, or subscriptions get counted twice.
Freshness issues: Yesterday's load never arrived, but the dashboard still looks official.
Threshold exceptions: Refunds, conversion rates, or signups jump in a way that needs review.
Startups win or lose trust in self-serve tools through this critical interaction. If a founder asks Statspresso for weekly MRR and the source table failed six hours earlier, the system should surface the warning, not just return a confident-looking answer.
Define what happens after a rule fails
A failed check without a response path is just a notification nobody wants. Route issues to the right owner, log the decision, and show what downstream metrics may be affected.
Keep the workflow simple:
Detect the issue early
Send it to a named owner
Record whether it was fixed, accepted, or deferred
Flag impacted dashboards, metrics, or AI-generated answers
That last step matters more than teams expect. People can work around known issues. They lose trust when problems stay hidden and show up later in a board deck.
For a practical reminder of how bad inputs corrupt every downstream output, see TrainsetAI's data quality insights.
Try asking Statspresso: "Show me missing value trends and freshness checks for our order, customer, and revenue datasets."
4. Lock down sensitive data without locking up the business
Some teams hear "governance" and picture a giant red STOP sign. That's bad governance. Good governance is a traffic system. It keeps the dangerous stuff controlled while letting normal movement keep flowing.
Access control should follow least privilege. People should see what they need to do their jobs, and not much more. That sounds obvious until an intern can query payroll-adjacent tables because someone cloned an old analyst role six months ago.
Put guardrails where risk actually lives
The cleanest setup usually combines role-based access with more precise controls where needed. If you're handling client data, healthcare information, finance records, or customer PII, broad table access isn't enough.
Practical controls include:
Role-based access: Finance, product, marketing, and support shouldn't all get the same data by default.
Row-level security: Let users analyze patterns without exposing every raw record.
Field restrictions: Hide or mask sensitive columns like email, payment details, or health information.
Tenant isolation: Critical for agencies and SaaS products serving multiple customers in one environment.
An agency using Statspresso, for example, should let each client see only their own analytics. A SaaS company embedding analytics should isolate tenant data at the data layer, not rely on good intentions.
TrainsetAI's take on garbage-in-garbage-out data quality is a useful reminder here. Bad access and bad quality often travel together. When teams pull data into shadow spreadsheets because official access is too rigid, governance gets weaker, not stronger.
Review permissions like they're temporary
Access tends to accumulate. People switch roles. Contractors leave. Old projects die. Permissions stay.
Use recurring audits to remove stale access, check whether classification still makes sense, and confirm that high-risk data has stronger handling rules. Privacy policy isn't just a legal document. It's a product design choice, an analytics design choice, and a trust choice.
Try asking Statspresso: "Which datasets in this workspace contain restricted fields, and who can access them?"
5. Govern the plumbing, not just the reports
Most reporting problems start upstream. The dashboard didn't "break itself." Something changed in Shopify, HubSpot, Stripe, Postgres, or the transformation layer between them.
That's why source system management belongs on any serious list of best practices for data governance. If ingestion is chaotic, every polished chart at the end is built on wobbly flooring.
Standardize what comes in
Different systems describe the same business reality in different ways. One tool says "customer." Another says "contact." A product database stores "user_id," while billing uses "account_id." If nobody maps those consistently, teams argue forever about basic counts.
Create a small set of standard business entities and map source data into them. Customer. Account. Order. Subscription. Product. Campaign. Ticket. Keep the model boring. Boring scales.
A disciplined integration setup usually includes:
Source mapping rules: Document how each field from Shopify, HubSpot, or Postgres maps into shared entities.
Ingestion checks: Validate schema expectations and required fields before bad data spreads.
Transformation tests: Confirm that joins, currency handling, status mappings, and time logic behave as expected.
Pipeline visibility: Show failures fast so teams don't discover them in a board meeting.
Don't let tribal knowledge run your pipelines
If only one analyst understands how leads become "qualified pipeline" in the warehouse, you don't have a pipeline. You have a hostage situation.
Document transformation logic in language business teams can follow. Why was a field renamed? Why does one order table exclude refunds while another includes them? Why is timezone handling different for app events and CRM events? The answers should exist somewhere besides one person's memory.
Reliable analytics starts long before the chart. It starts where the data enters the building.
Try asking Statspresso: "Compare source totals from Shopify and our modeled sales table for the last completed month."
6. Create a business glossary before arguments become policy
If your team needs a meeting to decide what a metric means, governance already failed.
The fight usually starts with familiar terms that sound obvious. "Active customer." "Churn." "Pipeline." "Net revenue." Sales means one thing, finance means another, product has a third version in Mixpanel, and the CEO assumes everyone is talking about the same number. They are not.
A business glossary gives shared terms a definition, an owner, and enough context to settle the argument before it turns into a reporting policy nobody trusts. For a startup, that matters because self-serve analytics only works when people can pull numbers without reopening old debates. Fast access to data is useless if every answer needs translation.
Define the metrics that burn time first
Start with the terms that repeatedly slow decisions down. Revenue. Active users. MRR. ARR. Churn. Qualified lead. Conversion. Retention. CAC. Refunds. Net sales.
Keep the first version small and used. That approach lines up with Atlan's guidance on governance adoption challenges, which notes that adoption breaks down when governance gets too broad and disconnected from daily work. I have seen teams spend months building a giant dictionary, then continue arguing over three numbers in the board deck because nobody maintained the entries that mattered.
Each glossary entry should answer five practical questions:
What does it mean? Write the definition in plain English.
How is it calculated? Include enough logic to reproduce the number.
What does it depend on? Name the source tables, filters, and exclusions.
Who owns it? One person or team approves changes.
How fresh should it be? Set expectation for update cadence and lag.
Good glossary entries prevent fake alignment. Two teams can both agree that "churn" matters while measuring completely different behaviors. The glossary forces the hard part. Picking one definition, recording the trade-off, and using it consistently.
Put definitions where people actually look
A glossary buried in Notion helps the data team. It does not help a founder checking a dashboard five minutes before an investor call.
Definitions need to show up where decisions happen, inside the BI layer, next to the metric, or in the analytics tool people already use. That is how governance speeds the business up instead of slowing it down. Statspresso can support that model by surfacing approved metric definitions when someone asks a question, so users get the answer and the meaning at the same time.
Try asking Statspresso: "Define active customer, net revenue, and pipeline coverage using our approved business glossary."
7. Track lineage so changes don't turn into surprises
Lineage sounds technical, but the idea is simple. If a number changes, can you trace where it came from and what else it affects?
Without lineage, every broken metric becomes a scavenger hunt. The CRM field changed. A dbt model updated. A warehouse table got deprecated. A dashboard still points at the old logic. Nobody notices until leadership asks why revenue changed.
Start with the metrics people trust most
You don't need complete lineage for every table on day one. Begin with the high-stakes stuff. Board metrics. Revenue reporting. Customer growth. Product engagement. Sales pipeline. Anything that feeds major decisions or AI-generated summaries.
Map the flow from source to output:
Origin: Which source system or operational table starts the chain?
Transformations: What models, joins, filters, or calculations alter it?
Consumption points: Which dashboards, exports, or analytics tools depend on it?
Change risk: Who needs a heads-up if the schema or logic changes?
Governance takes on a very practical dimension. A PM doesn't need to love metadata. They just need to know whether renaming a field will inadvertently wreck six downstream reports.
Use impact analysis before changing shared data
The cheapest time to catch a data problem is before the change ships. If you're updating event names, replacing a pipeline, or deprecating a field, run impact analysis first.
That means asking simple questions. What uses this field today? Which teams rely on this metric? Which AI answers or dashboards may change? If the answer is "we're not sure," stop and map it before touching production.
The point of lineage isn't documentation for its own sake. It's fewer nasty surprises on Monday morning.
Try asking Statspresso: "Which source systems and modeled datasets feed our trial-to-paid conversion metric?"
8. Enable self serve analytics with guardrails
Self-serve analytics fails for one of two reasons. Either it's so open that everyone creates their own truth, or it's so restricted that nobody uses it. The sweet spot is governed discovery.
That means people can explore without asking for SQL help every time, but they do it inside boundaries that preserve trust. Access controls run in the background. Certified metrics are easy to find. Sensitive data stays protected. Definitions are visible.
Make the safe path the easy path
Most users won't resist governance if it saves them time. They resist busywork. If the approved metric is buried and the ungoverned CSV is easier to access, guess which one wins.
Good governed self-service usually includes:
Certified starting points: Put trusted datasets and metrics first.
Natural-language access: Let non-technical users ask business questions directly.
Embedded definitions: Show what a metric means at the moment it's used.
Invisible enforcement: Permissions and data rules should work in the background.
That model is a big part of why teams move toward self-serve business intelligence. You don't want every question to become a backlog ticket.
Give people examples, not just permission
Users need a starting script. A blank query box can feel smarter than it is.
For a Conversational AI Data Analyst like Statspresso, practical prompts matter:
Revenue question: "Show monthly net revenue as a line chart."
Marketing question: "Break down qualified leads by channel for the last full quarter."
Product question: "Which features were used most by active accounts this month?"
Customer question: "Compare churned accounts versus retained accounts by plan."
If governance is working, users get fast answers from approved data without needing to understand warehouse internals.
9. Measure governance like an operating system
Governance needs the same discipline as finance, uptime, or customer support. If you cannot measure whether it is working, it turns into a policy archive that nobody trusts and nobody uses.
That matters even more in a startup. Leaders do not fund governance to feel organized. They fund it so teams can answer questions faster, trust shared metrics, and stop burning hours in Slack debates about which number is right.
OneTrust's data governance framework recommends setting clear goals and metrics so teams can monitor progress and improve over time. Varonis outlines data governance KPIs such as stale data removed, folders with assigned owners, and sensitive data creation. Both point to the same operating principle. Measure the work that keeps data usable, safe, and ready for self-serve analysis.
Start with a small scorecard
Skip the giant maturity exercise unless you need it for an audit or board process. Early-stage teams usually need a scoreboard, not a six-month taxonomy project.
A useful governance scorecard fits on one page and answers a simple question: can people get trusted answers without creating new risk?
Track a few indicators that tie directly to daily use:
Ownership coverage: The share of critical datasets with a named owner who responds when something breaks.
Definition coverage: The share of priority metrics with an approved business definition.
Issue resolution time: How long data-quality incidents stay open before someone fixes them.
Access hygiene: Whether outdated permissions, stale files, and abandoned assets are being cleaned up.
Policy adherence: Whether sensitive data is stored, shared, and queried the way your rules say it should be.
Those measures are boring. Good. Boring metrics run companies.
Measure trust, speed, and cleanup
I have seen plenty of teams track policy counts because they are easy to present. That misses the point. Fifty policies do not help a growth lead who needs a reliable pipeline number before the Monday forecast call.
Good governance metrics usually fall into three buckets.
Trust: Do people believe the approved numbers?
Speed: Can they get answers without waiting on the data team?
Cleanup: Are you reducing the mess that creates future errors and access risk?
That framing keeps governance tied to outcomes instead of paperwork. It also makes ROI easier to explain to a founder. Fewer broken dashboards. Faster reporting cycles. Less analyst time spent reconciling exports. More confidence in tools like Statspresso because the underlying data is owned, defined, and monitored.
Improve in short rounds
Treat governance like product ops. Ship a small control set, measure what happened, fix what did not work, and expand from there.
For a startup, that might mean one domain first. Revenue data, customer data, or marketing attribution. Get ownership coverage up. Certify the handful of metrics people use in every planning meeting. Reduce open data issues. Then move to the next domain.
A functioning house beats a blueprint for a mansion.
Try asking Statspresso: "Show stewarded asset coverage, open data issues, and time to resolution by business domain."
10. Treat governance as a people problem first
The hardest part of governance isn't the metadata model. It's getting humans to care before the next fire drill.
Policies fail when they live outside normal work. Teams ignore them, work around them, or treat them as "data team stuff." Then the same trust problems keep showing up under new names.
Tie governance to daily behavior
People adopt governance when it helps them avoid pain. Better campaign reporting. Fewer metric disputes. Less time spent validating dashboards. Faster answers for leadership. Safer client reporting.
The fix is operational, not inspirational:
Train by role: Owners, analysts, PMs, marketers, and executives need different guidance.
Build into tools: Put definitions, ownership, and access controls where people already work.
Celebrate wins: Share examples where governance reduced confusion or sped up a decision.
Keep language simple: "Who owns this?" works better than "Please align with enterprise stewardship protocols."
Leadership has to model it
If executives ignore defined metrics and ask for one-off spreadsheet numbers, everyone else will too. If leaders use approved definitions and ask who owns disputed data, governance becomes normal.
The best programs make trust visible. Teams know which numbers are approved. They know who to ask. They know how issues get resolved. That's culture, even if nobody calls it that.
Governance sticks when people feel its absence immediately. A broken trusted metric gets attention. A forgotten policy document doesn't.
Try asking Statspresso: "Which teams use uncertified metrics most often, and where should we tighten documentation?"
Data Governance for Shopify Stores
Shopify creates governance challenges that generic data governance frameworks don't anticipate. The data model is messier than it looks: a single "customer" can have multiple email addresses, multiple Shopify accounts (guest checkout vs. registered), and purchase history split across your main store and any secondary storefronts. Before you can govern anything, you have to decide what you're governing.
Here are the five governance decisions every Shopify operator needs to make before their data gets complicated:
1. Define what "customer" means in your Shopify data
Shopify creates a customer record when an email address places an order. But a guest checkout and a registered account with the same email are not automatically merged. Your repeat purchase rate, CLV, and retention numbers will be wrong if you're counting email addresses instead of actual people.
The governance decision: choose a canonical customer identifier (email is usually safest), deduplicate on it, and document the rule. Set who owns it — typically the person running Shopify or your growth analytics. Without that decision in writing, every CLV number is a guess.
2. Standardize your order status definitions
Shopify order statuses (pending, authorized, paid, partially_refunded, refunded, voided) don't map directly to business outcomes without interpretation. "Paid" doesn't mean fulfilled. "Refunded" doesn't always mean a return. A partial refund can mean a discount applied after the fact, a damaged item replaced, or a genuine return.
Write one sentence for each order state: what it means for your business, whether it counts toward revenue, and who can change the definition. This is boring work. It prevents four different revenue numbers appearing in the same board meeting.
3. Agree on your attribution window rules
Shopify's Marketing report uses a last-click, 30-day window by default. Your Meta Ads account probably uses a 7-day click / 1-day view window. Your email tool has its own attribution. If you're connecting these sources in any analytics tool, you need one rule — or explicit labeling of which window each number uses — or you'll be triple-counting conversions across channels.
The governance decision: pick one attribution model for business decisions (not reporting to each ad platform), document it, and use it consistently everywhere. Most Shopify businesses use last-click, 14-day for internal reporting. What matters is consistency, not perfection.
4. Catalog your third-party app data
The average Shopify store over $500K in revenue runs 12–20 apps. Each one creates its own data: reviews, loyalty points, subscription billing records, upsell events, post-purchase surveys. Most founders don't know which data lives where and what's actually queryable.
A simple Shopify data catalog lists every app, what data it generates, where that data is (Shopify metafields, the app's own database, or an export), and whether it's being used in any report. This takes one afternoon to build and saves days of confusion later. Connect what you need — Statspresso connects Shopify directly and lets you query orders, customers, products, and refunds in plain English — and document which app data is excluded.
5. Set a definition for "active subscriber" if you run subscriptions
If you sell subscriptions on Shopify (via ReCharge, Shopify Subscriptions, or Bold), "subscriber count" is ambiguous out of the box. Does it include paused subscriptions? Subscriptions that skipped the last charge? Subscriptions pending cancellation? Each platform counts differently.
Pick a definition (typically: active means charged within the last billing cycle, not paused, not pending cancellation) and set it as the agreed-upon rule. One sentence. Named owner. Done.
Data Governance Checklist by Company Stage
Governance needs grow with the company. What matters at $500K ARR is different from what matters at $5M. Here's the right level of governance rigor for each stage:
Stage | Revenue range | Must-do governance | Nice-to-have | Skip for now |
|---|---|---|---|---|
Pre-PMF | $0–$500K ARR | Clean customer email list; define "revenue" (gross or net); name one data owner | Basic glossary (5 terms) | Formal lineage tracking, access roles |
Early traction | $500K–$2M ARR | Standardize 5–8 KPIs; document data sources; assign domain ownership (sales, marketing, product) | Metric definitions in your BI tool; lightweight catalog | Full metadata taxonomy, automated quality checks |
Growth | $2M–$10M ARR | Formal business glossary; ingestion quality checks; role-based data access; lineage for board metrics | Self-serve analytics with guardrails; data contracts between teams | Enterprise-grade DLP, cross-cloud governance tooling |
Scale | $10M+ ARR | Full data catalog; automated quality monitoring; tenant isolation (for B2B SaaS); compliance controls | Governance maturity model; cross-functional data council | Nothing — everything belongs at this stage |
The most common mistake: applying scale-stage governance to an early-traction business. Sixty-page data governance policies and enterprise catalog tools create compliance theater without delivering faster decisions. Start with the decisions in the row that matches your current stage, do them well, and move to the next row when the company size demands it.
10-Point Data Governance Best Practices Comparison
Practice | Implementation complexity | Resource requirements | Expected outcomes | Ideal use cases | Key advantages |
|---|---|---|---|---|---|
Data Catalog and Metadata Management | High initial effort, moderate ongoing | Metadata tools, data engineers, stewards | Faster discovery, lineage visibility, trusted sources | Organizations with many data assets, AI analytics platforms | Improved discoverability, onboarding, compliance |
Data Ownership and Stewardship Model | Medium (policy + org change) | Designated owners/stewards, training, governance time | Clear accountability, faster issue resolution | Self-serve analytics, cross-functional teams | Ownership-driven data quality, faster decisions |
Data Quality Standards and Monitoring | Medium–High (rule definition + tooling) | Monitoring tools, SRE/data engineers, QA workflows | Early detection of issues, reliable analytics | High-stakes reporting, ML training datasets | Prevents bad data, reduces manual validation |
Data Access Control and Privacy Framework | High (granular controls + compliance) | Security tooling, legal/compliance, ops maintenance | Protected data, regulatory compliance, safe sharing | Regulated industries, multi-tenant SaaS, sensitive data | Reduces breach risk, enables compliant sharing |
Data Integration and Source System Management | Medium–High (pipelines & transformations) | ETL/ELT tools, integration engineers, docs | Consistent normalized data, scalable ingestion | Multi-source environments (Shopify, HubSpot, Postgres) | Reliable pipelines, faster time-to-insight |
Metrics Definition and Business Glossary | Medium (consensus + documentation) | SMEs, documentation platform, governance cadence | Consistent KPIs, clearer reporting, aligned language | Organizations needing unified metrics and reporting | Eliminates ambiguity, trusted metrics, consistent reporting |
Data Lineage and Impact Analysis | High (metadata aggregation + visualization) | Lineage tools, metadata sources, engineering effort | Faster root-cause, safer schema changes, impact visibility | Complex pipelines, frequent schema or ETL changes | Traceability, impact forecasting, reduced breakages |
Self-Service Analytics with Governed Discovery | Medium (requires governance foundations) | Analytics platform, curated metrics, user training | Faster answers, wider adoption, lower BI backlog | Product managers, growth teams, non-technical users | Empowers users, increases decision velocity, preserves guardrails |
Data Governance Maturity Model and Continuous Improvement | Low–Medium (framework + assessments) | Stakeholder time, assessment tools, roadmap planning | Prioritized improvements, measurable progress over time | Organizations plann... |