Master Analytics for Startups with AI in 2026

Waiting weeks for a data analyst to build a dashboard is a relic of the past. Yet plenty of startups still run on that model. A founder asks why activation dipped, a PM wants retention by signup cohort, marketing needs channel performance, and the answer sits behind a queue, a spreadsheet, or one overworked SQL person.
That setup breaks because startup speed and traditional BI speed don't match. You don't need more dashboards. You need faster access to trustworthy answers. That’s where a Conversational AI Data Analyst changes the game. Instead of filing a ticket, you ask a question and get a chart. Skip the SQL. Just ask your data a question and get a chart in seconds.
Introduction The End of the Analytics Waiting Game
Most analytics advice still assumes you have time to design a stack before you need answers. Startups don't. You need to know what users did, why revenue moved, and where a funnel leaks before the next standup, not after the next sprint.
The old model also assumes access should be gated through tools that most of the company won't touch. That worked when reporting was a back-office function. It doesn't work when product, growth, sales, and ops all need answers in the same day.
Practical rule: If a question matters enough to influence a roadmap, pricing call, or campaign decision, the team asking it should be able to answer it without waiting in line.
A modern analytics for startups playbook starts with a simpler idea. Make answers accessible first, then make the stack elegant second. That’s why conversational analytics has become so useful for early and growth-stage teams alike. If your data lives in Postgres, HubSpot, Shopify, or a CRM, the fastest path isn't another dashboard backlog. It's a way to ask plain-English questions directly against those systems and move.
Analytics Before Product-Market Fit Why Most Startups Track the Wrong Things
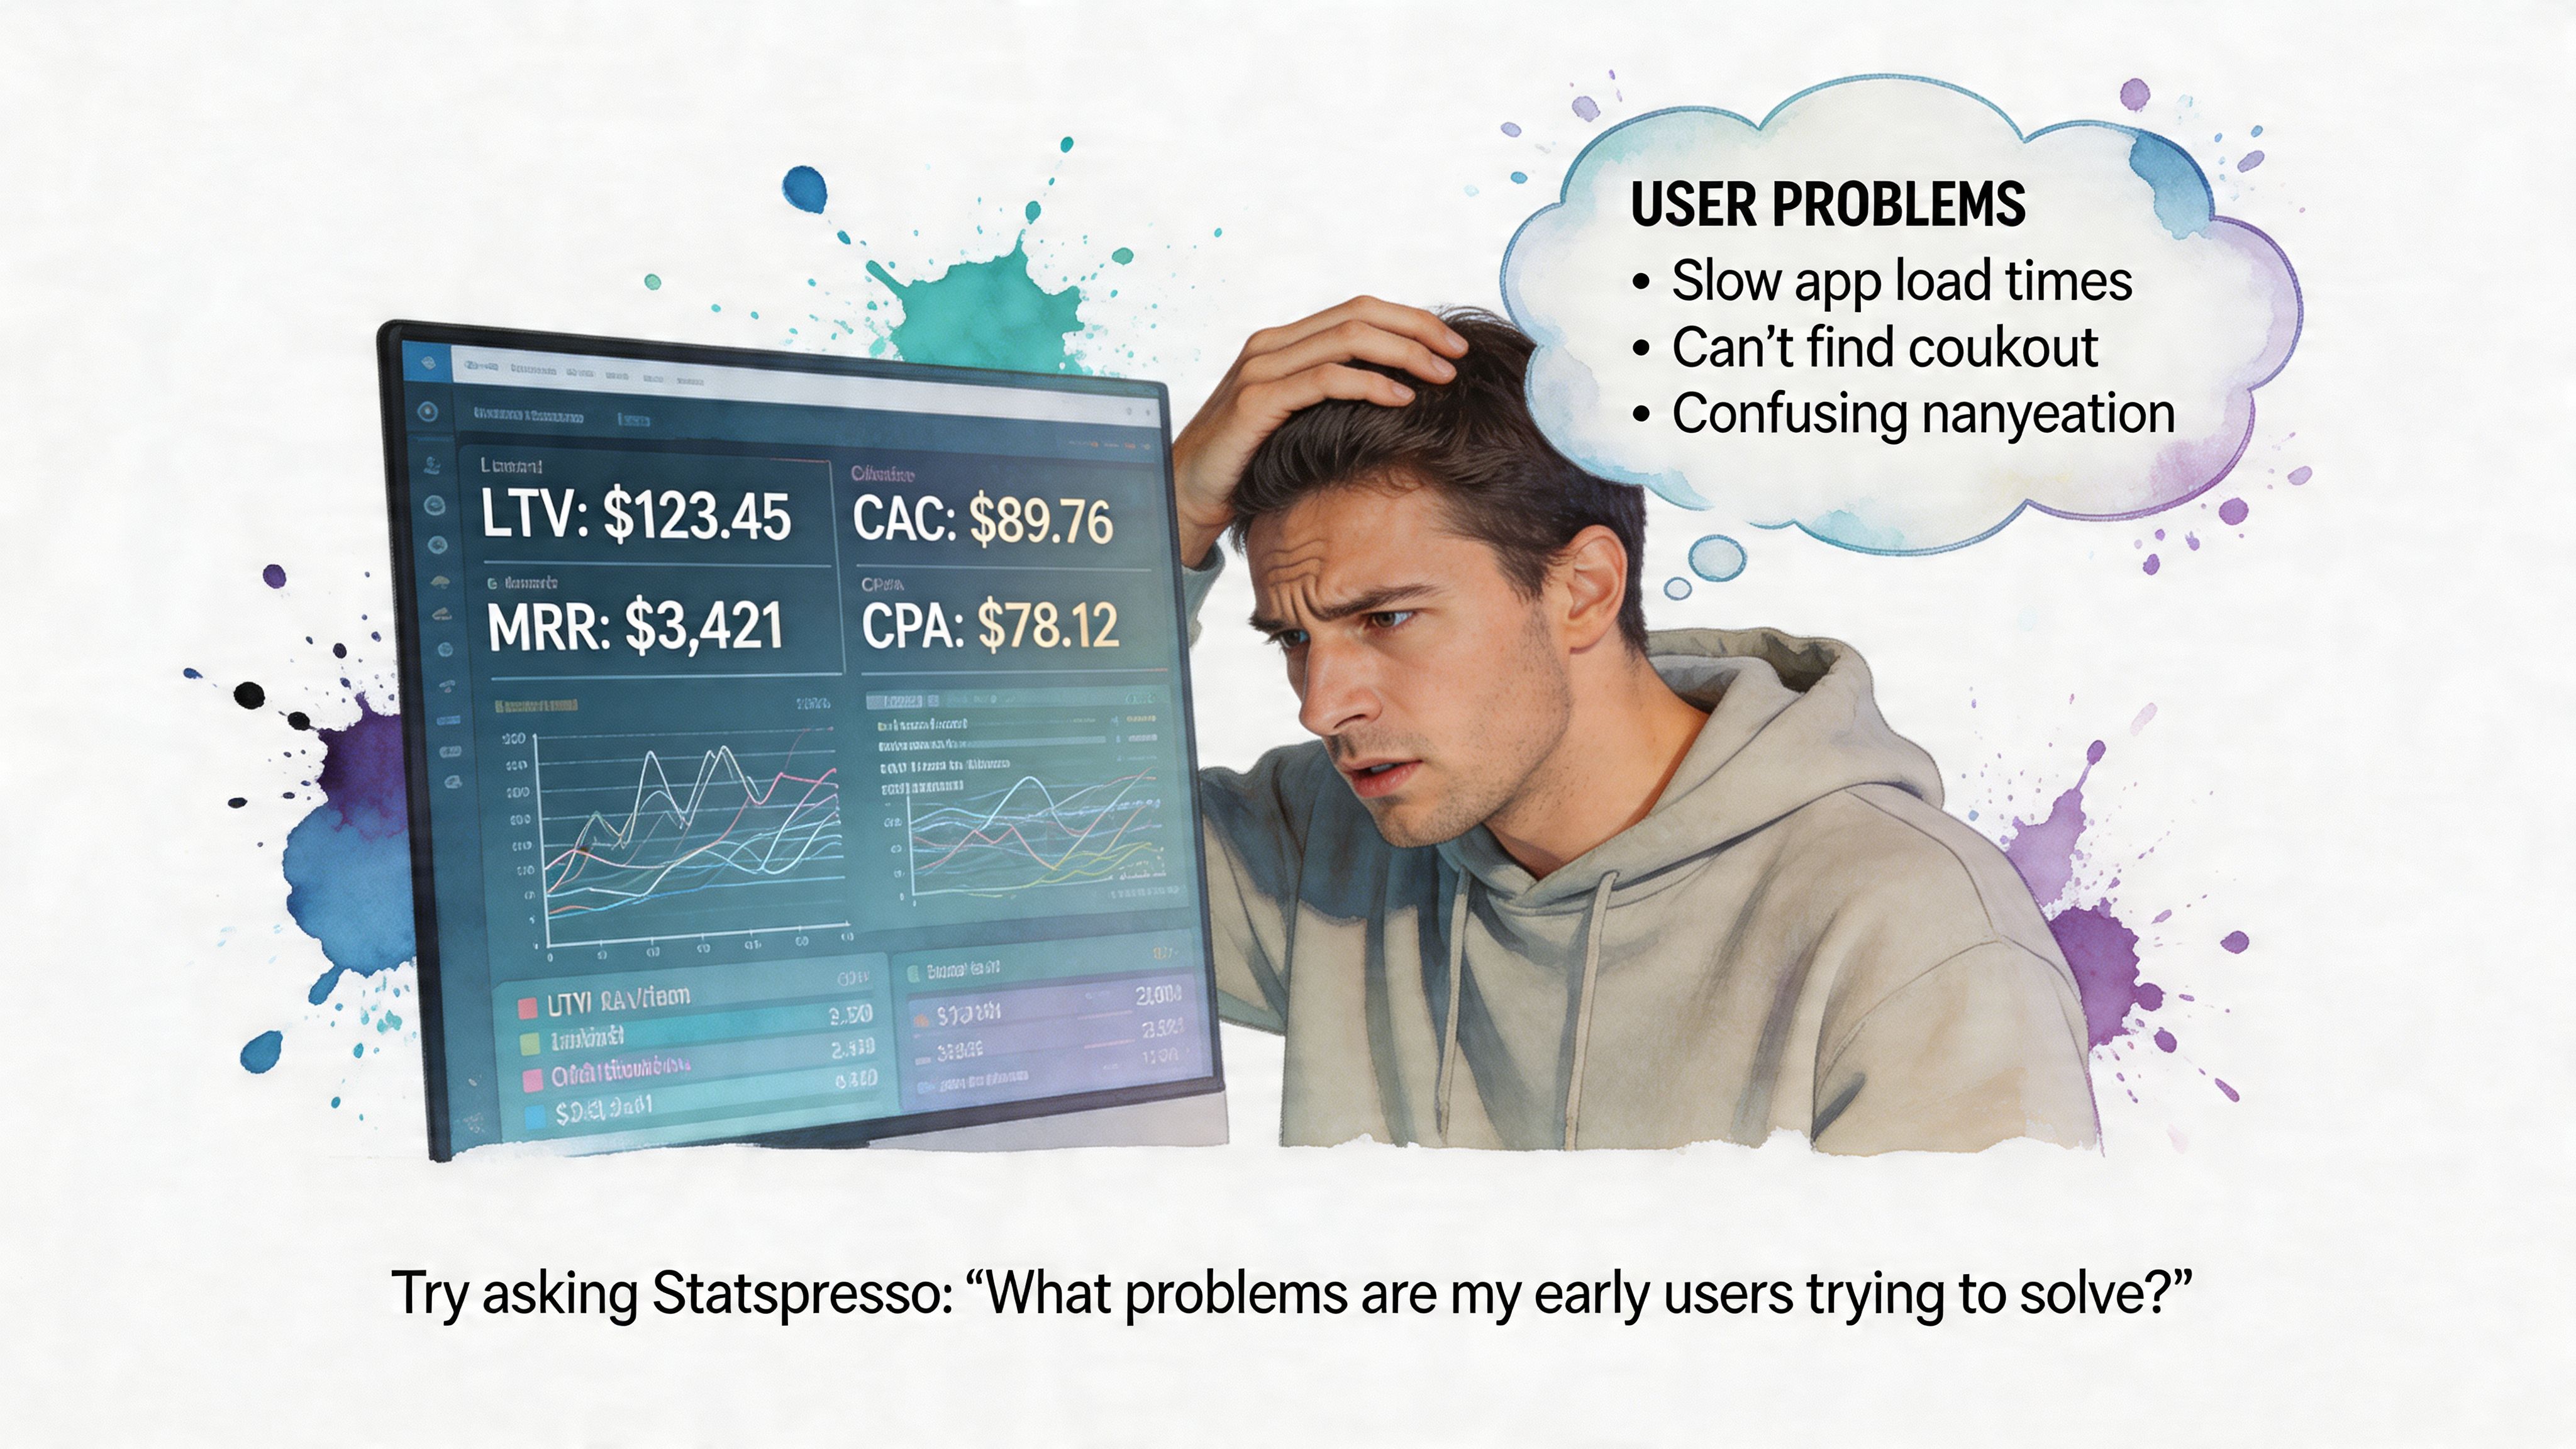
Most early teams copy advice meant for later-stage SaaS companies. They start asking about lifetime value, multi-touch attribution, and perfect dashboards before they've confirmed whether users care enough to come back. That's backwards.
Existing resources overwhelmingly focus on post-PMF growth metrics, leaving early founders without guidance on minimal viable tracking. There’s also a clear gap in advice for what to track with fewer than 100 users, even though 61% of data teams now opt for integrated platforms to avoid early data debt and failures, according to Definite’s stage-by-stage framework for startup data analysis.
What pre-PMF teams should care about
Before product-market fit, analytics has one job. Help you decide whether users are getting value. You are not optimizing a machine. You are checking whether a machine exists.
That means your tracking plan should be small and sharp:
Activation behavior: Define the one action that signals a user reached first value.
Short-loop retention: Look for signs users return soon after first use.
Onboarding completion: Find where new users get stuck.
Qualitative context: Pair product behavior with support notes, survey responses, and founder calls.
A lot of teams sabotage themselves here by instrumenting too much. You do not need a grand event taxonomy on day one. You need a handful of events that line up with the product promise.
Track the moment a user gets value, not every click that happened on the way there.
Minimum viable tracking beats fake sophistication
A good pre-PMF setup often looks a little scrappy. That's fine. Your prototype might live in Postgres. Feedback might arrive through Typeform. CRM notes might sit in HubSpot. Those aren't problems unless nobody can query them together.
Conversational analytics demonstrates its worth. Instead of exporting CSVs and wrestling with joins late at night, you ask the question you care about.
Try asking Statspresso: "How many users who signed up last week completed the onboarding checklist?"
That style of question is better than building a dashboard first because it forces clarity. If your team can’t state the question plainly, the issue usually isn't tooling. It's that the metric isn't defined well enough yet.
What founders often miss
Pre-PMF data is thin. Averages lie. Pretty charts can flatter bad products. The right move is to combine small-sample behavioral signals with direct customer context.
That also means your analytics should support competitive learning, not just internal reporting. If you’re still shaping your positioning, these examples of market research for competitive intelligence are useful because they show how founders can turn customer and market signals into sharper strategic questions.
A practical early rhythm looks like this:
Review activation every week: Did new users reach first value?
Look for return behavior: Are any user groups naturally coming back?
Match data with calls: Did the people who retained describe the same value clearly?
Tighten instrumentation only after patterns emerge: Don’t polish noise.
If you're pre-PMF, the hardest part isn't collecting more data. It's resisting the urge to hide uncertainty behind more tooling.
The Startup Analytics Playbook Metrics That Matter by Stage
A seed-stage founder asks for an LTV dashboard. What they usually need is a clean answer to a simpler question: are users getting value, coming back, and doing so in a way the business can repeat? Stage is what decides the metric set.
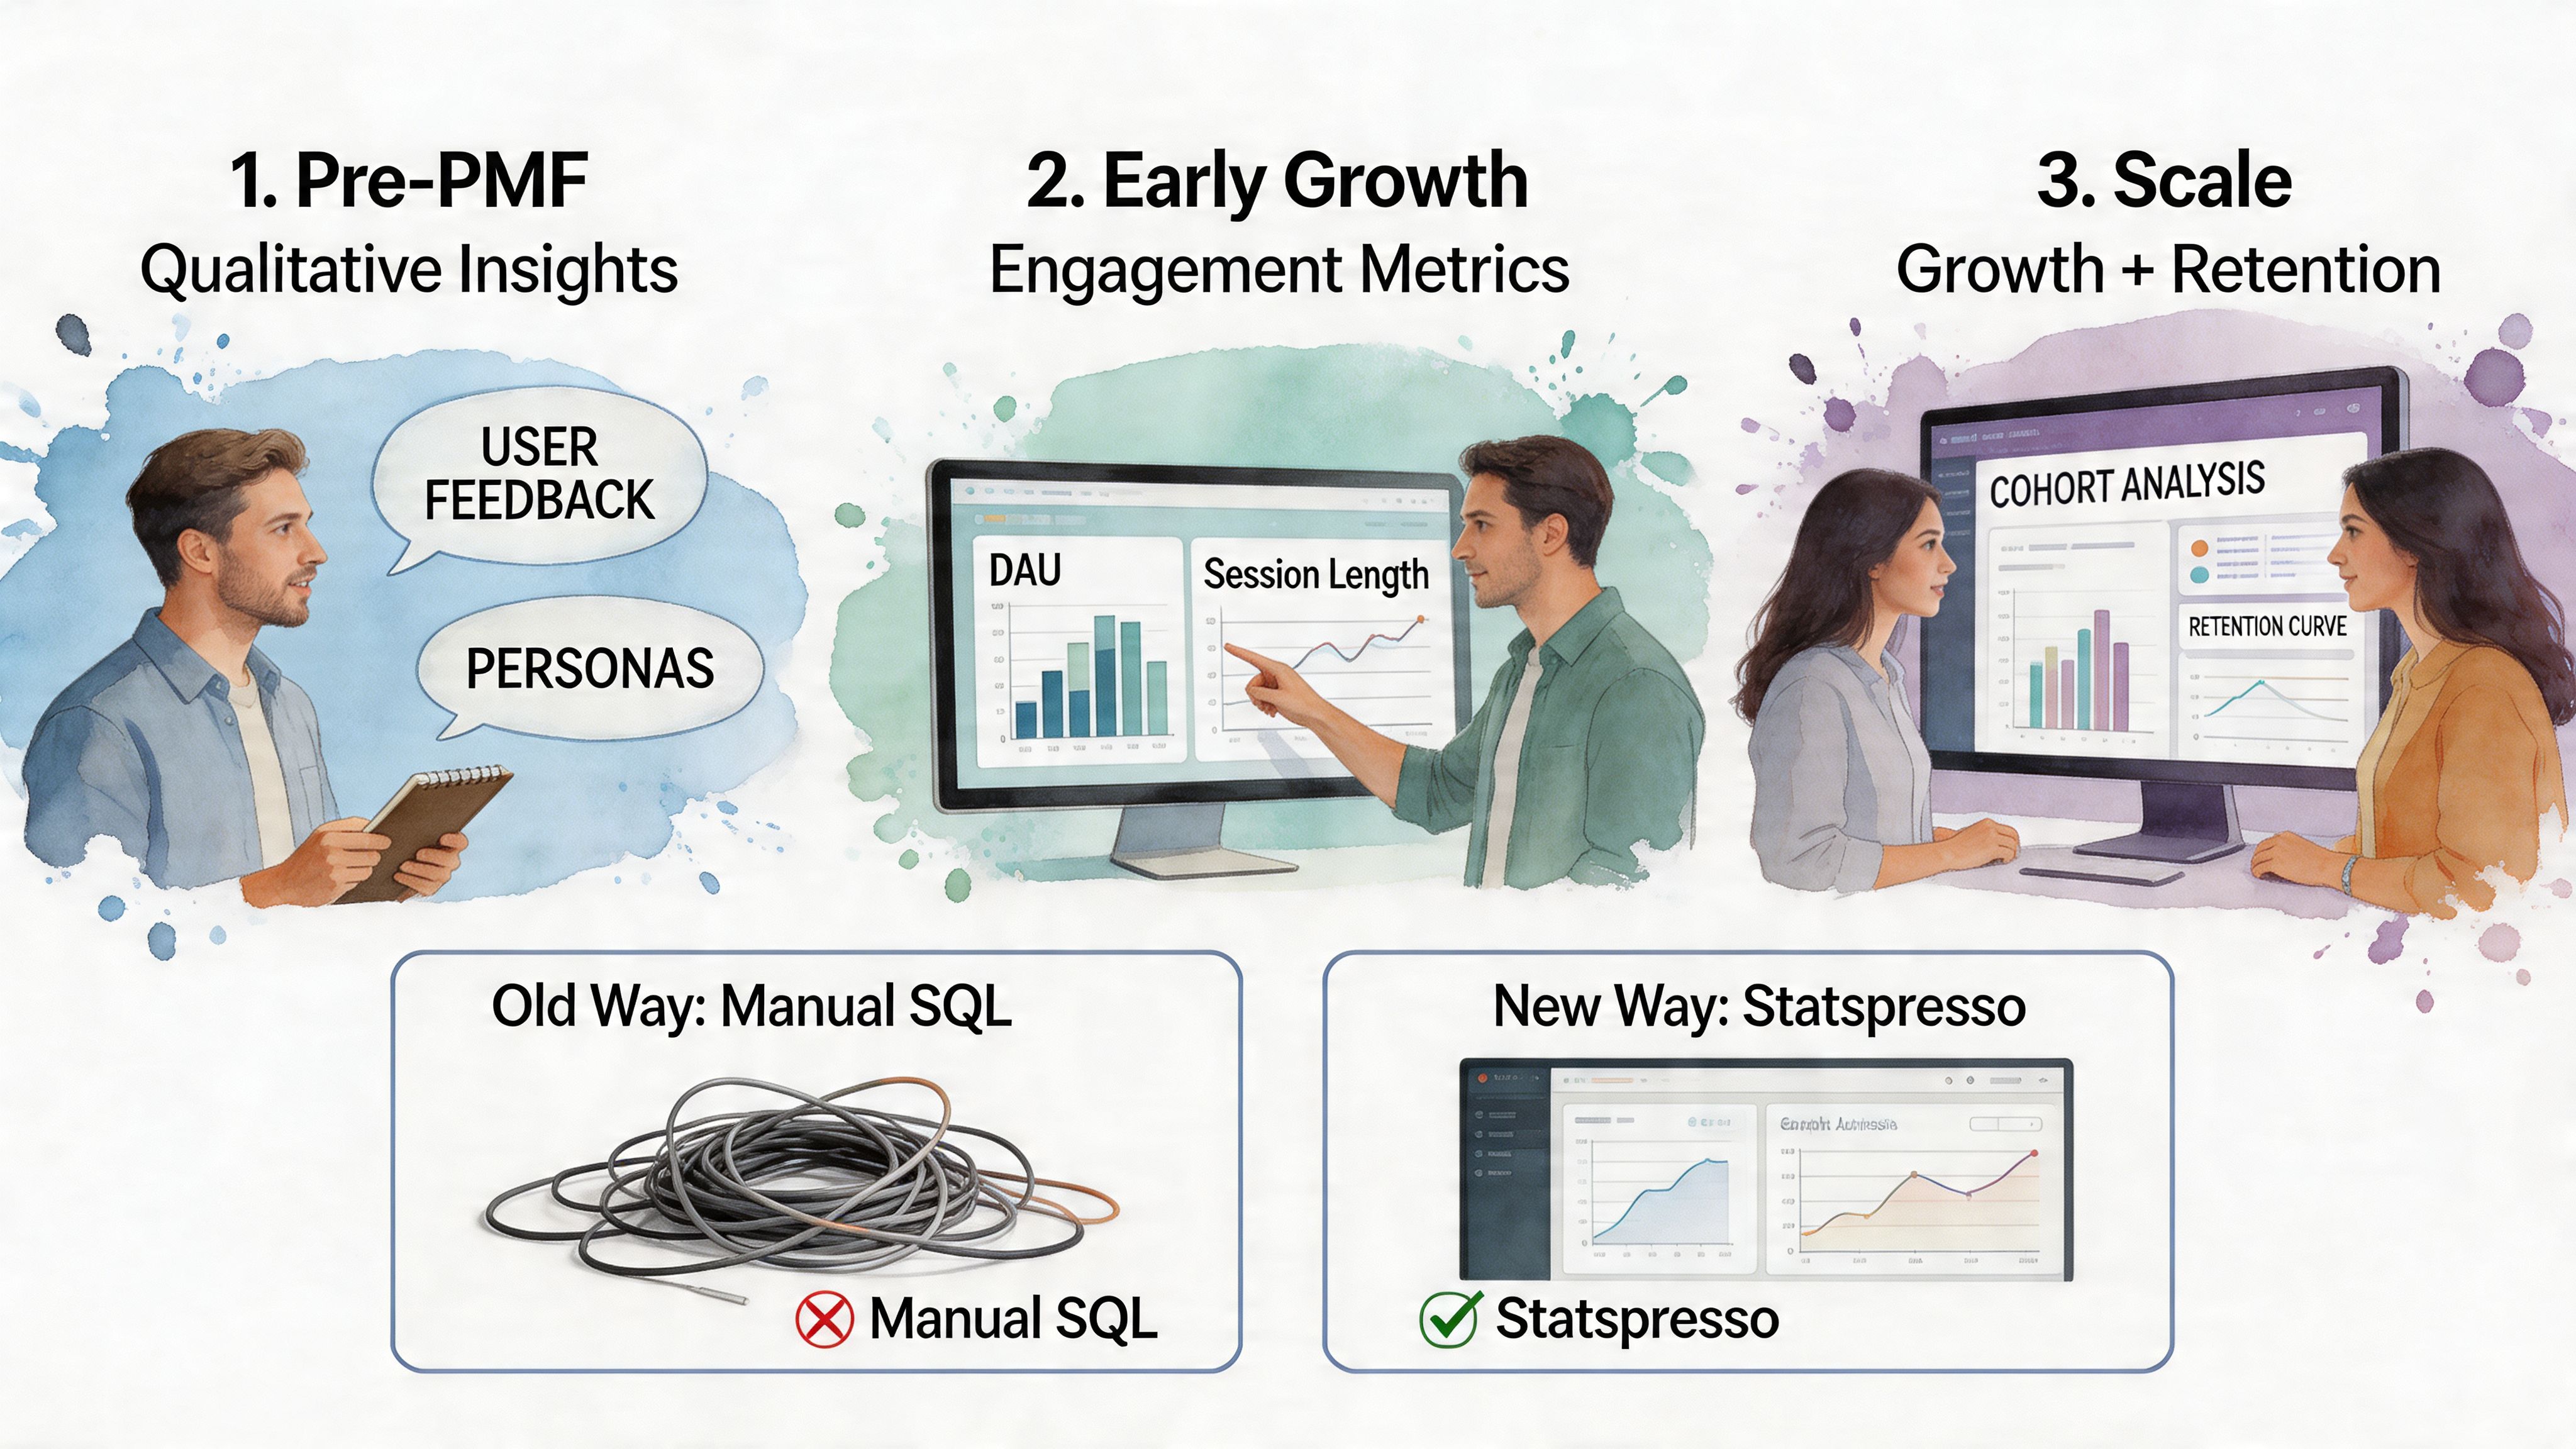
Pre-PMF signals
Before product-market fit, the job of analytics is validation, not reporting. Founders need to know whether a user reached first value quickly enough to justify another session, another trial day, or another sales conversation.
The useful metrics are usually:
Activation: Did users complete the action that proves the product solved something real?
Early retention: Did they come back after the first meaningful use?
Engagement depth: Are they using the product with intent, or just clicking around?
Time to value: How long did it take to reach the first useful outcome?
The trade-off is simple. If you track too much here, weak products can hide behind busy-looking charts. If you track too little, you miss the specific moment users stall.
A conversational workflow helps because it starts with the decision, not the dashboard build. Try asking Statspresso: "Which signup sources produced users who reached activation within seven days?" That gets you to a usable answer faster than opening a BI tool, finding the right model, and rebuilding a funnel every time the team changes its mind about the activation step.
Post-PMF economics
Once users return with some consistency, the center of gravity shifts from validation to efficiency. Growth has to be repeatable, and the team needs shared definitions for the few numbers that drive planning.
Focus on:
Activation rate
D1, D7, and D30 retention
CAC payback period
Expansion or repeat revenue, if the model supports it
These metrics are only useful if product, growth, and finance define them the same way. Inconsistent definitions create operating problems, not just analytics problems.
I see this constantly. Growth reports activation from a marketing event. Product reports activation from an in-app milestone. Finance uses a third cutoff tied to billing. The result is predictable: every planning meeting turns into a metric argument instead of a decision.
A startup can survive imperfect data longer than it can survive disputed definitions.
If repeatable demand is starting to show up, these strategies for SaaS growth add useful context because they treat growth as an operating system, not a dashboard collection.
Statspresso is particularly useful at this stage because the team can ask the same question in plain English and inspect the answer together. "Show activation, D7 retention, and CAC payback by acquisition channel for the last two quarters" is a better operating habit than waiting three days for an ad hoc report that only one analyst understands.
Scaling without metric chaos
As the company grows, the hard part changes again. You no longer need one metric. You need a model that connects product usage, revenue, acquisition cost, and account context without creating five versions of the truth.
That usually means adding:
Cohort analysis: Are newer users retaining better than earlier cohorts?
Segmentation: Which channels, plans, or personas create healthier accounts?
Attribution: Which acquisition costs line up with stronger lifetime value?
Customer-level rollups: Can sales, product, and finance evaluate the same account from different angles?
The old BI process starts to drag. Every new slice of the business needs another dashboard, another filtered view, another round of SQL cleanup. A conversational layer changes the pace. Instead of filing a ticket for a cohort grid, a founder can ask Statspresso: "Show D1, D7, and D30 retention for May signups as a cohort table, split by plan type."
The principle stays the same at every stage. Pick the few metrics that match the company’s current bottleneck, define them tightly, and make them easy to question. Startups move too fast to treat analytics like a monthly publishing exercise.
Your Implementation Roadmap Quick Wins vs Scalable Stack
Monday morning, the founder wants to know why trial-to-paid conversion slipped. Marketing blames lead quality. Product suspects onboarding. The analyst is in meetings, the dashboard is stale, and three teams are arguing from screenshots.
That is a tooling problem, not just a reporting problem.
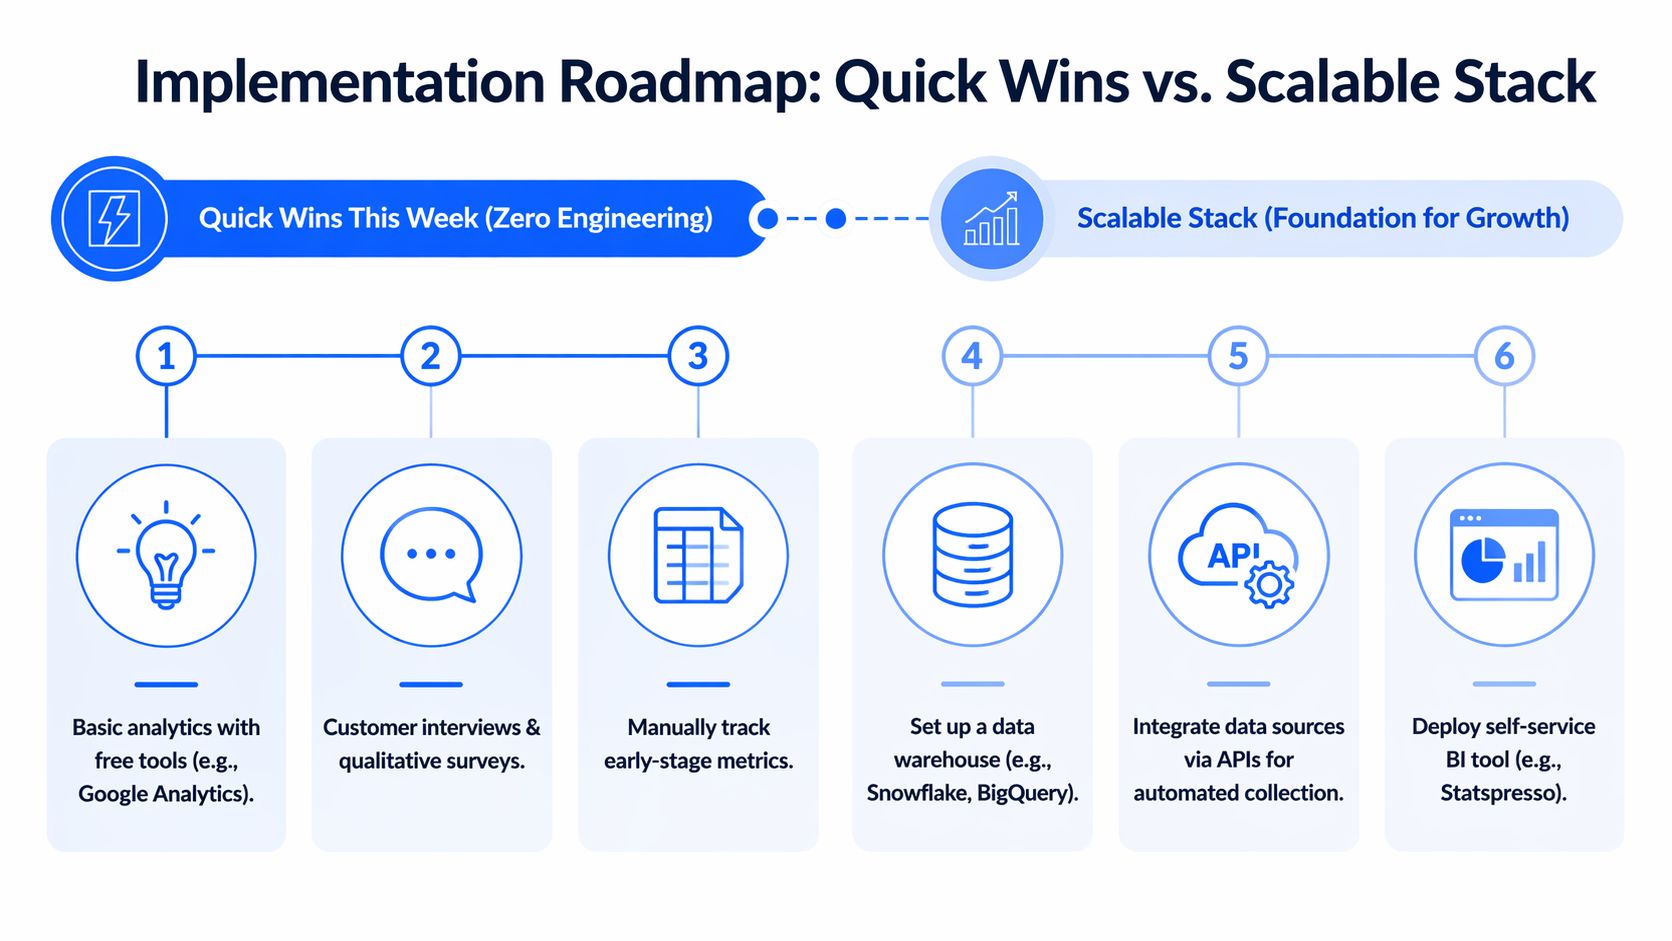
Quick wins this week
Start with the systems already holding business-critical data. For early-stage teams, that usually means Postgres, Shopify, HubSpot, Stripe, support tools, and one product event source.
The first goal is simple. Get answers your team can act on this week.
A practical week-one checklist:
Connect core sources: Start with the database and one or two operational systems your team already trusts.
Ask business questions, not schema questions: Query “Which leads converted after the demo?” instead of hunting for table names.
Create a tiny metric set: Revenue, activation, onboarding completion, and one retention view are enough to begin.
Share answers where decisions happen: Put charts into Slack threads, docs, and meeting notes.
A conversational layer helps non-technical teams stop waiting on ad hoc reporting. Tools in the market approach this from different angles, and some analytics solutions specifically for startups are built for speed and lightweight implementation instead of a heavy BI rollout.
The advantage is not magic. It is cycle time. Asking Statspresso a plain-English question shortens the path from debate to evidence, especially before the company has a full data team or polished reporting stack.
Build the foundation when the questions repeat
Once the same questions come up every week, manual querying gets expensive. That is the point to centralize data and clean up definitions.
For startups, a sensible pattern is to load raw data from tools like Shopify, HubSpot, and Postgres into one repository first, then model it with dbt. That gives the team a shared base without forcing every business rule to be finalized on day one.
That setup works for a few practical reasons:
Load first: Keep raw data intact so you can revisit assumptions later.
Transform after: Define business logic in modular SQL models.
Test definitions: Use lineage and checks to catch drift.
Publish once: Feed dashboards and self-serve analysis from governed models.
ELT works like bringing every book into the same library before you catalog the shelves. ETL tries to reorganize each book before it even gets through the door. For a startup with changing questions, the first approach usually wastes less time.
The trade-off is real. A quick conversational setup gets answers fast, but it will not replace data modeling once finance, product, and growth all need the same metric definitions. The right roadmap uses both. Start with fast access to answers, then add structure when repeated questions justify the effort.
The old way versus the new way of getting answers
Task | The Old Way (Manual BI) | The New Way (Statspresso) |
|---|---|---|
Check revenue trends | Ask an analyst to write SQL and update a dashboard | Ask a plain-English question and get a chart |
Compare channels | Export CSVs from multiple tools and merge manually | Query connected sources in one interface |
Investigate funnel drop-off | Wait for a custom report | Ask follow-up questions in the same thread |
Share findings with the team | Paste screenshots into docs | Share live answers and charts |
Handle ad hoc leadership questions | Interrupt the data person | Let teams self-serve against trusted data |
One practical option in this category is Statspresso, a conversational AI data analyst that connects sources like Shopify, HubSpot, Linear, and Postgres so teams can ask plain-English questions and get charts without writing SQL.
What to avoid
Three implementation mistakes show up constantly:
Overbuilding too early: A stack designed for a later-stage company will drain the team you have now.
Keeping logic in too many places: If a metric lives in spreadsheets, dashboards, and one analyst’s head, it will drift.
Confusing dashboards with adoption: A wall of charts does not mean the team can answer questions quickly.
Buy speed first. Add complexity when repeated decisions depend on it.
Beyond Dashboards Embedding Insights into Your Workflow
Dashboards are fine. Passive dashboards are not. If the only time your team looks at metrics is during a Monday review, analytics is functioning as decoration.
Put answers where work already happens
Useful analytics should show up inside the tools your team already uses to make decisions.
That usually means:
Slack alerts for anomalies: Flag unusual changes in signups, usage, or revenue.
Meeting-time queries: Ask a live question when a product or growth debate appears.
Shared charts in context: Drop a visual into a planning doc or sprint thread, not a separate reporting portal.
Follow-up analysis on demand: Let a PM or marketer ask the second question immediately.
This shift matters because a dashboard answers the question someone predicted in advance. A conversational workflow answers the question that came up five minutes ago.
If you’re thinking about what that looks like in product or client-facing contexts, embedded analytics explained in this guide is a useful reference for turning reporting into part of the workflow itself.
Predictive analytics is finally practical
Forecasting used to sound like a luxury item for teams with a data scientist and a lot of patience. It’s now much more accessible when your startup already has unified historical data.
According to AWS’s guide to how startup companies scale with data analytics, predictive analytics services can forecast customer metrics like churn with 85 to 95% accuracy, and conversational tools can query those forecasts directly. The same source notes that interventions aimed at at-risk users have been shown to recover 12 to 18% of potential churn.
That matters because predictive analytics changes the timing of the conversation. Instead of asking why churn rose last month, the team can ask who looks risky now and what intervention is worth trying.
Try asking Statspresso: "Forecast Q3 churn and show the segments with the highest risk."
Dashboards report. Workflows respond.
A startup gets real value from analytics when it changes daily behavior.
Examples:
Product teams use activation and retention signals during prioritization.
Growth teams compare channels based on quality, not just volume.
Customer teams surface accounts that look wobbly before renewal becomes a fire drill.
Leaders stop asking for “the dashboard” and start asking sharper operational questions.
That’s the quiet advantage of conversational analytics and automated BI. It lowers the cost of curiosity. People ask more questions because they know they’ll get answers fast.
Data Governance That Isnt a Four-Letter Word
Governance sounds like something a startup promises to handle after the next fundraise. That’s a mistake. If your team can’t agree on what a metric means, speed just helps you spread confusion faster.
Metric chaos usually starts innocently. Product defines “active user” one way. Marketing uses another filter. Finance reports revenue on a different basis. Everybody is sincere. Everybody is wrong for someone else’s purpose.
Trust is a speed feature
Good governance means a few simple things:
One definition per key metric: Revenue, activation, retention, and active users should have a home.
Visible calculation logic: Teams should know how a number was produced.
Controlled access: People can explore data without exposing what they shouldn’t see.
Reliable refresh habits: Stale data erodes trust faster than messy design ever will.
This is why central modeling matters. When metrics live in version-controlled definitions instead of scattered reports, the business spends less time debating arithmetic and more time deciding what to do.
Governance is not bureaucracy. It is the reason a company can answer the same question twice and get the same answer.
Privacy matters early in regulated markets
This becomes even more important in healthtech, fintech, and other regulated niches. Privacy-compliant analytics is still under-addressed in most startup advice, even though it’s not optional for these teams.
For startups in regulated markets, MIT Sloan’s discussion of analytics as a startup advantage notes that data privacy fines exceed $2B+ yearly in markets like the US and EU. The same source highlights the value of tools that support compliant, no-SQL querying of sources like HubSpot or HIPAA-compliant databases.
The practical takeaway is simple. If people need self-serve analytics, give them access to answers, not to raw sensitive records. The right setup lets a growth lead ask for lead-to-demo conversion trends without exposing personal data they never needed to see.
What good governance looks like in a startup
It doesn't need a committee and a forty-page policy.
It usually starts with:
A short metric glossary
A central modeled layer
Permissioning by role
A habit of fixing broken definitions immediately
That’s enough to stop most startup reporting drama before it becomes cultural debt.
Your Next Step From Reading to Asking
If analytics for startups feels messy, it’s usually because teams try to solve for sophistication before they solve for access. The right move is simpler. Track the signals that match your stage. Keep definitions tight. Make answers easy to get.
TLDR
Pre-PMF teams should track validation signals: Focus on activation, onboarding completion, and early retention, not a giant KPI catalog.
Post-PMF teams need cleaner economics: Unit metrics and cohort analysis matter once repeatable growth appears.
ELT is the scalable path: Load raw data first, then transform centrally so definitions stay consistent.
Dashboards alone are not enough: Analytics becomes useful when insights show up in workflows, meetings, and team decisions.
Governance is practical, not ceremonial: Shared definitions and permissioning prevent metric chaos.
Conversational analytics removes the queue: Skip the SQL. Ask a question, get an answer, keep moving.
A few common questions usually come next.
Do I need a warehouse right now? Not always. If your questions are still basic and your sources are limited, start with direct access and a small metric set.
When should I tighten the stack? When the same questions repeat and ad hoc reporting starts wasting time.
What should your team do today? Connect the source that already holds your most important business data, ask one real question, and see where the gaps are.
Frequently Asked Questions About Startup Analytics
What should a startup track first
Start with the smallest set of metrics that tells you whether the product is working for your current stage.
For very early teams, that usually means activation, onboarding completion, and short-loop retention. After product-market fit, you add unit economics, cohorts, and channel quality. If you can’t act on a metric this month, it probably doesn’t belong in the first dashboard.
Do I need to hire a data analyst early
Not always. What you need first is the ability to answer recurring business questions without slowing the team down.
A dedicated analyst becomes more useful when questions are frequent, cross-functional, and expensive to answer manually. Before that point, a strong product or ops lead with a lightweight analytics setup can cover a lot of ground. The trap is hiring a reporting bottleneck instead of building self-serve access.
What if my data is spread across multiple tools
That’s normal. Most startups have customer data in a database, lead data in a CRM, billing data in a payment system, and product signals in an event tool.
The immediate fix is not “rip everything out.” It’s to create a query layer or central flow that lets those systems be analyzed together. Over time, repeated cross-source questions justify a more structured ELT setup.
Are dashboards still useful
Yes, but only for stable questions. Dashboards work best when a team wants to monitor a known metric repeatedly.
They work poorly for exploratory analysis, meeting-time follow-ups, and all the weird one-off questions that drive startup decisions. That’s why conversational analytics and automated BI are such a good fit for fast-moving teams. They complement dashboards instead of replacing every reporting surface.
How much should a startup spend on analytics
Spend according to the cost of unanswered questions, not according to what enterprise BI vendors would love to sell you.
Early teams can do a lot with lightweight tooling and a disciplined metric set. As the business grows, the spend should map to clear pain points: repeated manual work, disputed KPIs, poor visibility across tools, or slow decision cycles. If your stack is expensive but your team still can’t answer simple questions quickly, you bought complexity, not analytics.
How do I keep metrics trustworthy as the company grows
Define your key business metrics once, keep them in a central model, and make the calculation logic visible. Then stop letting every team invent local versions in spreadsheets.
If a metric changes, update the source definition and communicate it clearly. The goal isn’t rigid perfection. It’s that sales, product, finance, and leadership can look at the same number without starting a debate.
Can non-technical teams really self-serve analytics
Yes, if the interface matches how they think. Most non-technical users don’t struggle because analytics is impossible. They struggle because the tools expect them to think in tables, joins, and chart builders.
When you let people ask business questions in plain English, adoption gets much easier. The key condition is that those answers are grounded in trusted data and shared definitions.
Stop waiting for answers. Statspresso is a conversational AI data analyst that lets teams connect their data, ask plain-English questions, and get charts in seconds. Connect your first data source for free and ask your first question in the next five minutes.
Waiting weeks for a data analyst to build a dashboard is a relic of the past. Yet plenty of startups still run on that model. A founder asks why activation dipped, a PM wants retention by signup cohort, marketing needs channel performance, and the answer sits behind a queue, a spreadsheet, or one overworked SQL person.
That setup breaks because startup speed and traditional BI speed don't match. You don't need more dashboards. You need faster access to trustworthy answers. That’s where a Conversational AI Data Analyst changes the game. Instead of filing a ticket, you ask a question and get a chart. Skip the SQL. Just ask your data a question and get a chart in seconds.
Introduction The End of the Analytics Waiting Game
Most analytics advice still assumes you have time to design a stack before you need answers. Startups don't. You need to know what users did, why revenue moved, and where a funnel leaks before the next standup, not after the next sprint.
The old model also assumes access should be gated through tools that most of the company won't touch. That worked when reporting was a back-office function. It doesn't work when product, growth, sales, and ops all need answers in the same day.
Practical rule: If a question matters enough to influence a roadmap, pricing call, or campaign decision, the team asking it should be able to answer it without waiting in line.
A modern analytics for startups playbook starts with a simpler idea. Make answers accessible first, then make the stack elegant second. That’s why conversational analytics has become so useful for early and growth-stage teams alike. If your data lives in Postgres, HubSpot, Shopify, or a CRM, the fastest path isn't another dashboard backlog. It's a way to ask plain-English questions directly against those systems and move.
Analytics Before Product-Market Fit Why Most Startups Track the Wrong Things
Most early teams copy advice meant for later-stage SaaS companies. They start asking about lifetime value, multi-touch attribution, and perfect dashboards before they've confirmed whether users care enough to come back. That's backwards.
Existing resources overwhelmingly focus on post-PMF growth metrics, leaving early founders without guidance on minimal viable tracking. There’s also a clear gap in advice for what to track with fewer than 100 users, even though 61% of data teams now opt for integrated platforms to avoid early data debt and failures, according to Definite’s stage-by-stage framework for startup data analysis.
What pre-PMF teams should care about
Before product-market fit, analytics has one job. Help you decide whether users are getting value. You are not optimizing a machine. You are checking whether a machine exists.
That means your tracking plan should be small and sharp:
Activation behavior: Define the one action that signals a user reached first value.
Short-loop retention: Look for signs users return soon after first use.
Onboarding completion: Find where new users get stuck.
Qualitative context: Pair product behavior with support notes, survey responses, and founder calls.
A lot of teams sabotage themselves here by instrumenting too much. You do not need a grand event taxonomy on day one. You need a handful of events that line up with the product promise.
Track the moment a user gets value, not every click that happened on the way there.
Minimum viable tracking beats fake sophistication
A good pre-PMF setup often looks a little scrappy. That's fine. Your prototype might live in Postgres. Feedback might arrive through Typeform. CRM notes might sit in HubSpot. Those aren't problems unless nobody can query them together.
Conversational analytics demonstrates its worth. Instead of exporting CSVs and wrestling with joins late at night, you ask the question you care about.
Try asking Statspresso: "How many users who signed up last week completed the onboarding checklist?"
That style of question is better than building a dashboard first because it forces clarity. If your team can’t state the question plainly, the issue usually isn't tooling. It's that the metric isn't defined well enough yet.
What founders often miss
Pre-PMF data is thin. Averages lie. Pretty charts can flatter bad products. The right move is to combine small-sample behavioral signals with direct customer context.
That also means your analytics should support competitive learning, not just internal reporting. If you’re still shaping your positioning, these examples of market research for competitive intelligence are useful because they show how founders can turn customer and market signals into sharper strategic questions.
A practical early rhythm looks like this:
Review activation every week: Did new users reach first value?
Look for return behavior: Are any user groups naturally coming back?
Match data with calls: Did the people who retained describe the same value clearly?
Tighten instrumentation only after patterns emerge: Don’t polish noise.
If you're pre-PMF, the hardest part isn't collecting more data. It's resisting the urge to hide uncertainty behind more tooling.
The Startup Analytics Playbook Metrics That Matter by Stage
A seed-stage founder asks for an LTV dashboard. What they usually need is a clean answer to a simpler question: are users getting value, coming back, and doing so in a way the business can repeat? Stage is what decides the metric set.
Pre-PMF signals
Before product-market fit, the job of analytics is validation, not reporting. Founders need to know whether a user reached first value quickly enough to justify another session, another trial day, or another sales conversation.
The useful metrics are usually:
Activation: Did users complete the action that proves the product solved something real?
Early retention: Did they come back after the first meaningful use?
Engagement depth: Are they using the product with intent, or just clicking around?
Time to value: How long did it take to reach the first useful outcome?
The trade-off is simple. If you track too much here, weak products can hide behind busy-looking charts. If you track too little, you miss the specific moment users stall.
A conversational workflow helps because it starts with the decision, not the dashboard build. Try asking Statspresso: "Which signup sources produced users who reached activation within seven days?" That gets you to a usable answer faster than opening a BI tool, finding the right model, and rebuilding a funnel every time the team changes its mind about the activation step.
Post-PMF economics
Once users return with some consistency, the center of gravity shifts from validation to efficiency. Growth has to be repeatable, and the team needs shared definitions for the few numbers that drive planning.
Focus on:
Activation rate
D1, D7, and D30 retention
CAC payback period
Expansion or repeat revenue, if the model supports it
These metrics are only useful if product, growth, and finance define them the same way. Inconsistent definitions create operating problems, not just analytics problems.
I see this constantly. Growth reports activation from a marketing event. Product reports activation from an in-app milestone. Finance uses a third cutoff tied to billing. The result is predictable: every planning meeting turns into a metric argument instead of a decision.
A startup can survive imperfect data longer than it can survive disputed definitions.
If repeatable demand is starting to show up, these strategies for SaaS growth add useful context because they treat growth as an operating system, not a dashboard collection.
Statspresso is particularly useful at this stage because the team can ask the same question in plain English and inspect the answer together. "Show activation, D7 retention, and CAC payback by acquisition channel for the last two quarters" is a better operating habit than waiting three days for an ad hoc report that only one analyst understands.
Scaling without metric chaos
As the company grows, the hard part changes again. You no longer need one metric. You need a model that connects product usage, revenue, acquisition cost, and account context without creating five versions of the truth.
That usually means adding:
Cohort analysis: Are newer users retaining better than earlier cohorts?
Segmentation: Which channels, plans, or personas create healthier accounts?
Attribution: Which acquisition costs line up with stronger lifetime value?
Customer-level rollups: Can sales, product, and finance evaluate the same account from different angles?
The old BI process starts to drag. Every new slice of the business needs another dashboard, another filtered view, another round of SQL cleanup. A conversational layer changes the pace. Instead of filing a ticket for a cohort grid, a founder can ask Statspresso: "Show D1, D7, and D30 retention for May signups as a cohort table, split by plan type."
The principle stays the same at every stage. Pick the few metrics that match the company’s current bottleneck, define them tightly, and make them easy to question. Startups move too fast to treat analytics like a monthly publishing exercise.
Your Implementation Roadmap Quick Wins vs Scalable Stack
Monday morning, the founder wants to know why trial-to-paid conversion slipped. Marketing blames lead quality. Product suspects onboarding. The analyst is in meetings, the dashboard is stale, and three teams are arguing from screenshots.
That is a tooling problem, not just a reporting problem.
Quick wins this week
Start with the systems already holding business-critical data. For early-stage teams, that usually means Postgres, Shopify, HubSpot, Stripe, support tools, and one product event source.
The first goal is simple. Get answers your team can act on this week.
A practical week-one checklist:
Connect core sources: Start with the database and one or two operational systems your team already trusts.
Ask business questions, not schema questions: Query “Which leads converted after the demo?” instead of hunting for table names.
Create a tiny metric set: Revenue, activation, onboarding completion, and one retention view are enough to begin.
Share answers where decisions happen: Put charts into Slack threads, docs, and meeting notes.
A conversational layer helps non-technical teams stop waiting on ad hoc reporting. Tools in the market approach this from different angles, and some analytics solutions specifically for startups are built for speed and lightweight implementation instead of a heavy BI rollout.
The advantage is not magic. It is cycle time. Asking Statspresso a plain-English question shortens the path from debate to evidence, especially before the company has a full data team or polished reporting stack.
Build the foundation when the questions repeat
Once the same questions come up every week, manual querying gets expensive. That is the point to centralize data and clean up definitions.
For startups, a sensible pattern is to load raw data from tools like Shopify, HubSpot, and Postgres into one repository first, then model it with dbt. That gives the team a shared base without forcing every business rule to be finalized on day one.
That setup works for a few practical reasons:
Load first: Keep raw data intact so you can revisit assumptions later.
Transform after: Define business logic in modular SQL models.
Test definitions: Use lineage and checks to catch drift.
Publish once: Feed dashboards and self-serve analysis from governed models.
ELT works like bringing every book into the same library before you catalog the shelves. ETL tries to reorganize each book before it even gets through the door. For a startup with changing questions, the first approach usually wastes less time.
The trade-off is real. A quick conversational setup gets answers fast, but it will not replace data modeling once finance, product, and growth all need the same metric definitions. The right roadmap uses both. Start with fast access to answers, then add structure when repeated questions justify the effort.
The old way versus the new way of getting answers
Task | The Old Way (Manual BI) | The New Way (Statspresso) |
|---|---|---|
Check revenue trends | Ask an analyst to write SQL and update a dashboard | Ask a plain-English question and get a chart |
Compare channels | Export CSVs from multiple tools and merge manually | Query connected sources in one interface |
Investigate funnel drop-off | Wait for a custom report | Ask follow-up questions in the same thread |
Share findings with the team | Paste screenshots into docs | Share live answers and charts |
Handle ad hoc leadership questions | Interrupt the data person | Let teams self-serve against trusted data |
One practical option in this category is Statspresso, a conversational AI data analyst that connects sources like Shopify, HubSpot, Linear, and Postgres so teams can ask plain-English questions and get charts without writing SQL.
What to avoid
Three implementation mistakes show up constantly:
Overbuilding too early: A stack designed for a later-stage company will drain the team you have now.
Keeping logic in too many places: If a metric lives in spreadsheets, dashboards, and one analyst’s head, it will drift.
Confusing dashboards with adoption: A wall of charts does not mean the team can answer questions quickly.
Buy speed first. Add complexity when repeated decisions depend on it.
Beyond Dashboards Embedding Insights into Your Workflow
Dashboards are fine. Passive dashboards are not. If the only time your team looks at metrics is during a Monday review, analytics is functioning as decoration.
Put answers where work already happens
Useful analytics should show up inside the tools your team already uses to make decisions.
That usually means:
Slack alerts for anomalies: Flag unusual changes in signups, usage, or revenue.
Meeting-time queries: Ask a live question when a product or growth debate appears.
Shared charts in context: Drop a visual into a planning doc or sprint thread, not a separate reporting portal.
Follow-up analysis on demand: Let a PM or marketer ask the second question immediately.
This shift matters because a dashboard answers the question someone predicted in advance. A conversational workflow answers the question that came up five minutes ago.
If you’re thinking about what that looks like in product or client-facing contexts, embedded analytics explained in this guide is a useful reference for turning reporting into part of the workflow itself.
Predictive analytics is finally practical
Forecasting used to sound like a luxury item for teams with a data scientist and a lot of patience. It’s now much more accessible when your startup already has unified historical data.
According to AWS’s guide to how startup companies scale with data analytics, predictive analytics services can forecast customer metrics like churn with 85 to 95% accuracy, and conversational tools can query those forecasts directly. The same source notes that interventions aimed at at-risk users have been shown to recover 12 to 18% of potential churn.
That matters because predictive analytics changes the timing of the conversation. Instead of asking why churn rose last month, the team can ask who looks risky now and what intervention is worth trying.
Try asking Statspresso: "Forecast Q3 churn and show the segments with the highest risk."
Dashboards report. Workflows respond.
A startup gets real value from analytics when it changes daily behavior.
Examples:
Product teams use activation and retention signals during prioritization.
Growth teams compare channels based on quality, not just volume.
Customer teams surface accounts that look wobbly before renewal becomes a fire drill.
Leaders stop asking for “the dashboard” and start asking sharper operational questions.
That’s the quiet advantage of conversational analytics and automated BI. It lowers the cost of curiosity. People ask more questions because they know they’ll get answers fast.
Data Governance That Isnt a Four-Letter Word
Governance sounds like something a startup promises to handle after the next fundraise. That’s a mistake. If your team can’t agree on what a metric means, speed just helps you spread confusion faster.
Metric chaos usually starts innocently. Product defines “active user” one way. Marketing uses another filter. Finance reports revenue on a different basis. Everybody is sincere. Everybody is wrong for someone else’s purpose.
Trust is a speed feature
Good governance means a few simple things:
One definition per key metric: Revenue, activation, retention, and active users should have a home.
Visible calculation logic: Teams should know how a number was produced.
Controlled access: People can explore data without exposing what they shouldn’t see.
Reliable refresh habits: Stale data erodes trust faster than messy design ever will.
This is why central modeling matters. When metrics live in version-controlled definitions instead of scattered reports, the business spends less time debating arithmetic and more time deciding what to do.
Governance is not bureaucracy. It is the reason a company can answer the same question twice and get the same answer.
Privacy matters early in regulated markets
This becomes even more important in healthtech, fintech, and other regulated niches. Privacy-compliant analytics is still under-addressed in most startup advice, even though it’s not optional for these teams.
For startups in regulated markets, MIT Sloan’s discussion of analytics as a startup advantage notes that data privacy fines exceed $2B+ yearly in markets like the US and EU. The same source highlights the value of tools that support compliant, no-SQL querying of sources like HubSpot or HIPAA-compliant databases.
The practical takeaway is simple. If people need self-serve analytics, give them access to answers, not to raw sensitive records. The right setup lets a growth lead ask for lead-to-demo conversion trends without exposing personal data they never needed to see.
What good governance looks like in a startup
It doesn't need a committee and a forty-page policy.
It usually starts with:
A short metric glossary
A central modeled layer
Permissioning by role
A habit of fixing broken definitions immediately
That’s enough to stop most startup reporting drama before it becomes cultural debt.
Your Next Step From Reading to Asking
If analytics for startups feels messy, it’s usually because teams try to solve for sophistication before they solve for access. The right move is simpler. Track the signals that match your stage. Keep definitions tight. Make answers easy to get.
TLDR
Pre-PMF teams should track validation signals: Focus on activation, onboarding completion, and early retention, not a giant KPI catalog.
Post-PMF teams need cleaner economics: Unit metrics and cohort analysis matter once repeatable growth appears.
ELT is the scalable path: Load raw data first, then transform centrally so definitions stay consistent.
Dashboards alone are not enough: Analytics becomes useful when insights show up in workflows, meetings, and team decisions.
Governance is practical, not ceremonial: Shared definitions and permissioning prevent metric chaos.
Conversational analytics removes the queue: Skip the SQL. Ask a question, get an answer, keep moving.
A few common questions usually come next.
Do I need a warehouse right now? Not always. If your questions are still basic and your sources are limited, start with direct access and a small metric set.
When should I tighten the stack? When the same questions repeat and ad hoc reporting starts wasting time.
What should your team do today? Connect the source that already holds your most important business data, ask one real question, and see where the gaps are.
Frequently Asked Questions About Startup Analytics
What should a startup track first
Start with the smallest set of metrics that tells you whether the product is working for your current stage.
For very early teams, that usually means activation, onboarding completion, and short-loop retention. After product-market fit, you add unit economics, cohorts, and channel quality. If you can’t act on a metric this month, it probably doesn’t belong in the first dashboard.
Do I need to hire a data analyst early
Not always. What you need first is the ability to answer recurring business questions without slowing the team down.
A dedicated analyst becomes more useful when questions are frequent, cross-functional, and expensive to answer manually. Before that point, a strong product or ops lead with a lightweight analytics setup can cover a lot of ground. The trap is hiring a reporting bottleneck instead of building self-serve access.
What if my data is spread across multiple tools
That’s normal. Most startups have customer data in a database, lead data in a CRM, billing data in a payment system, and product signals in an event tool.
The immediate fix is not “rip everything out.” It’s to create a query layer or central flow that lets those systems be analyzed together. Over time, repeated cross-source questions justify a more structured ELT setup.
Are dashboards still useful
Yes, but only for stable questions. Dashboards work best when a team wants to monitor a known metric repeatedly.
They work poorly for exploratory analysis, meeting-time follow-ups, and all the weird one-off questions that drive startup decisions. That’s why conversational analytics and automated BI are such a good fit for fast-moving teams. They complement dashboards instead of replacing every reporting surface.
How much should a startup spend on analytics
Spend according to the cost of unanswered questions, not according to what enterprise BI vendors would love to sell you.
Early teams can do a lot with lightweight tooling and a disciplined metric set. As the business grows, the spend should map to clear pain points: repeated manual work, disputed KPIs, poor visibility across tools, or slow decision cycles. If your stack is expensive but your team still can’t answer simple questions quickly, you bought complexity, not analytics.
How do I keep metrics trustworthy as the company grows
Define your key business metrics once, keep them in a central model, and make the calculation logic visible. Then stop letting every team invent local versions in spreadsheets.
If a metric changes, update the source definition and communicate it clearly. The goal isn’t rigid perfection. It’s that sales, product, finance, and leadership can look at the same number without starting a debate.
Can non-technical teams really self-serve analytics
Yes, if the interface matches how they think. Most non-technical users don’t struggle because analytics is impossible. They struggle because the tools expect them to think in tables, joins, and chart builders.
When you let people ask business questions in plain English, adoption gets much easier. The key condition is that those answers are grounded in trusted data and shared definitions.
Stop waiting for answers. Statspresso is a conversational AI data analyst that lets teams connect their data, ask plain-English questions, and get charts in seconds. Connect your first data source for free and ask your first question in the next five minutes.