AI Reporting Software: 2026 Buyer's Guide
You already know the drill. Someone asks, “Can I get revenue by channel, compare it to last month, and break it out by region?” Then the request disappears into a backlog, a dashboard queue, or a Slack thread with three follow-up questions.
Waiting weeks for a data analyst to build a dashboard is a relic of the past. Good ai reporting software removes that bottleneck. It lets founders, PMs, and marketing leads ask plain-English questions and get usable answers fast, without turning every metric into a mini BI project.
What Exactly Is AI Reporting Software
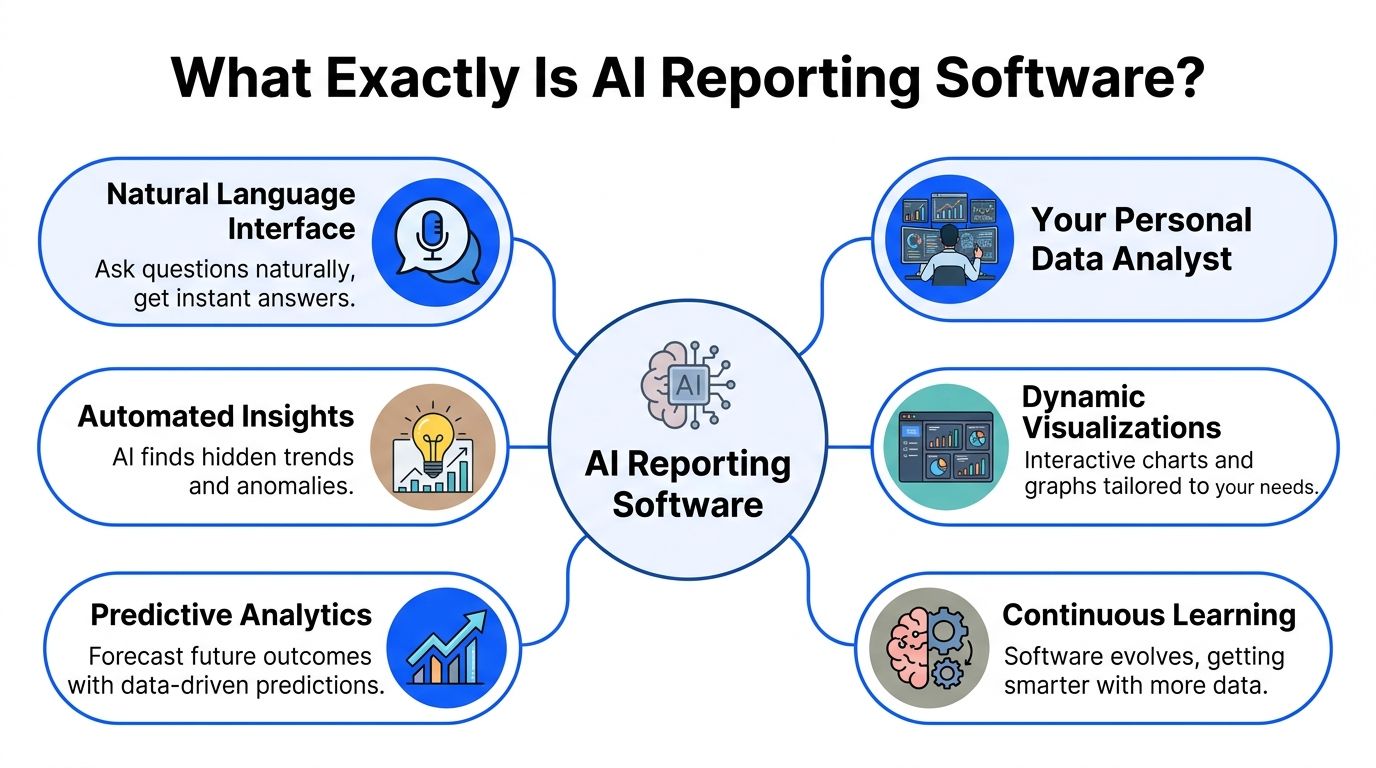
Think of ai reporting software as a data analyst you can talk to.
Not a magic robot. Not a shiny dashboard skin. A working layer between your team and your data that translates business questions into queries, charts, summaries, and follow-up analysis.
That shift matters because many teams don’t have a data problem. They have an access problem. The data exists. The answer is buried under SQL, scattered across tools, or locked behind whoever knows the warehouse schema.
It’s conversation plus reporting
Traditional BI expects users to adapt to the tool.
AI reporting flips that. The tool adapts to how people work. You ask:
“Show MRR by month.”
“Which campaigns drove demo requests last week?”
“Why did churn spike after the pricing change?”
“Break this down by plan and geography.”
A solid system turns that into a chart, table, or explanation tied to your real data.
That’s why the category is growing beyond analyst teams. In 2025, 43% of organizations globally are using AI-powered analytics software in production, 56% prioritize improved decision-making as the top goal, and 24% plan to triple access for non-technical users within 12 months, according to the State of AI+BI Analytics Global 2025 Report across 235 professionals in 38 countries (strategy.com/software/survey).
The change is who gets answers
This isn’t just about making dashboards faster.
It changes who can ask good questions and get answers without waiting. Founders can check sales trends before a board call. PMs can inspect feature adoption without filing a ticket. Marketing leads can test a channel hypothesis while the campaign is still running.
Practical rule: If a tool still needs an analyst for every follow-up question, it’s not really ai reporting software; it’s old BI with a chatbot taped on.
A useful way to frame this is through the broader lens of what Artificial Intelligence in business entails. The practical value isn’t “using AI.” It’s reducing friction between a business question and a reliable action.
Where a conversational layer helps
The best products in this category usually combine a few things:
Natural-language querying so people can ask normal questions
Context awareness so “revenue” or “active user” means your company’s definition
Fast charting so answers aren’t trapped in text
Follow-up analysis so users can keep drilling in
Shareable outputs so one answer becomes team knowledge
A Conversational AI Data Analyst model makes sense here. Instead of making everyone learn SQL, modeling conventions, or dashboard navigation, the software handles the heavy lifting and returns the answer in a form people can use.
If you’ve ever thought, “I don’t need more dashboards, I need fewer delays,” you already understand the point.
How It Differs From Your Old Dashboards
Your old dashboards weren’t necessarily bad. They were built for a different operating model.
That model assumed a specialist would define the metrics, write the queries, build the chart, publish the dashboard, and maintain it. That works in large enterprises with dedicated BI teams. It breaks down in startups and SMBs where everyone needs answers now.
Old BI was built around requests
The old workflow usually looks like this:
A founder or PM asks a question.
An analyst asks clarifying questions.
SQL gets written.
A chart gets built.
Someone notices the grouping is wrong.
The process starts again.
That’s fine for recurring board metrics. It’s terrible for day-to-day decisions.
AI reporting software changes the interaction model. Instead of a request queue, you get direct exploration. Ask a question, inspect the answer, refine it, and move on.
Traditional BI vs AI reporting software
Aspect | The Old Way (Manual SQL & Dashboards) | The New Way: AI Reporting like Statspresso |
|---|---|---|
Starting point | Open a BI tool and hunt for the right dashboard | Ask a question in plain English |
Who can use it well | Analysts and power users | Founders, PMs, marketers, ops, and analysts |
Speed to first answer | Depends on backlog, dashboard availability, and query work | Immediate conversational exploration |
Follow-up questions | Usually require another ticket or query edit | Ask another question in the same thread |
Handling ambiguity | Needs manual clarification before work begins | Good tools clarify or infer using business context |
Chart creation | Built manually in dashboard software | Generated alongside the answer |
Metric definitions | Often buried in documentation or one analyst’s memory | Grounded in defined business context when configured well |
Best use case | Fixed reporting and recurring executive dashboards | Self-serve questions, ad hoc analysis, and fast iteration |
Main frustration | Delay, dependency, and dashboard sprawl | Accuracy depends on setup and governance |
This shift is bigger than dashboards
The money flowing into generative AI gives you a clue that this isn’t a side feature. Worldwide spending on generative AI is projected to reach $644 billion in 2025, a 76.4% increase from 2024, and 51% of companies integrating Gen AI report revenue increases of over 10%, especially in marketing, sales, and product development (sequencr.ai/insights/key-generative-ai-statistics-and-trends-for-2025).
That matters because those are exactly the teams that hate waiting for reports.
A dashboard tells you what someone predicted you’d want to know. Conversational analytics lets you ask what just came up in the meeting.
What still doesn’t work
Some tools market themselves as AI reporting software but still act like old BI underneath.
Watch for these warning signs:
Chat without context: It can answer simple questions, but it doesn’t know your KPI definitions.
Pretty summaries with weak traceability: You get fluent text, but not enough confidence in how the answer was produced.
Static dashboards dressed up as AI: You still spend most of your time navigating tabs.
Enterprise-heavy setup: The implementation asks for a full data team, consulting budget, and patience.
What works is simpler. A tool should answer common business questions quickly, show the result clearly, and let a non-technical user keep going without getting stuck.
That’s a key difference. Old dashboards are destinations. AI reporting software is a conversation.
Core Capabilities of Modern AI Reporting Tools
If you’re evaluating tools, ignore the flashy demo first. Look at the plumbing.
Modern ai reporting software is useful when the interface feels simple but the underlying system is disciplined. That means natural language on the surface, and strong data connections, context handling, and model orchestration underneath.

Natural-language querying that lands
The first capability is obvious. Users should be able to ask a normal question and get a useful answer.
But there’s a huge difference between:
“I can parse a sentence”
and
“I understand your business schema, metric logic, and expected output”
Good natural-language query systems don’t just turn words into SQL. They map terms like “paid conversions,” “reactivated user,” or “pipeline created” to the right fields and logic.
That’s why setup matters. If the business context is sloppy, the answers will be sloppy too.
Try asking your tool:
“Show monthly recurring revenue by plan for the last 12 months as a line chart.”
If it returns a vague summary or asks you to rewrite the question three times, keep shopping.
Predictive reporting inside the workflow
The next step up is when reporting isn’t limited to historical data.
Modern systems can use BigQuery ML and Vertex AI integrations to run predictive use cases like churn prediction, lead scoring, and demand forecasting directly inside reporting workflows. That architecture can cut time-to-insight from hours to minutes by removing manual handoffs between model outputs and dashboard layers, and it can support model choices across OpenAI, Claude, and Gemini depending on cost, speed, and reasoning depth (improvado.io/blog/top-ai-reporting-tools).
This matters more than it sounds.
In old setups, predictive work often lives in a separate lane:
data gets exported
a model runs elsewhere
predictions come back later
someone tries to stitch them into reporting
That’s slow and brittle. In a better setup, predicted churn risk or demand signals appear where the team already reviews performance.
Context and governance
This is the unglamorous feature that saves you from nonsense.
A strong ai reporting software stack needs a way to define:
Business metrics
Trusted tables
Naming conventions
Default joins
Allowed sources
If you don’t set that up, the AI may still answer. It just won’t answer reliably.
Buyer note: The smartest model in the world can’t rescue undefined metrics. “Revenue” has to mean one thing inside the system.
Operational checks also matter here. Teams already using tools for data quality, instrumentation review, or event debugging often adapt faster because they’ve cleaned up part of the foundation. If you’re tightening your tracking stack, an AI-assisted debugger can help catch instrumentation issues before they pollute reporting.
Outputs people can use
A final capability gets overlooked. Answers need to become artifacts.
That means the tool should turn a good query into something reusable:
a saved chart
a shared dashboard tile
a scheduled report
a client-facing export
an embedded analytic component
One practical example in this category is Statspresso, which functions as a Conversational AI Data Analyst by letting teams connect sources, ask plain-English questions, and get charts and explanations without SQL.
If a tool gives good one-off answers but doesn’t help your team organize and reuse them, it won’t stick. Reporting software only saves time when good questions become repeatable assets.
Real-World Use Cases For Every Team Role
The easiest way to judge ai reporting software is to ask a simple question. “Who on my team gets faster answers tomorrow morning?”
If the answer is only “the analyst,” you bought the wrong thing.

Product managers who need the answer before standup
PMs live in follow-up questions.
A feature launched last week. Adoption looks soft. Now the PM needs to know whether the issue is onboarding, pricing tier, account size, or something else. Waiting for a custom report kills momentum.
Useful prompts look like this:
Try asking: “Show feature adoption by signup cohort.”
Try asking: “Compare activation rate for users who saw the new onboarding flow versus the old one.”
Try asking: “Which accounts used the feature at least three times in the last 30 days?”
The point isn’t that AI writes a clever paragraph. The point is that the PM can iterate on the question until the pattern is clear.
Marketing leads who can’t wait for campaign postmortems
Marketing reporting goes stale fast.
A paid channel starts to slip. Branded search rises. Email conversion drops. By the time someone exports data from three tools and cleans the campaign names, the budget has already moved.
Good ai reporting software helps a marketing lead test a hypothesis while the campaign is still active.
Prompts worth using:
Try asking: “Show revenue by acquisition channel for the last quarter as a bar chart.”
Try asking: “Which campaigns drove the most demo requests last week?”
Try asking: “Break down conversion rate by landing page and device type.”
Conversational analytics shines here. Marketers don’t think in SQL clauses. They think in channels, campaigns, audiences, and outcomes.
If the tool forces a marketer to understand schema names before they can answer a campaign question, adoption will decline.
Executives who need fewer dashboards and better clarity
Founders and execs don’t want ten dashboards. They want a short path from question to signal.
The common executive mistake is asking BI teams to build one more dashboard for every new concern. That creates dashboard sprawl, not clarity.
Executives use AI reporting well when they ask narrow, decision-driving questions:
Try asking: “Show cash-efficient growth trends by month.”
Try asking: “What changed in new customer revenue since the pricing update?”
Try asking: “Compare churn, expansion, and net revenue retention by segment.”
A good system returns the number, the chart, and enough explanation to support the next decision.
Agencies and consultancies that need client-ready reporting
Agencies have a special kind of pain. They answer similar questions across different client accounts, but the sources, naming, and definitions vary just enough to create reporting chaos.
Grounded context matters here. AI reporting tools can deliver an 85% faster review process in engineering report analysis workflows by letting users define KPI definitions and metric mappings, which helps generate complex filtered reports in seconds with conversational prompts (v7labs.com/automations/engineering-reports).
That same pattern matters for agencies. If each client has a slightly different definition of “qualified lead” or “closed revenue,” the tool has to respect that.
Useful agency prompts:
Try asking: “Show client performance by account, channel, and month.”
Try asking: “Create a weekly summary of paid spend, leads, and attributed revenue.”
Try asking: “Flag accounts where spend rose but conversions fell.”
Operations and support teams that need a plain answer
Ops and support teams often get ignored in AI reporting conversations, but they benefit quickly because they ask highly practical questions.
They want to find exceptions, delays, outliers, and bottlenecks.
Questions might include:
Try asking: “Show tickets reopened in the last 14 days by category.”
Try asking: “Which accounts had delayed onboarding tasks this month?”
Try asking: “List customers with low usage and recent support escalations.”
That kind of workflow matters because many business decisions aren’t strategic. They’re operational. They need a clean answer before the next handoff.
The best use case for ai reporting software usually isn’t “replace all BI”; it’s “remove the delay on the questions your team asks every day.”
Your Buyer Checklist for Choosing a Tool
Many SMB teams don’t fail with ai reporting software because the idea is bad. They fail because they buy an enterprise-shaped product that’s too expensive, too complex, or too vague about setup.
The adoption problem is real. A 2026 Accion Opportunity Fund survey found that 65% of small businesses in underserved communities see AI tools as important, yet adoption remains low because of financial constraints and complexity (domo.com/learn/article/ai-reporting-tools).
The checklist that matters
Use this list when you’re evaluating vendors.
Can non-technical people get a correct answer fast Don’t settle for a polished demo. Ask the vendor to answer a real business question from your team.
Does it connect to your actual stack If your business runs on Postgres, Shopify, HubSpot, Stripe, or product data in a warehouse, the first connection should feel straightforward.
Can you define business context clearly You need a place to set KPI definitions, trusted sources, and naming rules. Without that, every answer is suspect.
Does pricing match SMB reality Avoid tools that require a giant platform commitment before you’ve proven value. Transparent, tiered pricing is a better fit for growing teams.
Are outputs reusable A useful answer should become a saved chart, dashboard component, export, or scheduled report.
Questions I’d ask on the demo
Some questions reveal a lot, fast:
“Show me how you handle a metric with a custom definition.”
“What happens when two sources disagree?”
“Can my marketer use this without learning warehouse tables?”
“How long from connection to first reliable answer?”
For a broader view of this area, this guide to AI business intelligence tools is a practical companion when comparing categories.
What to avoid
Skip tools that rely on hand-wavy intelligence and hide the operational details.
Bad signs include:
Opaque answers
Consulting-heavy onboarding
Weak data context
Pricing that punishes exploration
If a product looks impressive but feels hard to trust, your team won’t use it after the pilot.
A Simple Rollout Guide to Get Your Team Onboard
Many teams overcomplicate rollout. They treat ai reporting software like a warehouse migration.
It isn’t. The fastest path is to start with one painful question, one trusted data source, and one small group of users.
Start with one source and one job
Pick a use case with obvious value.
Good starting points:
weekly revenue checks
campaign performance questions
feature adoption reviews
client reporting summaries
Don’t begin with “unify all company data.” Begin with “answer this recurring question without waiting.”
Define a few trusted metrics first
Before broad rollout, lock down the terms people use every day.
Make sure the tool knows:
what counts as revenue
how you define an active customer
which table is trusted for conversions
how date filters should work
That small setup step prevents a lot of confusion later.
Start narrow. Teams trust new reporting workflows when the first answers are obviously useful and obviously correct.
Give the team prompts, not training manuals
People adopt conversational tools when they know what to ask.
Share a short starter list in Slack or Notion:
“Show revenue by month for the last year.”
“Compare conversion rate by channel this quarter.”
“List customers with declining usage.”
“Break churn down by plan.”
That does more for adoption than a long enablement deck.
Turn quick wins into team habits
Once a few people get useful answers, save the best outputs and reuse them.
A practical rollout rhythm looks like this:
Connect one source
Answer one recurring business question
Save the chart or report
Share it in a regular team workflow
Expand to the next use case
That pattern builds confidence. It also avoids the classic BI trap where a promising tool becomes another abandoned workspace.
The goal isn’t to launch a grand analytics program. It’s to make asking the data a normal part of the workday.
Your Next Move From Questions to Clarity
TL;DR
AI reporting software is a conversational layer on top of your data, not just another dashboard tool.
The big win is access. Founders, PMs, marketers, and ops teams can answer questions without waiting on SQL queues.
The right tool respects business context, not just language prompts.
SMB teams should favor simple rollout, transparent pricing, and fast time to first answer.
Adoption sticks when you start with one source and one high-value reporting pain point.
If your team is still filing tickets for basic reporting questions, the cost isn’t just time. It’s delayed decisions.
Connect your first data source for free and ask your first question in the next five minutes.
Frequently Asked Questions
Is ai reporting software safe for sensitive business data
Safety depends on the vendor and how you set it up.
Ask direct questions about permissions, storage, workspace separation, audit logs, and whether the model trains on your data. Then check whether row-level access and role-based restrictions match how your team already handles finance, customer, or pipeline data. A startup does not need enterprise theater here. It needs clear answers and sensible controls.
A simple test works well. If the vendor cannot explain the security model in plain English to a founder or ops lead, keep looking.
How do I know the answers are accurate
Accuracy usually comes down to three things. Clean source data, clear metric definitions, and visible query logic.
Good tools let you pin trusted tables, define terms like revenue or active user, and inspect how an answer was built. That matters because the failure mode is rarely "the AI is bad." The usual problem is that two teams use the same word for two different metrics, or the source data has gaps the interface cannot fix.
During rollout, compare answers against a report your team already trusts. If a marketer or PM cannot trace the result back to a source, the tool is not ready for day-to-day decisions.
Reliable AI reporting starts with reliable definitions. A lot of "AI accuracy" issues start earlier, in the data model and KPI rules.
Will this replace my analyst or BI team
It re-focuses your analyst's time on higher-value work.
Instead of spending half the week answering repeat questions like "break this down by channel" or "show this by month," they can spend more time on metric design, data quality, experimentation support, forecasting, and root-cause analysis. Those are the jobs that change decisions.
For small teams, that shift matters even more. You may only have one analyst, or none at all. AI reporting software helps the rest of the team handle routine reporting without turning every question into a queue.
Is this only useful for bigger companies
Smaller teams often see the fastest gains because reporting bottlenecks hit them harder.
A founder waiting two days for a CAC breakdown feels that delay immediately. So does a PM trying to explain a retention dip before the weekly meeting. Bigger companies may have larger BI teams and more formal processes. Startups and SMBs usually need speed, decent guardrails, and answers today.
That is why this category fits lean teams well. You get faster access to data without hiring a full reporting function first.
What’s the fastest way to test whether a tool is worth it
Use one live question your team already asks every week.
Connect the source behind that question, define the metric clearly, and hand the tool to a non-technical teammate. If they can get the right answer in a few minutes, with enough visibility to trust it, you have something useful. If they need prompt tricks, analyst help, or cleanup in spreadsheets, the demo looked better than the product.
That test tells you more than a polished sales call.
Not sure which tool fits your stack? We've ranked and compared the best AI reporting tools for 2026 — 8 tools evaluated on ease of use, connector breadth, and whether a non-technical teammate can get an answer on day one.
If you want to see this in practice, try Statspresso. Connect a source, ask a plain-English question, and see whether your team can move from report requests to real answers without writing SQL.
You already know the drill. Someone asks, “Can I get revenue by channel, compare it to last month, and break it out by region?” Then the request disappears into a backlog, a dashboard queue, or a Slack thread with three follow-up questions.
Waiting weeks for a data analyst to build a dashboard is a relic of the past. Good ai reporting software removes that bottleneck. It lets founders, PMs, and marketing leads ask plain-English questions and get usable answers fast, without turning every metric into a mini BI project.
What Exactly Is AI Reporting Software
Think of ai reporting software as a data analyst you can talk to.
Not a magic robot. Not a shiny dashboard skin. A working layer between your team and your data that translates business questions into queries, charts, summaries, and follow-up analysis.
That shift matters because many teams don’t have a data problem. They have an access problem. The data exists. The answer is buried under SQL, scattered across tools, or locked behind whoever knows the warehouse schema.
It’s conversation plus reporting
Traditional BI expects users to adapt to the tool.
AI reporting flips that. The tool adapts to how people work. You ask:
“Show MRR by month.”
“Which campaigns drove demo requests last week?”
“Why did churn spike after the pricing change?”
“Break this down by plan and geography.”
A solid system turns that into a chart, table, or explanation tied to your real data.
That’s why the category is growing beyond analyst teams. In 2025, 43% of organizations globally are using AI-powered analytics software in production, 56% prioritize improved decision-making as the top goal, and 24% plan to triple access for non-technical users within 12 months, according to the State of AI+BI Analytics Global 2025 Report across 235 professionals in 38 countries (strategy.com/software/survey).
The change is who gets answers
This isn’t just about making dashboards faster.
It changes who can ask good questions and get answers without waiting. Founders can check sales trends before a board call. PMs can inspect feature adoption without filing a ticket. Marketing leads can test a channel hypothesis while the campaign is still running.
Practical rule: If a tool still needs an analyst for every follow-up question, it’s not really ai reporting software; it’s old BI with a chatbot taped on.
A useful way to frame this is through the broader lens of what Artificial Intelligence in business entails. The practical value isn’t “using AI.” It’s reducing friction between a business question and a reliable action.
Where a conversational layer helps
The best products in this category usually combine a few things:
Natural-language querying so people can ask normal questions
Context awareness so “revenue” or “active user” means your company’s definition
Fast charting so answers aren’t trapped in text
Follow-up analysis so users can keep drilling in
Shareable outputs so one answer becomes team knowledge
A Conversational AI Data Analyst model makes sense here. Instead of making everyone learn SQL, modeling conventions, or dashboard navigation, the software handles the heavy lifting and returns the answer in a form people can use.
If you’ve ever thought, “I don’t need more dashboards, I need fewer delays,” you already understand the point.
How It Differs From Your Old Dashboards
Your old dashboards weren’t necessarily bad. They were built for a different operating model.
That model assumed a specialist would define the metrics, write the queries, build the chart, publish the dashboard, and maintain it. That works in large enterprises with dedicated BI teams. It breaks down in startups and SMBs where everyone needs answers now.
Old BI was built around requests
The old workflow usually looks like this:
A founder or PM asks a question.
An analyst asks clarifying questions.
SQL gets written.
A chart gets built.
Someone notices the grouping is wrong.
The process starts again.
That’s fine for recurring board metrics. It’s terrible for day-to-day decisions.
AI reporting software changes the interaction model. Instead of a request queue, you get direct exploration. Ask a question, inspect the answer, refine it, and move on.
Traditional BI vs AI reporting software
Aspect | The Old Way (Manual SQL & Dashboards) | The New Way: AI Reporting like Statspresso |
|---|---|---|
Starting point | Open a BI tool and hunt for the right dashboard | Ask a question in plain English |
Who can use it well | Analysts and power users | Founders, PMs, marketers, ops, and analysts |
Speed to first answer | Depends on backlog, dashboard availability, and query work | Immediate conversational exploration |
Follow-up questions | Usually require another ticket or query edit | Ask another question in the same thread |
Handling ambiguity | Needs manual clarification before work begins | Good tools clarify or infer using business context |
Chart creation | Built manually in dashboard software | Generated alongside the answer |
Metric definitions | Often buried in documentation or one analyst’s memory | Grounded in defined business context when configured well |
Best use case | Fixed reporting and recurring executive dashboards | Self-serve questions, ad hoc analysis, and fast iteration |
Main frustration | Delay, dependency, and dashboard sprawl | Accuracy depends on setup and governance |
This shift is bigger than dashboards
The money flowing into generative AI gives you a clue that this isn’t a side feature. Worldwide spending on generative AI is projected to reach $644 billion in 2025, a 76.4% increase from 2024, and 51% of companies integrating Gen AI report revenue increases of over 10%, especially in marketing, sales, and product development (sequencr.ai/insights/key-generative-ai-statistics-and-trends-for-2025).
That matters because those are exactly the teams that hate waiting for reports.
A dashboard tells you what someone predicted you’d want to know. Conversational analytics lets you ask what just came up in the meeting.
What still doesn’t work
Some tools market themselves as AI reporting software but still act like old BI underneath.
Watch for these warning signs:
Chat without context: It can answer simple questions, but it doesn’t know your KPI definitions.
Pretty summaries with weak traceability: You get fluent text, but not enough confidence in how the answer was produced.
Static dashboards dressed up as AI: You still spend most of your time navigating tabs.
Enterprise-heavy setup: The implementation asks for a full data team, consulting budget, and patience.
What works is simpler. A tool should answer common business questions quickly, show the result clearly, and let a non-technical user keep going without getting stuck.
That’s a key difference. Old dashboards are destinations. AI reporting software is a conversation.
Core Capabilities of Modern AI Reporting Tools
If you’re evaluating tools, ignore the flashy demo first. Look at the plumbing.
Modern ai reporting software is useful when the interface feels simple but the underlying system is disciplined. That means natural language on the surface, and strong data connections, context handling, and model orchestration underneath.
Natural-language querying that lands
The first capability is obvious. Users should be able to ask a normal question and get a useful answer.
But there’s a huge difference between:
“I can parse a sentence”
and
“I understand your business schema, metric logic, and expected output”
Good natural-language query systems don’t just turn words into SQL. They map terms like “paid conversions,” “reactivated user,” or “pipeline created” to the right fields and logic.
That’s why setup matters. If the business context is sloppy, the answers will be sloppy too.
Try asking your tool:
“Show monthly recurring revenue by plan for the last 12 months as a line chart.”
If it returns a vague summary or asks you to rewrite the question three times, keep shopping.
Predictive reporting inside the workflow
The next step up is when reporting isn’t limited to historical data.
Modern systems can use BigQuery ML and Vertex AI integrations to run predictive use cases like churn prediction, lead scoring, and demand forecasting directly inside reporting workflows. That architecture can cut time-to-insight from hours to minutes by removing manual handoffs between model outputs and dashboard layers, and it can support model choices across OpenAI, Claude, and Gemini depending on cost, speed, and reasoning depth (improvado.io/blog/top-ai-reporting-tools).
This matters more than it sounds.
In old setups, predictive work often lives in a separate lane:
data gets exported
a model runs elsewhere
predictions come back later
someone tries to stitch them into reporting
That’s slow and brittle. In a better setup, predicted churn risk or demand signals appear where the team already reviews performance.
Context and governance
This is the unglamorous feature that saves you from nonsense.
A strong ai reporting software stack needs a way to define:
Business metrics
Trusted tables
Naming conventions
Default joins
Allowed sources
If you don’t set that up, the AI may still answer. It just won’t answer reliably.
Buyer note: The smartest model in the world can’t rescue undefined metrics. “Revenue” has to mean one thing inside the system.
Operational checks also matter here. Teams already using tools for data quality, instrumentation review, or event debugging often adapt faster because they’ve cleaned up part of the foundation. If you’re tightening your tracking stack, an AI-assisted debugger can help catch instrumentation issues before they pollute reporting.
Outputs people can use
A final capability gets overlooked. Answers need to become artifacts.
That means the tool should turn a good query into something reusable:
a saved chart
a shared dashboard tile
a scheduled report
a client-facing export
an embedded analytic component
One practical example in this category is Statspresso, which functions as a Conversational AI Data Analyst by letting teams connect sources, ask plain-English questions, and get charts and explanations without SQL.
If a tool gives good one-off answers but doesn’t help your team organize and reuse them, it won’t stick. Reporting software only saves time when good questions become repeatable assets.
Real-World Use Cases For Every Team Role
The easiest way to judge ai reporting software is to ask a simple question. “Who on my team gets faster answers tomorrow morning?”
If the answer is only “the analyst,” you bought the wrong thing.
Product managers who need the answer before standup
PMs live in follow-up questions.
A feature launched last week. Adoption looks soft. Now the PM needs to know whether the issue is onboarding, pricing tier, account size, or something else. Waiting for a custom report kills momentum.
Useful prompts look like this:
Try asking: “Show feature adoption by signup cohort.”
Try asking: “Compare activation rate for users who saw the new onboarding flow versus the old one.”
Try asking: “Which accounts used the feature at least three times in the last 30 days?”
The point isn’t that AI writes a clever paragraph. The point is that the PM can iterate on the question until the pattern is clear.
Marketing leads who can’t wait for campaign postmortems
Marketing reporting goes stale fast.
A paid channel starts to slip. Branded search rises. Email conversion drops. By the time someone exports data from three tools and cleans the campaign names, the budget has already moved.
Good ai reporting software helps a marketing lead test a hypothesis while the campaign is still active.
Prompts worth using:
Try asking: “Show revenue by acquisition channel for the last quarter as a bar chart.”
Try asking: “Which campaigns drove the most demo requests last week?”
Try asking: “Break down conversion rate by landing page and device type.”
Conversational analytics shines here. Marketers don’t think in SQL clauses. They think in channels, campaigns, audiences, and outcomes.
If the tool forces a marketer to understand schema names before they can answer a campaign question, adoption will decline.
Executives who need fewer dashboards and better clarity
Founders and execs don’t want ten dashboards. They want a short path from question to signal.
The common executive mistake is asking BI teams to build one more dashboard for every new concern. That creates dashboard sprawl, not clarity.
Executives use AI reporting well when they ask narrow, decision-driving questions:
Try asking: “Show cash-efficient growth trends by month.”
Try asking: “What changed in new customer revenue since the pricing update?”
Try asking: “Compare churn, expansion, and net revenue retention by segment.”
A good system returns the number, the chart, and enough explanation to support the next decision.
Agencies and consultancies that need client-ready reporting
Agencies have a special kind of pain. They answer similar questions across different client accounts, but the sources, naming, and definitions vary just enough to create reporting chaos.
Grounded context matters here. AI reporting tools can deliver an 85% faster review process in engineering report analysis workflows by letting users define KPI definitions and metric mappings, which helps generate complex filtered reports in seconds with conversational prompts (v7labs.com/automations/engineering-reports).
That same pattern matters for agencies. If each client has a slightly different definition of “qualified lead” or “closed revenue,” the tool has to respect that.
Useful agency prompts:
Try asking: “Show client performance by account, channel, and month.”
Try asking: “Create a weekly summary of paid spend, leads, and attributed revenue.”
Try asking: “Flag accounts where spend rose but conversions fell.”
Operations and support teams that need a plain answer
Ops and support teams often get ignored in AI reporting conversations, but they benefit quickly because they ask highly practical questions.
They want to find exceptions, delays, outliers, and bottlenecks.
Questions might include:
Try asking: “Show tickets reopened in the last 14 days by category.”
Try asking: “Which accounts had delayed onboarding tasks this month?”
Try asking: “List customers with low usage and recent support escalations.”
That kind of workflow matters because many business decisions aren’t strategic. They’re operational. They need a clean answer before the next handoff.
The best use case for ai reporting software usually isn’t “replace all BI”; it’s “remove the delay on the questions your team asks every day.”
Your Buyer Checklist for Choosing a Tool
Many SMB teams don’t fail with ai reporting software because the idea is bad. They fail because they buy an enterprise-shaped product that’s too expensive, too complex, or too vague about setup.
The adoption problem is real. A 2026 Accion Opportunity Fund survey found that 65% of small businesses in underserved communities see AI tools as important, yet adoption remains low because of financial constraints and complexity (domo.com/learn/article/ai-reporting-tools).
The checklist that matters
Use this list when you’re evaluating vendors.
Can non-technical people get a correct answer fast Don’t settle for a polished demo. Ask the vendor to answer a real business question from your team.
Does it connect to your actual stack If your business runs on Postgres, Shopify, HubSpot, Stripe, or product data in a warehouse, the first connection should feel straightforward.
Can you define business context clearly You need a place to set KPI definitions, trusted sources, and naming rules. Without that, every answer is suspect.
Does pricing match SMB reality Avoid tools that require a giant platform commitment before you’ve proven value. Transparent, tiered pricing is a better fit for growing teams.
Are outputs reusable A useful answer should become a saved chart, dashboard component, export, or scheduled report.
Questions I’d ask on the demo
Some questions reveal a lot, fast:
“Show me how you handle a metric with a custom definition.”
“What happens when two sources disagree?”
“Can my marketer use this without learning warehouse tables?”
“How long from connection to first reliable answer?”
For a broader view of this area, this guide to AI business intelligence tools is a practical companion when comparing categories.
What to avoid
Skip tools that rely on hand-wavy intelligence and hide the operational details.
Bad signs include:
Opaque answers
Consulting-heavy onboarding
Weak data context
Pricing that punishes exploration
If a product looks impressive but feels hard to trust, your team won’t use it after the pilot.
A Simple Rollout Guide to Get Your Team Onboard
Many teams overcomplicate rollout. They treat ai reporting software like a warehouse migration.
It isn’t. The fastest path is to start with one painful question, one trusted data source, and one small group of users.
Start with one source and one job
Pick a use case with obvious value.
Good starting points:
weekly revenue checks
campaign performance questions
feature adoption reviews
client reporting summaries
Don’t begin with “unify all company data.” Begin with “answer this recurring question without waiting.”
Define a few trusted metrics first
Before broad rollout, lock down the terms people use every day.
Make sure the tool knows:
what counts as revenue
how you define an active customer
which table is trusted for conversions
how date filters should work
That small setup step prevents a lot of confusion later.
Start narrow. Teams trust new reporting workflows when the first answers are obviously useful and obviously correct.
Give the team prompts, not training manuals
People adopt conversational tools when they know what to ask.
Share a short starter list in Slack or Notion:
“Show revenue by month for the last year.”
“Compare conversion rate by channel this quarter.”
“List customers with declining usage.”
“Break churn down by plan.”
That does more for adoption than a long enablement deck.
Turn quick wins into team habits
Once a few people get useful answers, save the best outputs and reuse them.
A practical rollout rhythm looks like this:
Connect one source
Answer one recurring business question
Save the chart or report
Share it in a regular team workflow
Expand to the next use case
That pattern builds confidence. It also avoids the classic BI trap where a promising tool becomes another abandoned workspace.
The goal isn’t to launch a grand analytics program. It’s to make asking the data a normal part of the workday.
Your Next Move From Questions to Clarity
TL;DR
AI reporting software is a conversational layer on top of your data, not just another dashboard tool.
The big win is access. Founders, PMs, marketers, and ops teams can answer questions without waiting on SQL queues.
The right tool respects business context, not just language prompts.
SMB teams should favor simple rollout, transparent pricing, and fast time to first answer.
Adoption sticks when you start with one source and one high-value reporting pain point.
If your team is still filing tickets for basic reporting questions, the cost isn’t just time. It’s delayed decisions.
Connect your first data source for free and ask your first question in the next five minutes.
Frequently Asked Questions
Is ai reporting software safe for sensitive business data
Safety depends on the vendor and how you set it up.
Ask direct questions about permissions, storage, workspace separation, audit logs, and whether the model trains on your data. Then check whether row-level access and role-based restrictions match how your team already handles finance, customer, or pipeline data. A startup does not need enterprise theater here. It needs clear answers and sensible controls.
A simple test works well. If the vendor cannot explain the security model in plain English to a founder or ops lead, keep looking.
How do I know the answers are accurate
Accuracy usually comes down to three things. Clean source data, clear metric definitions, and visible query logic.
Good tools let you pin trusted tables, define terms like revenue or active user, and inspect how an answer was built. That matters because the failure mode is rarely "the AI is bad." The usual problem is that two teams use the same word for two different metrics, or the source data has gaps the interface cannot fix.
During rollout, compare answers against a report your team already trusts. If a marketer or PM cannot trace the result back to a source, the tool is not ready for day-to-day decisions.
Reliable AI reporting starts with reliable definitions. A lot of "AI accuracy" issues start earlier, in the data model and KPI rules.
Will this replace my analyst or BI team
It re-focuses your analyst's time on higher-value work.
Instead of spending half the week answering repeat questions like "break this down by channel" or "show this by month," they can spend more time on metric design, data quality, experimentation support, forecasting, and root-cause analysis. Those are the jobs that change decisions.
For small teams, that shift matters even more. You may only have one analyst, or none at all. AI reporting software helps the rest of the team handle routine reporting without turning every question into a queue.
Is this only useful for bigger companies
Smaller teams often see the fastest gains because reporting bottlenecks hit them harder.
A founder waiting two days for a CAC breakdown feels that delay immediately. So does a PM trying to explain a retention dip before the weekly meeting. Bigger companies may have larger BI teams and more formal processes. Startups and SMBs usually need speed, decent guardrails, and answers today.
That is why this category fits lean teams well. You get faster access to data without hiring a full reporting function first.
What’s the fastest way to test whether a tool is worth it
Use one live question your team already asks every week.
Connect the source behind that question, define the metric clearly, and hand the tool to a non-technical teammate. If they can get the right answer in a few minutes, with enough visibility to trust it, you have something useful. If they need prompt tricks, analyst help, or cleanup in spreadsheets, the demo looked better than the product.
That test tells you more than a polished sales call.
Not sure which tool fits your stack? We've ranked and compared the best AI reporting tools for 2026 — 8 tools evaluated on ease of use, connector breadth, and whether a non-technical teammate can get an answer on day one.
If you want to see this in practice, try Statspresso. Connect a source, ask a plain-English question, and see whether your team can move from report requests to real answers without writing SQL.