AI Data Storytelling: Insights Without SQL

You have data. Lots of it. From Shopify, HubSpot, and your own database. But staring at a spreadsheet of raw numbers is noise, not insight. Waiting weeks for a data analyst to build a dashboard is a relic of the past. AI data storytelling turns that chaos into a clear story, showing you what’s really happening in your business and what to do next.
It's time to skip the SQL. Just ask your data a question and get a chart in seconds.
Your Data Is Talking. Are You Listening?

For busy founders, product managers, and marketing leads, a two-week delay for a report means missed opportunities. You're sitting on a mountain of valuable data, but you don't have the time to learn SQL or fight with complicated BI tools. The answers to your most pressing questions are right there, locked behind a technical wall.
This is a classic growing pain. And AI data storytelling is the key to breaking down that wall.
From Data Noise to a Clear Story
AI data storytelling isn't here to replace your intuition; it's here to supercharge it with context, delivered in seconds. Think of it as a translator for your data. It quickly answers the three questions that actually matter:
What happened? It automatically analyzes your data to pinpoint significant changes.
Why did it happen? The AI digs deeper to generate insights that explain the root cause.
What should we do next? The story concludes with practical, data-backed recommendations.
A tool like Statspresso acts as your "Conversational AI Data Analyst," making this entire process feel effortless. Instead of writing code, you just ask questions.
Try asking Statspresso: "What was our monthly recurring revenue (MRR) growth over the last six months?"
You get a chart and a clear, written explanation. No SQL required. That's the power of putting AI data storytelling to work for your business.
What Is AI Data Storytelling, Exactly?
A traditional BI dashboard is like a paper map—it shows you where things are, but it won't tell you the best route or warn you about a traffic jam ahead.
AI data storytelling is your data GPS. It doesn’t just present a chart; it tells you what that chart means, why it looks that way, and what your next turn should be. You’re no longer left guessing why sales suddenly spiked.
The Three Core Components
AI data storytelling isn't magic; it’s a process that combines three key elements to give you the full picture.
Automated Data Analysis (The 'What'): The AI sifts through your data to automatically spot important trends, anomalies, and patterns.
Insight Generation (The 'Why'): The AI connects the dots between different data points to answer the crucial question: “Why did it happen?”
Natural Language Narration (The 'So What'): Finally, the AI translates those complex findings into a simple, clear narrative.
Instead of just a graph showing a sales bump, you get a story: 'Last month's sales jumped by 20%, driven by the new marketing campaign in EMEA.' This ability to create narratives shares roots with technologies like AI copywriting, which also focuses on generating human-like text.
From Raw Data to Actionable Narrative
The market agrees this is a massive step up. According to recent industry reports, the conversational analytics and GenBI market is projected to see explosive growth through 2026, as businesses race to adopt tools that provide instant insights. You can learn more about these AI data analysis trends on findanomaly.ai.
The real value isn't just seeing a number—it's understanding the story that number is telling.
For founders and managers, this means the end of long waits for data reports. With a Conversational AI Data Analyst like Statspresso, you bypass SQL queries and simply ask your data questions directly.
Try asking Statspresso: "Compare our user sign-ups this quarter to last quarter and explain any major differences."
This is what AI-driven conversational analytics is all about: turning complex data into clear answers that empower you to make confident decisions.
How Generative AI Turns Data Into a Conversation
For a long time, automated reporting was clunky. You’d get rigid, template-based summaries that often missed the bigger picture. But generative AI has completely changed the game, shifting data analysis from a one-way street into a dynamic, two-way conversation.
Modern GenAI—the technology that powers tools like Statspresso—doesn't just spit out pre-canned reports. It listens to your specific questions and crafts a unique story from your data, all while understanding the context of your business.
From Static Reports to Dynamic Dialogue
Think about the old workflow. An analyst would spend days pulling numbers and manually piecing together a story. Now, that process is instant.
When you ask a Conversational AI Data Analyst like Statspresso, "Which marketing channels had the best ROI last quarter?", you don't just get a bar chart. You get the whole story.
It explains what the chart means in simple English.
It anticipates your next question, suggesting follow-ups like, "Should we double down on our top-performing channel?"
It pulls out the most important takeaways so you know exactly what to do.
This back-and-forth makes conversational analytics so useful. You can dig deeper, explore a hunch, or pivot your analysis on the fly—all without writing a single line of SQL.
Generative AI isn't just about getting answers faster; it's about asking better questions. It guides you toward insights you might have otherwise missed.
This new dynamic is making waves. The market for generative AI is expected to skyrocket, with some analysts predicting it will reach nearly $100 billion by 2026. And it’s not just hype—a recent McKinsey survey revealed that 65% of organizations using this tech already see major revenue growth.
Getting Answers You Can Trust
Can you really trust a story told by an AI? The key is a concept called data grounding. Any reliable automated BI tool will always show its work.
Every insight it presents can be traced directly back to your source data. This transparency gets rid of the "black box" problem and builds the confidence you need to act.
Try asking Statspresso: "Summarize our new user growth from the last 30 days and highlight the top acquisition source."
In seconds, you get the chart, the numbers, and the narrative. This is how you skip the SQL and get straight from raw data to a smart decision.
Putting AI Data Storytelling Into Practice
Okay, enough theory. How does AI data storytelling actually work for a busy team lead who needs answers now? The whole point is to close the gap between having a question and getting a data-backed answer, without getting stuck in a queue for the analytics team.
This is where it all clicks. For a Marketing Lead, it means you can finally stop guessing which campaigns are driving real results. For a Product Manager, it’s about getting an instant read on user adoption. The true value is speed and accessibility.
From Question to Insight in Seconds
Let’s walk through a real-world scenario. You're a Product Manager who just pushed a new feature live. The old way? You’d file a ticket and hope for a report next week.
With a Conversational AI Data Analyst like Statspresso, the process is different. You just ask.
Try asking Statspresso: 'Show me user engagement for our new feature by customer segment.'
You get a clear chart showing exactly who is—and isn't—using the feature. The AI might add a narrative: “Engagement is highest among enterprise customers, but adoption among SMBs is lagging.” That’s an actionable insight, delivered instantly.
As the diagram shows, a simple question kicks off an automated analysis, which is then translated into a story anyone can understand. This shift toward automated BI is a big reason why 60% of repetitive data management tasks will be automated by 2027, freeing up teams to focus on strategy instead of report-building.
Data Analysis: The Old Way vs. The New Way
The contrast between the traditional approach and AI-driven storytelling is stark. We explore this shift in more detail in our guide to using AI for data analysis.
Let's look at the two methods side-by-side.
Task | The Old Way (Manual SQL) | The New Way (Statspresso) |
|---|---|---|
Get an Answer | Submit a ticket to the data team; wait days or weeks. | Ask a question in plain English; get an answer in seconds. |
Build a Chart | Hope an analyst has time to write SQL and build a viz. | Your chart is auto-generated alongside your answer. |
Find the "Why" | Schedule a meeting to interpret the report. | The AI explains the story behind the data with a clear narrative. |
This isn’t just about speed. It’s about changing how your organization interacts with data, creating a culture where anyone can confidently ask questions and get immediate, trustworthy answers.
Fostering a Culture of Curiosity, Not Confusion

Buying new software doesn't change anything. The real win comes when you change how your team interacts with data. AI data storytelling bridges that gap, moving your team from data confusion to genuine curiosity.
When anyone can ask their own questions and get immediate answers, the whole organization gets smarter. The goal is to make data feel less like a scary final exam and more like an open conversation.
Start Small, Win Big
The secret to a successful rollout isn't a top-down mandate. It’s about creating a "center of gravity" for data curiosity that naturally pulls others in.
Pick a Pilot Team: Start with one high-impact group, like marketing or sales.
Solve a Real Problem: Pinpoint their top 3-5 business questions. What numbers keep them up at night?
Build a Quick-Win Dashboard: Put together a simple, shared space that answers those specific questions.
This approach creates a safe space for exploration where there are no "dumb questions." You’re not just building dashboards; you’re breaking down data silos. By incorporating AI-powered knowledge management, you turn insights into a searchable library of narratives everyone can find and use.
When anyone on the team can ask a question and get a trusted answer in seconds, you're not just building reports; you're building confidence.
From Reactive Reports to Proactive Questions
This small change flips the script. Instead of your team waiting for a monthly report to see what already happened, they start asking proactive questions about what’s happening right now.
Think about a marketing manager checking campaign performance without filing a ticket.
They can just ask Statspresso: "Which of our Google Ads campaigns had the highest cost per acquisition this week?"
That's the power of having a Conversational AI Data Analyst on call 24/7. You shift from a slow, reactive culture to a fast, proactive one.
TL;DR: The Key Takeaways
Find the Story in the Data: AI data storytelling turns raw numbers from places like your Postgres database or Shopify store into a narrative that explains what’s going on.
Talk to Your Data, Don't Code: Ask complex questions in plain English and skip the SQL. It’s the fastest way to get from a question to an answer.
Empower Everyone: This isn't just for data scientists. Give your marketing, product, and sales teams the ability to make their own informed decisions.
Skip the SQL: The core benefit is speed. A Conversational AI Data Analyst like Statspresso lets you get a chart and an explanation in seconds, not days.
Frequently Asked Questions About AI Data Storytelling
Handing your data over to a new system is a big deal. It's natural to have questions. Here are straightforward answers to the concerns we hear most often.
Is My Data Secure When I Connect It to an AI Platform?
Yes. This is a non-negotiable for any reputable platform. Modern tools like Statspresso are built with enterprise-grade security from day one.
Your data is protected with end-to-end encryption and follows strict compliance standards like SOC 2, an independent audit that verifies your data is kept private and secure. Think of it like a bank vault for your data—only your team has the key.
Can I Trust the Narratives Generated by the AI?
You can. The secret is data grounding. A trustworthy Conversational AI Data Analyst doesn’t just give you an answer from a black box; it always shows its work.
Every insight is directly traceable back to the raw data it came from. This transparency is everything. It means you can click on any part of the narrative, see the query used, and check the numbers yourself. This builds confidence in both the tool and your decisions.
How Is This Different from My Standard BI Dashboard?
A traditional BI dashboard is a rearview mirror—it’s great at showing you what happened. You get a page full of charts and are left to figure out the story on your own.
AI data storytelling is your forward-facing GPS. It doesn’t just show you what happened; it explains why it happened and can even suggest what to do next.
It automatically writes the narrative that explains what your charts mean.
It performs automated insight discovery to find trends you might have missed.
It allows for conversational follow-up questions, so you can dig deeper without writing code.
You're no longer just looking at static data points; you're having a conversation with your data.
Try asking Statspresso: "Why did our customer churn rate increase last month?"
It will give you both the chart and the story behind it, instantly. You get answers, not just data.
Ready to stop wrestling with dashboards and start a conversation with your data? Statspresso is a Conversational AI Data Analyst that helps you get answers in seconds. Connect your first data source for free and ask your first question.
You have data. Lots of it. From Shopify, HubSpot, and your own database. But staring at a spreadsheet of raw numbers is noise, not insight. Waiting weeks for a data analyst to build a dashboard is a relic of the past. AI data storytelling turns that chaos into a clear story, showing you what’s really happening in your business and what to do next.
It's time to skip the SQL. Just ask your data a question and get a chart in seconds.
Your Data Is Talking. Are You Listening?
For busy founders, product managers, and marketing leads, a two-week delay for a report means missed opportunities. You're sitting on a mountain of valuable data, but you don't have the time to learn SQL or fight with complicated BI tools. The answers to your most pressing questions are right there, locked behind a technical wall.
This is a classic growing pain. And AI data storytelling is the key to breaking down that wall.
From Data Noise to a Clear Story
AI data storytelling isn't here to replace your intuition; it's here to supercharge it with context, delivered in seconds. Think of it as a translator for your data. It quickly answers the three questions that actually matter:
What happened? It automatically analyzes your data to pinpoint significant changes.
Why did it happen? The AI digs deeper to generate insights that explain the root cause.
What should we do next? The story concludes with practical, data-backed recommendations.
A tool like Statspresso acts as your "Conversational AI Data Analyst," making this entire process feel effortless. Instead of writing code, you just ask questions.
Try asking Statspresso: "What was our monthly recurring revenue (MRR) growth over the last six months?"
You get a chart and a clear, written explanation. No SQL required. That's the power of putting AI data storytelling to work for your business.
What Is AI Data Storytelling, Exactly?
A traditional BI dashboard is like a paper map—it shows you where things are, but it won't tell you the best route or warn you about a traffic jam ahead.
AI data storytelling is your data GPS. It doesn’t just present a chart; it tells you what that chart means, why it looks that way, and what your next turn should be. You’re no longer left guessing why sales suddenly spiked.
The Three Core Components
AI data storytelling isn't magic; it’s a process that combines three key elements to give you the full picture.
Automated Data Analysis (The 'What'): The AI sifts through your data to automatically spot important trends, anomalies, and patterns.
Insight Generation (The 'Why'): The AI connects the dots between different data points to answer the crucial question: “Why did it happen?”
Natural Language Narration (The 'So What'): Finally, the AI translates those complex findings into a simple, clear narrative.
Instead of just a graph showing a sales bump, you get a story: 'Last month's sales jumped by 20%, driven by the new marketing campaign in EMEA.' This ability to create narratives shares roots with technologies like AI copywriting, which also focuses on generating human-like text.
From Raw Data to Actionable Narrative
The market agrees this is a massive step up. According to recent industry reports, the conversational analytics and GenBI market is projected to see explosive growth through 2026, as businesses race to adopt tools that provide instant insights. You can learn more about these AI data analysis trends on findanomaly.ai.
The real value isn't just seeing a number—it's understanding the story that number is telling.
For founders and managers, this means the end of long waits for data reports. With a Conversational AI Data Analyst like Statspresso, you bypass SQL queries and simply ask your data questions directly.
Try asking Statspresso: "Compare our user sign-ups this quarter to last quarter and explain any major differences."
This is what AI-driven conversational analytics is all about: turning complex data into clear answers that empower you to make confident decisions.
How Generative AI Turns Data Into a Conversation
For a long time, automated reporting was clunky. You’d get rigid, template-based summaries that often missed the bigger picture. But generative AI has completely changed the game, shifting data analysis from a one-way street into a dynamic, two-way conversation.
Modern GenAI—the technology that powers tools like Statspresso—doesn't just spit out pre-canned reports. It listens to your specific questions and crafts a unique story from your data, all while understanding the context of your business.
From Static Reports to Dynamic Dialogue
Think about the old workflow. An analyst would spend days pulling numbers and manually piecing together a story. Now, that process is instant.
When you ask a Conversational AI Data Analyst like Statspresso, "Which marketing channels had the best ROI last quarter?", you don't just get a bar chart. You get the whole story.
It explains what the chart means in simple English.
It anticipates your next question, suggesting follow-ups like, "Should we double down on our top-performing channel?"
It pulls out the most important takeaways so you know exactly what to do.
This back-and-forth makes conversational analytics so useful. You can dig deeper, explore a hunch, or pivot your analysis on the fly—all without writing a single line of SQL.
Generative AI isn't just about getting answers faster; it's about asking better questions. It guides you toward insights you might have otherwise missed.
This new dynamic is making waves. The market for generative AI is expected to skyrocket, with some analysts predicting it will reach nearly $100 billion by 2026. And it’s not just hype—a recent McKinsey survey revealed that 65% of organizations using this tech already see major revenue growth.
Getting Answers You Can Trust
Can you really trust a story told by an AI? The key is a concept called data grounding. Any reliable automated BI tool will always show its work.
Every insight it presents can be traced directly back to your source data. This transparency gets rid of the "black box" problem and builds the confidence you need to act.
Try asking Statspresso: "Summarize our new user growth from the last 30 days and highlight the top acquisition source."
In seconds, you get the chart, the numbers, and the narrative. This is how you skip the SQL and get straight from raw data to a smart decision.
Putting AI Data Storytelling Into Practice
Okay, enough theory. How does AI data storytelling actually work for a busy team lead who needs answers now? The whole point is to close the gap between having a question and getting a data-backed answer, without getting stuck in a queue for the analytics team.
This is where it all clicks. For a Marketing Lead, it means you can finally stop guessing which campaigns are driving real results. For a Product Manager, it’s about getting an instant read on user adoption. The true value is speed and accessibility.
From Question to Insight in Seconds
Let’s walk through a real-world scenario. You're a Product Manager who just pushed a new feature live. The old way? You’d file a ticket and hope for a report next week.
With a Conversational AI Data Analyst like Statspresso, the process is different. You just ask.
Try asking Statspresso: 'Show me user engagement for our new feature by customer segment.'
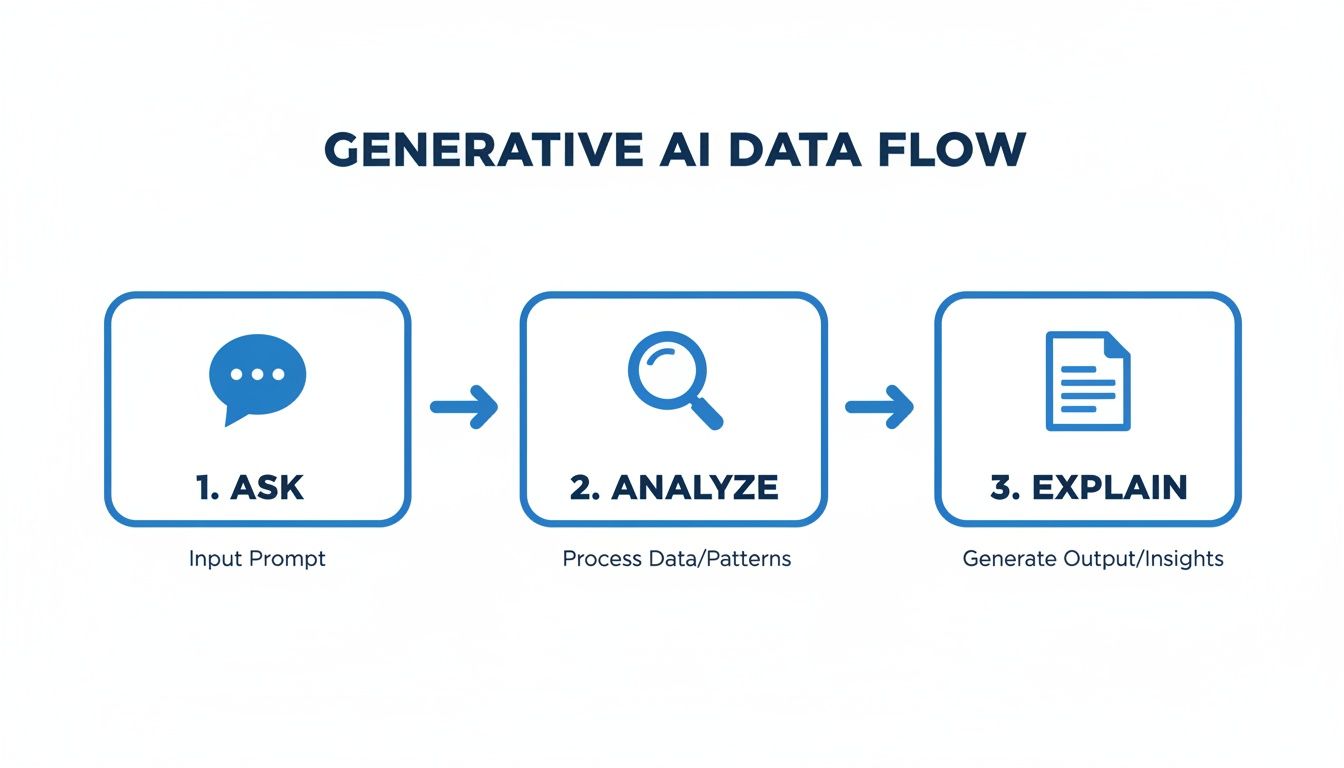
You get a clear chart showing exactly who is—and isn't—using the feature. The AI might add a narrative: “Engagement is highest among enterprise customers, but adoption among SMBs is lagging.” That’s an actionable insight, delivered instantly.
As the diagram shows, a simple question kicks off an automated analysis, which is then translated into a story anyone can understand. This shift toward automated BI is a big reason why 60% of repetitive data management tasks will be automated by 2027, freeing up teams to focus on strategy instead of report-building.
Data Analysis: The Old Way vs. The New Way
The contrast between the traditional approach and AI-driven storytelling is stark. We explore this shift in more detail in our guide to using AI for data analysis.
Let's look at the two methods side-by-side.
Task | The Old Way (Manual SQL) | The New Way (Statspresso) |
|---|---|---|
Get an Answer | Submit a ticket to the data team; wait days or weeks. | Ask a question in plain English; get an answer in seconds. |
Build a Chart | Hope an analyst has time to write SQL and build a viz. | Your chart is auto-generated alongside your answer. |
Find the "Why" | Schedule a meeting to interpret the report. | The AI explains the story behind the data with a clear narrative. |
This isn’t just about speed. It’s about changing how your organization interacts with data, creating a culture where anyone can confidently ask questions and get immediate, trustworthy answers.
Fostering a Culture of Curiosity, Not Confusion
Buying new software doesn't change anything. The real win comes when you change how your team interacts with data. AI data storytelling bridges that gap, moving your team from data confusion to genuine curiosity.
When anyone can ask their own questions and get immediate answers, the whole organization gets smarter. The goal is to make data feel less like a scary final exam and more like an open conversation.
Start Small, Win Big
The secret to a successful rollout isn't a top-down mandate. It’s about creating a "center of gravity" for data curiosity that naturally pulls others in.
Pick a Pilot Team: Start with one high-impact group, like marketing or sales.
Solve a Real Problem: Pinpoint their top 3-5 business questions. What numbers keep them up at night?
Build a Quick-Win Dashboard: Put together a simple, shared space that answers those specific questions.
This approach creates a safe space for exploration where there are no "dumb questions." You’re not just building dashboards; you’re breaking down data silos. By incorporating AI-powered knowledge management, you turn insights into a searchable library of narratives everyone can find and use.
When anyone on the team can ask a question and get a trusted answer in seconds, you're not just building reports; you're building confidence.
From Reactive Reports to Proactive Questions
This small change flips the script. Instead of your team waiting for a monthly report to see what already happened, they start asking proactive questions about what’s happening right now.
Think about a marketing manager checking campaign performance without filing a ticket.
They can just ask Statspresso: "Which of our Google Ads campaigns had the highest cost per acquisition this week?"
That's the power of having a Conversational AI Data Analyst on call 24/7. You shift from a slow, reactive culture to a fast, proactive one.
TL;DR: The Key Takeaways
Find the Story in the Data: AI data storytelling turns raw numbers from places like your Postgres database or Shopify store into a narrative that explains what’s going on.
Talk to Your Data, Don't Code: Ask complex questions in plain English and skip the SQL. It’s the fastest way to get from a question to an answer.
Empower Everyone: This isn't just for data scientists. Give your marketing, product, and sales teams the ability to make their own informed decisions.
Skip the SQL: The core benefit is speed. A Conversational AI Data Analyst like Statspresso lets you get a chart and an explanation in seconds, not days.
Frequently Asked Questions About AI Data Storytelling
Handing your data over to a new system is a big deal. It's natural to have questions. Here are straightforward answers to the concerns we hear most often.
Is My Data Secure When I Connect It to an AI Platform?
Yes. This is a non-negotiable for any reputable platform. Modern tools like Statspresso are built with enterprise-grade security from day one.
Your data is protected with end-to-end encryption and follows strict compliance standards like SOC 2, an independent audit that verifies your data is kept private and secure. Think of it like a bank vault for your data—only your team has the key.
Can I Trust the Narratives Generated by the AI?
You can. The secret is data grounding. A trustworthy Conversational AI Data Analyst doesn’t just give you an answer from a black box; it always shows its work.
Every insight is directly traceable back to the raw data it came from. This transparency is everything. It means you can click on any part of the narrative, see the query used, and check the numbers yourself. This builds confidence in both the tool and your decisions.
How Is This Different from My Standard BI Dashboard?
A traditional BI dashboard is a rearview mirror—it’s great at showing you what happened. You get a page full of charts and are left to figure out the story on your own.
AI data storytelling is your forward-facing GPS. It doesn’t just show you what happened; it explains why it happened and can even suggest what to do next.
It automatically writes the narrative that explains what your charts mean.
It performs automated insight discovery to find trends you might have missed.
It allows for conversational follow-up questions, so you can dig deeper without writing code.
You're no longer just looking at static data points; you're having a conversation with your data.
Try asking Statspresso: "Why did our customer churn rate increase last month?"
It will give you both the chart and the story behind it, instantly. You get answers, not just data.
Ready to stop wrestling with dashboards and start a conversation with your data? Statspresso is a Conversational AI Data Analyst that helps you get answers in seconds. Connect your first data source for free and ask your first question.
You have data. Lots of it. From Shopify, HubSpot, and your own database. But staring at a spreadsheet of raw numbers is noise, not insight. Waiting weeks for a data analyst to build a dashboard is a relic of the past. AI data storytelling turns that chaos into a clear story, showing you what’s really happening in your business and what to do next.
It's time to skip the SQL. Just ask your data a question and get a chart in seconds.
Your Data Is Talking. Are You Listening?
For busy founders, product managers, and marketing leads, a two-week delay for a report means missed opportunities. You're sitting on a mountain of valuable data, but you don't have the time to learn SQL or fight with complicated BI tools. The answers to your most pressing questions are right there, locked behind a technical wall.
This is a classic growing pain. And AI data storytelling is the key to breaking down that wall.
From Data Noise to a Clear Story
AI data storytelling isn't here to replace your intuition; it's here to supercharge it with context, delivered in seconds. Think of it as a translator for your data. It quickly answers the three questions that actually matter:
What happened? It automatically analyzes your data to pinpoint significant changes.
Why did it happen? The AI digs deeper to generate insights that explain the root cause.
What should we do next? The story concludes with practical, data-backed recommendations.
A tool like Statspresso acts as your "Conversational AI Data Analyst," making this entire process feel effortless. Instead of writing code, you just ask questions.
Try asking Statspresso: "What was our monthly recurring revenue (MRR) growth over the last six months?"
You get a chart and a clear, written explanation. No SQL required. That's the power of putting AI data storytelling to work for your business.
What Is AI Data Storytelling, Exactly?
A traditional BI dashboard is like a paper map—it shows you where things are, but it won't tell you the best route or warn you about a traffic jam ahead.
AI data storytelling is your data GPS. It doesn’t just present a chart; it tells you what that chart means, why it looks that way, and what your next turn should be. You’re no longer left guessing why sales suddenly spiked.
The Three Core Components
AI data storytelling isn't magic; it’s a process that combines three key elements to give you the full picture.
Automated Data Analysis (The 'What'): The AI sifts through your data to automatically spot important trends, anomalies, and patterns.
Insight Generation (The 'Why'): The AI connects the dots between different data points to answer the crucial question: “Why did it happen?”
Natural Language Narration (The 'So What'): Finally, the AI translates those complex findings into a simple, clear narrative.
Instead of just a graph showing a sales bump, you get a story: 'Last month's sales jumped by 20%, driven by the new marketing campaign in EMEA.' This ability to create narratives shares roots with technologies like AI copywriting, which also focuses on generating human-like text.
From Raw Data to Actionable Narrative
The market agrees this is a massive step up. According to recent industry reports, the conversational analytics and GenBI market is projected to see explosive growth through 2026, as businesses race to adopt tools that provide instant insights. You can learn more about these AI data analysis trends on findanomaly.ai.
The real value isn't just seeing a number—it's understanding the story that number is telling.
For founders and managers, this means the end of long waits for data reports. With a Conversational AI Data Analyst like Statspresso, you bypass SQL queries and simply ask your data questions directly.
Try asking Statspresso: "Compare our user sign-ups this quarter to last quarter and explain any major differences."
This is what AI-driven conversational analytics is all about: turning complex data into clear answers that empower you to make confident decisions.
How Generative AI Turns Data Into a Conversation
For a long time, automated reporting was clunky. You’d get rigid, template-based summaries that often missed the bigger picture. But generative AI has completely changed the game, shifting data analysis from a one-way street into a dynamic, two-way conversation.
Modern GenAI—the technology that powers tools like Statspresso—doesn't just spit out pre-canned reports. It listens to your specific questions and crafts a unique story from your data, all while understanding the context of your business.
From Static Reports to Dynamic Dialogue
Think about the old workflow. An analyst would spend days pulling numbers and manually piecing together a story. Now, that process is instant.
When you ask a Conversational AI Data Analyst like Statspresso, "Which marketing channels had the best ROI last quarter?", you don't just get a bar chart. You get the whole story.
It explains what the chart means in simple English.
It anticipates your next question, suggesting follow-ups like, "Should we double down on our top-performing channel?"
It pulls out the most important takeaways so you know exactly what to do.
This back-and-forth makes conversational analytics so useful. You can dig deeper, explore a hunch, or pivot your analysis on the fly—all without writing a single line of SQL.
Generative AI isn't just about getting answers faster; it's about asking better questions. It guides you toward insights you might have otherwise missed.
This new dynamic is making waves. The market for generative AI is expected to skyrocket, with some analysts predicting it will reach nearly $100 billion by 2026. And it’s not just hype—a recent McKinsey survey revealed that 65% of organizations using this tech already see major revenue growth.
Getting Answers You Can Trust
Can you really trust a story told by an AI? The key is a concept called data grounding. Any reliable automated BI tool will always show its work.
Every insight it presents can be traced directly back to your source data. This transparency gets rid of the "black box" problem and builds the confidence you need to act.
Try asking Statspresso: "Summarize our new user growth from the last 30 days and highlight the top acquisition source."
In seconds, you get the chart, the numbers, and the narrative. This is how you skip the SQL and get straight from raw data to a smart decision.
Putting AI Data Storytelling Into Practice
Okay, enough theory. How does AI data storytelling actually work for a busy team lead who needs answers now? The whole point is to close the gap between having a question and getting a data-backed answer, without getting stuck in a queue for the analytics team.
This is where it all clicks. For a Marketing Lead, it means you can finally stop guessing which campaigns are driving real results. For a Product Manager, it’s about getting an instant read on user adoption. The true value is speed and accessibility.
From Question to Insight in Seconds
Let’s walk through a real-world scenario. You're a Product Manager who just pushed a new feature live. The old way? You’d file a ticket and hope for a report next week.
With a Conversational AI Data Analyst like Statspresso, the process is different. You just ask.
Try asking Statspresso: 'Show me user engagement for our new feature by customer segment.'
You get a clear chart showing exactly who is—and isn't—using the feature. The AI might add a narrative: “Engagement is highest among enterprise customers, but adoption among SMBs is lagging.” That’s an actionable insight, delivered instantly.
As the diagram shows, a simple question kicks off an automated analysis, which is then translated into a story anyone can understand. This shift toward automated BI is a big reason why 60% of repetitive data management tasks will be automated by 2027, freeing up teams to focus on strategy instead of report-building.
Data Analysis: The Old Way vs. The New Way
The contrast between the traditional approach and AI-driven storytelling is stark. We explore this shift in more detail in our guide to using AI for data analysis.
Let's look at the two methods side-by-side.
Task | The Old Way (Manual SQL) | The New Way (Statspresso) |
|---|---|---|
Get an Answer | Submit a ticket to the data team; wait days or weeks. | Ask a question in plain English; get an answer in seconds. |
Build a Chart | Hope an analyst has time to write SQL and build a viz. | Your chart is auto-generated alongside your answer. |
Find the "Why" | Schedule a meeting to interpret the report. | The AI explains the story behind the data with a clear narrative. |
This isn’t just about speed. It’s about changing how your organization interacts with data, creating a culture where anyone can confidently ask questions and get immediate, trustworthy answers.
Fostering a Culture of Curiosity, Not Confusion
Buying new software doesn't change anything. The real win comes when you change how your team interacts with data. AI data storytelling bridges that gap, moving your team from data confusion to genuine curiosity.
When anyone can ask their own questions and get immediate answers, the whole organization gets smarter. The goal is to make data feel less like a scary final exam and more like an open conversation.
Start Small, Win Big
The secret to a successful rollout isn't a top-down mandate. It’s about creating a "center of gravity" for data curiosity that naturally pulls others in.
Pick a Pilot Team: Start with one high-impact group, like marketing or sales.
Solve a Real Problem: Pinpoint their top 3-5 business questions. What numbers keep them up at night?
Build a Quick-Win Dashboard: Put together a simple, shared space that answers those specific questions.
This approach creates a safe space for exploration where there are no "dumb questions." You’re not just building dashboards; you’re breaking down data silos. By incorporating AI-powered knowledge management, you turn insights into a searchable library of narratives everyone can find and use.
When anyone on the team can ask a question and get a trusted answer in seconds, you're not just building reports; you're building confidence.
From Reactive Reports to Proactive Questions
This small change flips the script. Instead of your team waiting for a monthly report to see what already happened, they start asking proactive questions about what’s happening right now.
Think about a marketing manager checking campaign performance without filing a ticket.
They can just ask Statspresso: "Which of our Google Ads campaigns had the highest cost per acquisition this week?"
That's the power of having a Conversational AI Data Analyst on call 24/7. You shift from a slow, reactive culture to a fast, proactive one.
TL;DR: The Key Takeaways
Find the Story in the Data: AI data storytelling turns raw numbers from places like your Postgres database or Shopify store into a narrative that explains what’s going on.
Talk to Your Data, Don't Code: Ask complex questions in plain English and skip the SQL. It’s the fastest way to get from a question to an answer.
Empower Everyone: This isn't just for data scientists. Give your marketing, product, and sales teams the ability to make their own informed decisions.
Skip the SQL: The core benefit is speed. A Conversational AI Data Analyst like Statspresso lets you get a chart and an explanation in seconds, not days.
Frequently Asked Questions About AI Data Storytelling
Handing your data over to a new system is a big deal. It's natural to have questions. Here are straightforward answers to the concerns we hear most often.
Is My Data Secure When I Connect It to an AI Platform?
Yes. This is a non-negotiable for any reputable platform. Modern tools like Statspresso are built with enterprise-grade security from day one.
Your data is protected with end-to-end encryption and follows strict compliance standards like SOC 2, an independent audit that verifies your data is kept private and secure. Think of it like a bank vault for your data—only your team has the key.
Can I Trust the Narratives Generated by the AI?
You can. The secret is data grounding. A trustworthy Conversational AI Data Analyst doesn’t just give you an answer from a black box; it always shows its work.
Every insight is directly traceable back to the raw data it came from. This transparency is everything. It means you can click on any part of the narrative, see the query used, and check the numbers yourself. This builds confidence in both the tool and your decisions.
How Is This Different from My Standard BI Dashboard?
A traditional BI dashboard is a rearview mirror—it’s great at showing you what happened. You get a page full of charts and are left to figure out the story on your own.
AI data storytelling is your forward-facing GPS. It doesn’t just show you what happened; it explains why it happened and can even suggest what to do next.
It automatically writes the narrative that explains what your charts mean.
It performs automated insight discovery to find trends you might have missed.
It allows for conversational follow-up questions, so you can dig deeper without writing code.
You're no longer just looking at static data points; you're having a conversation with your data.
Try asking Statspresso: "Why did our customer churn rate increase last month?"
It will give you both the chart and the story behind it, instantly. You get answers, not just data.
Ready to stop wrestling with dashboards and start a conversation with your data? Statspresso is a Conversational AI Data Analyst that helps you get answers in seconds. Connect your first data source for free and ask your first question.