AI Dashboard Generator: No SQL, Just Ask (2026)

Waiting weeks for a data analyst to build a dashboard is a relic of the past. An AI dashboard generator is the new secret weapon for modern teams. It lets you create charts and find insights just by asking questions in plain English. It’s like having a Conversational AI Data Analyst on speed dial, ready to go whenever you are. You can finally stop waiting for data and start getting answers.
TL;DR: Key Takeaways
The Problem: Getting answers from your business data is slow. You file a ticket, wait for an analyst to write SQL, and get a report weeks later. It's a bottleneck.
The Solution: An AI dashboard generator acts as a Conversational AI Data Analyst. You just ask a question in plain English and get a chart in seconds.
How it Works: The AI uses Natural Language Processing (NLP) to understand your question and Generative AI to create the visual answer instantly.
Who Wins: Founders get a real-time pulse on the business. Product managers track feature adoption instantly. Marketing leads measure ROI on the fly.
What to Look For: Choose a tool with easy data connections, high conversational accuracy, and strong security. Your data's privacy is non-negotiable.
Stop Waiting for Data and Start Asking Questions
Every business has critical data tucked away in platforms like Shopify, Postgres, and HubSpot. But getting answers from that data is often slow and painful. You're stuck in a data backlog, unable to make the fast, informed decisions your business needs. This isn't just inefficient; it's a real competitive disadvantage.
The old way meant filing a ticket and waiting. The new way is a simple conversation.
The Old Data Bottleneck
For years, getting a new chart meant navigating a rigid, frustrating process:
Submit a request: First, you had to explain what you needed to a data analyst, hoping they understood your vision.
Wait in line: Your request would then disappear into a long queue, stuck behind dozens of other projects.
Get a static report: Days or even weeks later, you’d finally receive a dashboard that was probably outdated the moment it was finished.
This cycle kills momentum. By the time you get an answer, you’ve already moved on to the next fire. If you're starving for insights, you can learn more about how to transform your data with AI-powered data analytics dashboards.
The New Conversational Approach
An AI dashboard generator completely flips this script. Instead of wrestling with complex BI software, you just talk to your data. This is made possible by a Conversational AI Data Analyst like Statspresso, which understands what you're asking and fetches the answers instantly.
Skip the SQL. Just ask your data a question and get a chart in seconds.
Try asking Statspresso: "Show me my revenue by month for the last year as a bar chart."
This isn't just about speed. It's about empowering your entire team—from marketing leads to founders—to have a direct conversation with your data and get answers on demand.
No more waiting. No more bottlenecks. Just clarity.
How AI Dashboard Generators Actually Work
So, how do these tools work? It’s not black-box magic. Think of an AI dashboard generator as a ‘Conversational AI Data Analyst’—a new team member available 24/7.
At its heart, this technology is a powerful fusion of two key fields:
Natural Language Processing (NLP): This is the AI's ability to understand plain English, just like a human colleague.
Generative AI: This is the AI's ability to act. Once it understands your question, it creates the exact chart or report you need, whether that's a bar chart, a line graph, or a KPI summary.
Instead of building reports piece by piece, you just have a conversation.
From Simple Questions to Instant Charts
The whole process is refreshingly simple. It starts with securely connecting your data sources—maybe a Postgres database or your HubSpot account. This gives the AI read-only access, so it can see the data it needs.
Then, you just ask.
Try asking Statspresso: "Show me user sign-ups by country for Q1 as a pie chart."
The AI doesn't just see words; it understands intent. It knows you need a breakdown of new users, grouped by location, and filtered for a specific time. It then queries the database, pulls the numbers, and instantly picks the best visualization.
The old way forced you to wait. The new way empowers you to ask.
This shift from a passive, waiting game to an active, conversational workflow is what finally breaks the cycle of data backlogs.
The Technology Powering the Shift
This leap forward is tied to the explosion in Generative AI. It’s a market valued at over $66 billion in 2024 and projected to hit nearly $970 billion by 2032, according to a recent market analysis on generative AI's growth. This incredible growth is powered by architectures that are exceptionally good at turning text prompts into visual outputs—like the charts you need for your next meeting.
For busy leaders, this means tools like Statspresso can turn a simple question into a shareable dashboard without anyone touching code.
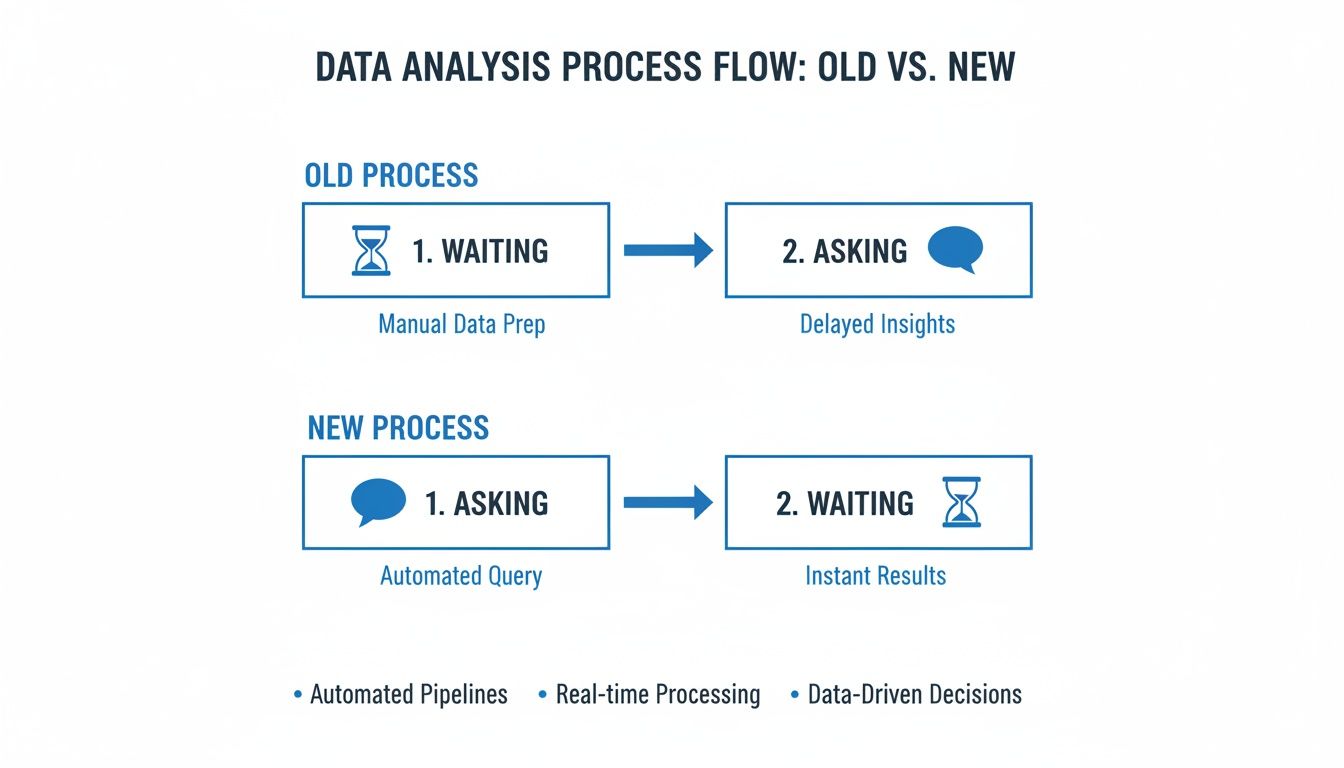
A Tale of Two Workflows: Traditional BI vs. The New AI Way
If you’ve ever been stuck in a data queue, you know the feeling. The difference between old-school business intelligence and the new AI-powered approach is like the difference between sending a letter and sending a text. It’s not just faster; it changes how you communicate with your data.
The traditional BI process was a marathon of manual steps. A business user had a question, filed a ticket, and waited. An analyst would then write complex SQL queries and wrestle data into a visualization using a tool like Tableau or Power BI. Weeks could pass. This created a culture where data was a precious, hard-to-get resource.
From Bottlenecks to Conversations
An AI dashboard generator, a true Conversational AI Data Analyst, turns this workflow on its head. It’s all about immediacy. Instead of waiting for an expert to translate your question into code, you simply ask the AI yourself.
This puts the power of data analysis directly into the hands of the people who need it most—the decision-makers.
The Old Way vs. The New Way
The table below breaks down the difference in workflow, time, and skills.
Aspect | Old Way (Manual SQL) | New Way (Statspresso) |
|---|---|---|
Time to Insight | Days or weeks. | Seconds. |
Skills Required | Deep expertise in SQL and complex BI tools. | The ability to ask a question. |
Workflow | Submit ticket > Wait for analyst > Analyst writes code > Review static chart. | Connect data > Ask a question > Get an interactive chart. |
Output | A static, quickly outdated report. | A live, interactive visualization you can add to a real-time dashboard. |
Accessibility | Limited to technical users. | Democratized across the entire team. |
As you can see, the new way collapses a complex process into a single, simple step.
Leaving the Data Bottleneck Behind for Good
This new model isn't about making your data analysts obsolete. It’s about elevating their role. By letting a Conversational AI Data Analyst handle the flood of routine questions ("What was our revenue last Tuesday?"), you free up your analysts for deep, strategic projects that move the needle.
It's about making data analysis feel as natural as a conversation.
More Than Just Faster Charts: The Real Wins of AI Dashboards
Sure, getting a chart in ten seconds is a massive win. But the real value of an AI dashboard generator goes deeper. It’s about changing how your company interacts with its data.
The biggest shift is data democratization. For years, business insights were locked away, accessible only to those who could speak SQL. Tools like Statspresso, a Conversational AI Data Analyst, act as a universal translator, breaking down those walls. Suddenly, anyone can ask questions and get answers, building a culture where decisions are driven by evidence.
This shift isn't just a trend; it's a fundamental change in how businesses operate, as explored in this article on AI in Cross-Channel Reporting Key Benefits.
Uncover Hidden Patterns and Make Decisions with Confidence
Another powerful advantage is the AI's knack for finding hidden patterns. These tools can proactively flag anomalies or correlations a human might miss. It could be a subtle drop in user engagement after a feature update or a surprising sales spike from a new market.
This leads directly to improved decision confidence. When you ask a question, the answer is built directly from your trusted data sources, whether that's Google Ads, Stripe, or your own database. No more guesswork.
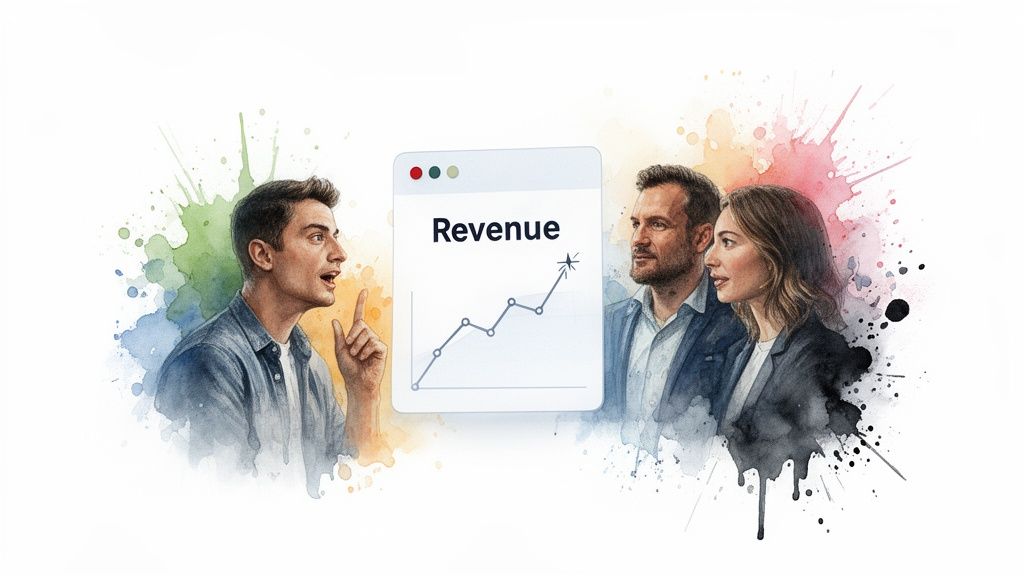
Imagine a founder pulling up daily revenue trends minutes before a board meeting. Or a marketing manager checking campaign ROI on the fly. This isn’t just reporting; it's a real-time conversation with your business.
Experience the Difference Firsthand
The best way to grasp the impact is to try it. Skip the SQL. Just ask your data a question and get a chart in seconds.
Connect your data: Hook up sources like Stripe, Postgres, or Shopify.
Ask a question: Use plain English, just like you're talking to a colleague.
Get an answer: Receive a clear, accurate chart in seconds.
Try asking Statspresso: "Compare monthly recurring revenue from Stripe for this year vs last year as a line chart."
This move from manual labor to direct conversation doesn't just make your team faster. It makes your entire organization smarter.
How Different Teams Use AI for Data Insights
An AI dashboard generator isn't a one-size-fits-all solution. Its magic comes to life when different teams use it to tackle their own problems.
The beauty of a tool like Statspresso, which functions as a Conversational AI Data Analyst, is how it adapts. A marketing lead can plug in HubSpot data, a product manager can connect to their analytics, and an engineer can link a Postgres database. Suddenly, everyone gets role-specific insights.
For Founders and Executives
As a founder, you need a constant, real-time pulse on the business. You don't have time to wait for reports. Your questions are big-picture, and the answers are needed now. A conversational AI tool gives you that immediate clarity.
You can skip the SQL. Just ask your data a direct question and get a chart in seconds.
Financial Health: Keep a close eye on cash flow and revenue trends.
Product Performance: Instantly spot which products are fueling growth.
Customer Acquisition: Figure out which channels bring in your most valuable customers.
This direct line to your data means you can walk into any meeting armed with up-to-the-minute numbers.
Try asking Statspresso: "What are my top 5 products by revenue this month, and how does that compare to last month?"
For Product Managers
Product managers live and breathe user engagement. You’re always wondering if a new feature is working. Waiting for an analyst to pull logs isn't an option.
An AI dashboard generator plugs right into your product analytics, creating an instant feedback loop.
Try asking Statspresso: "Show me the daily active users for the new checkout flow since launch as a line chart."
This allows you to monitor feature adoption as it happens and measure the true impact of your releases without writing code.
For Marketing Leads
Marketing is a numbers game. You're juggling campaigns and need to know what’s working—right now. Getting a single view of performance can be a nightmare.
By connecting sources like HubSpot and Google Analytics to a Conversational AI Data Analyst, you can finally solve this. It becomes effortless to measure ROI and shift your budget based on what the data is telling you.
Try asking Statspresso: "What was the conversion rate from our latest Google Ads campaign, broken down by ad group?"
This simple question replaces hours of wrestling with CSVs. You get an answer in seconds and get back to growing the business.
Choosing the Right AI Dashboard Generator
Not all AI tools are created equal. Picking the right AI dashboard generator is a high-stakes decision. The wrong one adds complexity; the right one is like hiring a brilliant, fast data analyst. The goal is to go from signing up to real insight in minutes.
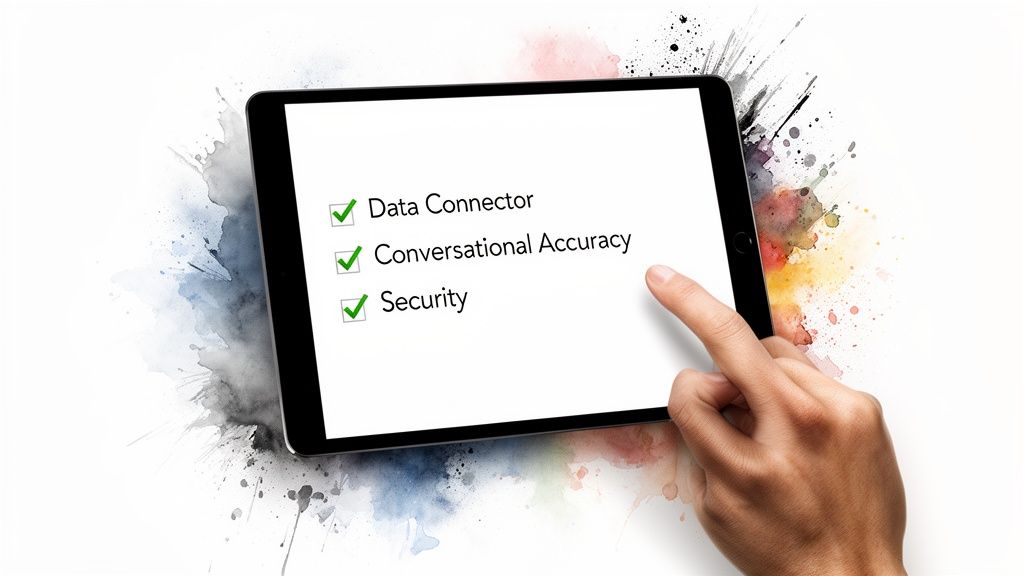
Your AI Buyer's Checklist
Before you commit, run any platform through this essential checklist.
Data Connector Quality: This is non-negotiable. Does the tool connect seamlessly to your apps—like Postgres, Shopify, or HubSpot—with a few clicks? If integration is a headache, it's a non-starter.
Conversational Accuracy: How well does it understand real-world business questions? A great tool handles nuance, like "Compare sales from our top 3 products this quarter to last quarter." A weak one gets confused.
Security and Trust: How does it handle your data? Look for tools with read-only connections, encryption, and a policy of not storing your raw data. Your data privacy is paramount.
Collaboration Features: Can you easily share insights, build dashboards, or use features like embedded analytics? Putting data directly into other platforms is a game-changer. You can dig into what embedded analytics is and see how it amplifies your data's reach.
The best choice grows with you. Find a platform that lets you stop wrestling with software and start having a conversation with your data.
Frequently Asked Questions
If you’re curious about how an AI dashboard generator might fit into your business, you're not alone. Here are straightforward answers to common questions.
Is It Secure for My Company Data?
Yes, provided you choose a reputable tool. Security is core to their design. Leading platforms use read-only permissions to connect to your data. Think of it as a library card—they can read the books but can't write in them. Your original data is never changed. All data is encrypted, and top tools don't hold onto your raw data long-term.
Can This Replace My Data Analyst?
It's less about replacement and more about elevation. A Conversational AI Data Analyst like Statspresso acts as a powerful assistant for your data team. It handles the repetitive, ad-hoc questions that bog down an analyst's day. This frees up your experts for the bigger, strategic challenges. And for teams without an analyst? It gives everyone the power to find their own answers.
How Accurate Are the AI-Generated Charts?
The charts are extremely accurate because the AI isn't making up numbers—it’s visualizing your own data. A reliable Conversational AI Data Analyst like Statspresso ties every answer directly to your connected sources. When you ask a question, the AI translates it into a precise query, runs it against your data, and builds the right visualization. This process actually eliminates the risk of human error from manual SQL coding.
Try asking Statspresso: "How many new users did we get from Shopify last month?"
What Kind of Data Sources Can I Connect?
Modern automated BI tools are designed for flexibility. You can connect a host of common business systems, including:
SQL Databases like Postgres and MySQL
Data Warehouses such as Snowflake
SaaS Applications like Shopify, HubSpot, Stripe, and Google Analytics
The best platforms provide one-click connectors, making it easy to get a complete view of the business without a massive engineering project.
Ready to stop waiting for answers? With Statspresso, you can skip the SQL.
Connect your first data source for free and ask your first question.
Waiting weeks for a data analyst to build a dashboard is a relic of the past. An AI dashboard generator is the new secret weapon for modern teams. It lets you create charts and find insights just by asking questions in plain English. It’s like having a Conversational AI Data Analyst on speed dial, ready to go whenever you are. You can finally stop waiting for data and start getting answers.
TL;DR: Key Takeaways
The Problem: Getting answers from your business data is slow. You file a ticket, wait for an analyst to write SQL, and get a report weeks later. It's a bottleneck.
The Solution: An AI dashboard generator acts as a Conversational AI Data Analyst. You just ask a question in plain English and get a chart in seconds.
How it Works: The AI uses Natural Language Processing (NLP) to understand your question and Generative AI to create the visual answer instantly.
Who Wins: Founders get a real-time pulse on the business. Product managers track feature adoption instantly. Marketing leads measure ROI on the fly.
What to Look For: Choose a tool with easy data connections, high conversational accuracy, and strong security. Your data's privacy is non-negotiable.
Stop Waiting for Data and Start Asking Questions
Every business has critical data tucked away in platforms like Shopify, Postgres, and HubSpot. But getting answers from that data is often slow and painful. You're stuck in a data backlog, unable to make the fast, informed decisions your business needs. This isn't just inefficient; it's a real competitive disadvantage.
The old way meant filing a ticket and waiting. The new way is a simple conversation.
The Old Data Bottleneck
For years, getting a new chart meant navigating a rigid, frustrating process:
Submit a request: First, you had to explain what you needed to a data analyst, hoping they understood your vision.
Wait in line: Your request would then disappear into a long queue, stuck behind dozens of other projects.
Get a static report: Days or even weeks later, you’d finally receive a dashboard that was probably outdated the moment it was finished.
This cycle kills momentum. By the time you get an answer, you’ve already moved on to the next fire. If you're starving for insights, you can learn more about how to transform your data with AI-powered data analytics dashboards.
The New Conversational Approach
An AI dashboard generator completely flips this script. Instead of wrestling with complex BI software, you just talk to your data. This is made possible by a Conversational AI Data Analyst like Statspresso, which understands what you're asking and fetches the answers instantly.
Skip the SQL. Just ask your data a question and get a chart in seconds.
Try asking Statspresso: "Show me my revenue by month for the last year as a bar chart."
This isn't just about speed. It's about empowering your entire team—from marketing leads to founders—to have a direct conversation with your data and get answers on demand.
No more waiting. No more bottlenecks. Just clarity.
How AI Dashboard Generators Actually Work
So, how do these tools work? It’s not black-box magic. Think of an AI dashboard generator as a ‘Conversational AI Data Analyst’—a new team member available 24/7.
At its heart, this technology is a powerful fusion of two key fields:
Natural Language Processing (NLP): This is the AI's ability to understand plain English, just like a human colleague.
Generative AI: This is the AI's ability to act. Once it understands your question, it creates the exact chart or report you need, whether that's a bar chart, a line graph, or a KPI summary.
Instead of building reports piece by piece, you just have a conversation.
From Simple Questions to Instant Charts
The whole process is refreshingly simple. It starts with securely connecting your data sources—maybe a Postgres database or your HubSpot account. This gives the AI read-only access, so it can see the data it needs.
Then, you just ask.
Try asking Statspresso: "Show me user sign-ups by country for Q1 as a pie chart."
The AI doesn't just see words; it understands intent. It knows you need a breakdown of new users, grouped by location, and filtered for a specific time. It then queries the database, pulls the numbers, and instantly picks the best visualization.
The old way forced you to wait. The new way empowers you to ask.
This shift from a passive, waiting game to an active, conversational workflow is what finally breaks the cycle of data backlogs.
The Technology Powering the Shift
This leap forward is tied to the explosion in Generative AI. It’s a market valued at over $66 billion in 2024 and projected to hit nearly $970 billion by 2032, according to a recent market analysis on generative AI's growth. This incredible growth is powered by architectures that are exceptionally good at turning text prompts into visual outputs—like the charts you need for your next meeting.
For busy leaders, this means tools like Statspresso can turn a simple question into a shareable dashboard without anyone touching code.
A Tale of Two Workflows: Traditional BI vs. The New AI Way
If you’ve ever been stuck in a data queue, you know the feeling. The difference between old-school business intelligence and the new AI-powered approach is like the difference between sending a letter and sending a text. It’s not just faster; it changes how you communicate with your data.
The traditional BI process was a marathon of manual steps. A business user had a question, filed a ticket, and waited. An analyst would then write complex SQL queries and wrestle data into a visualization using a tool like Tableau or Power BI. Weeks could pass. This created a culture where data was a precious, hard-to-get resource.
From Bottlenecks to Conversations
An AI dashboard generator, a true Conversational AI Data Analyst, turns this workflow on its head. It’s all about immediacy. Instead of waiting for an expert to translate your question into code, you simply ask the AI yourself.
This puts the power of data analysis directly into the hands of the people who need it most—the decision-makers.
The Old Way vs. The New Way
The table below breaks down the difference in workflow, time, and skills.
Aspect | Old Way (Manual SQL) | New Way (Statspresso) |
|---|---|---|
Time to Insight | Days or weeks. | Seconds. |
Skills Required | Deep expertise in SQL and complex BI tools. | The ability to ask a question. |
Workflow | Submit ticket > Wait for analyst > Analyst writes code > Review static chart. | Connect data > Ask a question > Get an interactive chart. |
Output | A static, quickly outdated report. | A live, interactive visualization you can add to a real-time dashboard. |
Accessibility | Limited to technical users. | Democratized across the entire team. |
As you can see, the new way collapses a complex process into a single, simple step.
Leaving the Data Bottleneck Behind for Good
This new model isn't about making your data analysts obsolete. It’s about elevating their role. By letting a Conversational AI Data Analyst handle the flood of routine questions ("What was our revenue last Tuesday?"), you free up your analysts for deep, strategic projects that move the needle.
It's about making data analysis feel as natural as a conversation.
More Than Just Faster Charts: The Real Wins of AI Dashboards
Sure, getting a chart in ten seconds is a massive win. But the real value of an AI dashboard generator goes deeper. It’s about changing how your company interacts with its data.
The biggest shift is data democratization. For years, business insights were locked away, accessible only to those who could speak SQL. Tools like Statspresso, a Conversational AI Data Analyst, act as a universal translator, breaking down those walls. Suddenly, anyone can ask questions and get answers, building a culture where decisions are driven by evidence.
This shift isn't just a trend; it's a fundamental change in how businesses operate, as explored in this article on AI in Cross-Channel Reporting Key Benefits.
Uncover Hidden Patterns and Make Decisions with Confidence
Another powerful advantage is the AI's knack for finding hidden patterns. These tools can proactively flag anomalies or correlations a human might miss. It could be a subtle drop in user engagement after a feature update or a surprising sales spike from a new market.
This leads directly to improved decision confidence. When you ask a question, the answer is built directly from your trusted data sources, whether that's Google Ads, Stripe, or your own database. No more guesswork.
Imagine a founder pulling up daily revenue trends minutes before a board meeting. Or a marketing manager checking campaign ROI on the fly. This isn’t just reporting; it's a real-time conversation with your business.
Experience the Difference Firsthand
The best way to grasp the impact is to try it. Skip the SQL. Just ask your data a question and get a chart in seconds.
Connect your data: Hook up sources like Stripe, Postgres, or Shopify.
Ask a question: Use plain English, just like you're talking to a colleague.
Get an answer: Receive a clear, accurate chart in seconds.
Try asking Statspresso: "Compare monthly recurring revenue from Stripe for this year vs last year as a line chart."
This move from manual labor to direct conversation doesn't just make your team faster. It makes your entire organization smarter.
How Different Teams Use AI for Data Insights
An AI dashboard generator isn't a one-size-fits-all solution. Its magic comes to life when different teams use it to tackle their own problems.
The beauty of a tool like Statspresso, which functions as a Conversational AI Data Analyst, is how it adapts. A marketing lead can plug in HubSpot data, a product manager can connect to their analytics, and an engineer can link a Postgres database. Suddenly, everyone gets role-specific insights.
For Founders and Executives
As a founder, you need a constant, real-time pulse on the business. You don't have time to wait for reports. Your questions are big-picture, and the answers are needed now. A conversational AI tool gives you that immediate clarity.
You can skip the SQL. Just ask your data a direct question and get a chart in seconds.
Financial Health: Keep a close eye on cash flow and revenue trends.
Product Performance: Instantly spot which products are fueling growth.
Customer Acquisition: Figure out which channels bring in your most valuable customers.
This direct line to your data means you can walk into any meeting armed with up-to-the-minute numbers.
Try asking Statspresso: "What are my top 5 products by revenue this month, and how does that compare to last month?"
For Product Managers
Product managers live and breathe user engagement. You’re always wondering if a new feature is working. Waiting for an analyst to pull logs isn't an option.
An AI dashboard generator plugs right into your product analytics, creating an instant feedback loop.
Try asking Statspresso: "Show me the daily active users for the new checkout flow since launch as a line chart."
This allows you to monitor feature adoption as it happens and measure the true impact of your releases without writing code.
For Marketing Leads
Marketing is a numbers game. You're juggling campaigns and need to know what’s working—right now. Getting a single view of performance can be a nightmare.
By connecting sources like HubSpot and Google Analytics to a Conversational AI Data Analyst, you can finally solve this. It becomes effortless to measure ROI and shift your budget based on what the data is telling you.
Try asking Statspresso: "What was the conversion rate from our latest Google Ads campaign, broken down by ad group?"
This simple question replaces hours of wrestling with CSVs. You get an answer in seconds and get back to growing the business.
Choosing the Right AI Dashboard Generator
Not all AI tools are created equal. Picking the right AI dashboard generator is a high-stakes decision. The wrong one adds complexity; the right one is like hiring a brilliant, fast data analyst. The goal is to go from signing up to real insight in minutes.
Your AI Buyer's Checklist
Before you commit, run any platform through this essential checklist.
Data Connector Quality: This is non-negotiable. Does the tool connect seamlessly to your apps—like Postgres, Shopify, or HubSpot—with a few clicks? If integration is a headache, it's a non-starter.
Conversational Accuracy: How well does it understand real-world business questions? A great tool handles nuance, like "Compare sales from our top 3 products this quarter to last quarter." A weak one gets confused.
Security and Trust: How does it handle your data? Look for tools with read-only connections, encryption, and a policy of not storing your raw data. Your data privacy is paramount.
Collaboration Features: Can you easily share insights, build dashboards, or use features like embedded analytics? Putting data directly into other platforms is a game-changer. You can dig into what embedded analytics is and see how it amplifies your data's reach.
The best choice grows with you. Find a platform that lets you stop wrestling with software and start having a conversation with your data.
Frequently Asked Questions
If you’re curious about how an AI dashboard generator might fit into your business, you're not alone. Here are straightforward answers to common questions.
Is It Secure for My Company Data?
Yes, provided you choose a reputable tool. Security is core to their design. Leading platforms use read-only permissions to connect to your data. Think of it as a library card—they can read the books but can't write in them. Your original data is never changed. All data is encrypted, and top tools don't hold onto your raw data long-term.
Can This Replace My Data Analyst?
It's less about replacement and more about elevation. A Conversational AI Data Analyst like Statspresso acts as a powerful assistant for your data team. It handles the repetitive, ad-hoc questions that bog down an analyst's day. This frees up your experts for the bigger, strategic challenges. And for teams without an analyst? It gives everyone the power to find their own answers.
How Accurate Are the AI-Generated Charts?
The charts are extremely accurate because the AI isn't making up numbers—it’s visualizing your own data. A reliable Conversational AI Data Analyst like Statspresso ties every answer directly to your connected sources. When you ask a question, the AI translates it into a precise query, runs it against your data, and builds the right visualization. This process actually eliminates the risk of human error from manual SQL coding.
Try asking Statspresso: "How many new users did we get from Shopify last month?"
What Kind of Data Sources Can I Connect?
Modern automated BI tools are designed for flexibility. You can connect a host of common business systems, including:
SQL Databases like Postgres and MySQL
Data Warehouses such as Snowflake
SaaS Applications like Shopify, HubSpot, Stripe, and Google Analytics
The best platforms provide one-click connectors, making it easy to get a complete view of the business without a massive engineering project.
Ready to stop waiting for answers? With Statspresso, you can skip the SQL.
Connect your first data source for free and ask your first question.