Ad Hoc Reporting Tools: Get Answers Fast (2026)

Waiting weeks for a data analyst to build a dashboard is a relic of the past. You have a simple question about your business, but the answer is locked away in a dashboard that just won't cooperate. You’re not alone. The solution isn’t another complicated dashboard; it’s an ad hoc reporting tool. Think of it as having a Conversational AI Data Analyst on standby, ready to answer your specific, one-off questions the moment you have them.
This guide will show you how to break free from the data bottleneck and start getting answers in seconds.
TL;DR: Key Takeaways
Problem: Your data is stuck. Waiting for analysts to build reports for every small question is slow and kills momentum.
Solution: An ad hoc reporting tool lets you ask specific, one-off questions and get instant answers without needing a data expert.
The Big Shift: The best tools now use conversational AI. This means you can just ask questions in plain English.
The Bottom Line: Statspresso is a Conversational AI Data Analyst. You can skip the SQL, ask your data a question, and get a chart in seconds.
Why Your Business Data Is Trapped in a Bottleneck
For most founders and managers, the biggest frustration is having tons of data but no easy way to get quick answers from it. Waiting days for a report on last month's customer churn is a massive slowdown—a delay your business can't afford.

You know the drill. You file a ticket with the data team, your request lands in a long queue, and you cross your fingers. This old model is broken. Modern teams need to move fast, and that means getting answers now, not next Tuesday.
The Escape from Report Requests
This is where ad hoc reporting tools change the game. They're built to break this cycle of waiting by letting anyone on the team—not just data experts—explore data and find answers. It’s a shift from staring at static reports to having a dynamic, interactive conversation with your data.
A Conversational AI Data Analyst like Statspresso lets you skip the SQL and just ask your data a question to get a chart in seconds.
What Exactly Is an Ad Hoc Reporting Tool?
Ever been in a meeting when a totally unexpected question about your data comes up? Someone asks something you hadn't planned for, and your standard dashboard just stares back blankly. That’s the exact problem ad hoc reporting tools solve.
The term “ad hoc” literally means "for this specific purpose." These tools let you ask one-off, specific questions and get immediate answers by building a report on the fly.

Think of it this way: a standard dashboard is like a restaurant's set menu. It’s great for your regular orders—the key metrics you track daily. But an ad hoc reporting tool is your personal chef, ready to whip up a custom dish based on a sudden craving.
Beyond Static Dashboards
Most teams are used to "canned" reports. They're pre-built by an analyst and are great for routine monitoring, but they are totally inflexible. Ad hoc reporting software breaks you out of that rigid structure.
It’s a game-changer. Instead of being stuck with pre-approved metrics, you get the freedom to explore. You can connect directly to your data sources—whether that's Postgres, Shopify, or HubSpot—and follow a hunch.
For example, a product manager might notice a dip in user retention. With an ad hoc tool, they can instantly dig in.
Try asking Statspresso: "Show me the user drop-off rate for each step in our onboarding flow last week as a funnel chart."
The Conversational Advantage
The best modern tools take this a step further. Forget complex drag-and-drop builders. A Conversational AI Data Analyst like Statspresso allows anyone on your team to simply ask questions in plain English. This puts powerful data analysis into the hands of marketers, product managers, and sales leaders. They become self-sufficient, finding answers in seconds.
The core benefit is simple: Skip the SQL. Just ask your data a question and get a chart in seconds.
The Old Way vs. The New Way of Getting Answers
If you’ve ever worked in a business role, you know the feeling. You have a critical, time-sensitive question, but the answer is locked in a database. Getting it out feels like an uphill battle.
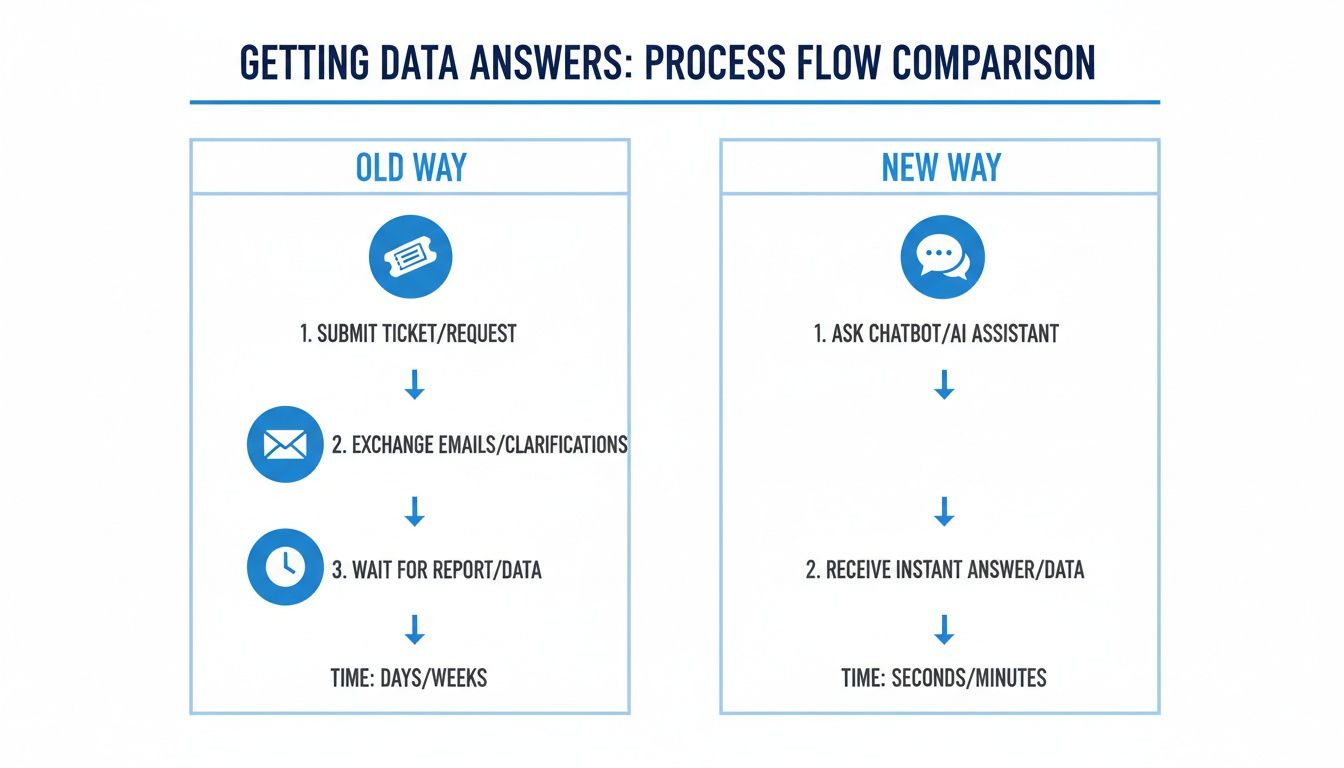
The old way was a masterclass in friction. It started with a formal request, then came the inevitable back-and-forth with a busy data analyst. Days—or even weeks—would crawl by. By then, the opportunity might have passed.
From Waiting Weeks to Getting Answers in Seconds
This is where a modern ad hoc reporting tool changes everything. The new approach is built for speed and curiosity. This is the essence of true self-serve business intelligence, a model where you’re no longer a bystander waiting for insights.
Imagine you’re a product manager scratching your head over a feature's poor adoption. Instead of drafting a ticket, you turn to a conversational AI data analyst like Statspresso and just ask.
Try asking Statspresso: "Compare the number of active users for Feature A versus Feature B over the last 30 days."
Within seconds, you have a chart. No queues, no email threads, no waiting. This isn’t just a minor improvement; it's a fundamental shift in how teams operate.
Data Reporting Showdown: Manual SQL vs. Conversational AI
Metric | The Old Way (Manual SQL & BI Queues) | The New Way (Statspresso) |
|---|---|---|
Time to Answer | Days or even weeks | Seconds |
Required Skill | Deep SQL knowledge or an analyst | The ability to ask a question in English |
Process | File a ticket, wait in line, clarify, get a static report | Ask a question, get an interactive chart instantly |
Result | Slow, reactive decisions on stale data | Fast, confident decisions on live data |
The new way empowers anyone on your team to make smarter decisions, faster. Skip the SQL. Just ask your data a question and get a chart in seconds.
Core Features Every Great Ad Hoc Reporting Tool Needs
Finding the right ad hoc reporting tool can feel overwhelming. The market is booming for a reason—Gartner predicts that by 2026, generative AI will significantly reduce the need for technical skills to work with data. Businesses are tired of waiting on IT and want answers now.
To cut through the noise, you need to know what features truly make a difference. Let's break down the non-negotiables.
Seamless Data Connectivity
First, the basics. If you can't easily connect your data, the tool is a non-starter. A great ad hoc tool should connect to your everyday sources—think Postgres, HubSpot, or Google Analytics—in minutes. The initial setup should be a one-and-done affair.
Pre-built connectors for the apps you already use.
A painless authentication process that doesn't require a technical manual.
The ability to ask your first question almost immediately.
An Intuitive Interface for Everyone
This is where the promise of self-service often falls apart. Many tools have clunky drag-and-drop builders with a steep learning curve. The ideal interface should feel less like operating complex software and more like having a conversation. That’s the idea behind a Conversational AI Data Analyst like Statspresso. Instead of building a query, you just ask a question.
Try asking Statspresso: "Show me our monthly recurring revenue (MRR) growth for the past 6 months."
Powerful and Instant Visualization
A screen full of raw numbers doesn't tell a story. A useful tool automatically translates your data into clear charts and graphs. The right tool completely changes the dynamic, turning a long wait into an immediate answer.
The difference is night and day. The old way means filing a ticket and hoping. The new way is asking a question and getting your answer on the spot.
Effortless Collaboration and Sharing
An insight is useless if it stays siloed on your dashboard. A modern ad hoc reporting tool must make sharing simple. Look for the ability to send findings with a direct link or push an update straight to a Slack channel. The goal is to move from data to decision. For a detailed list of what to look for, some great points are made in this article on the core features of an ad hoc reporting tool.
Putting Ad Hoc Reporting to Work: Real Use Cases
Theory is nice, but results matter. The value of a good ad hoc reporting tool is how it solves real business problems. Let's look at a few practical scenarios.

For the Marketing Lead Proving ROI
You just finished a big campaign, and the CEO wants to know which channels paid off. Your standard dashboard shows total leads but not which ones brought in the highest-value customers. Instead of waiting for an analyst, you turn to your Conversational AI Data Analyst.
Try asking Statspresso: “What was our customer lifetime value by acquisition source for customers who signed up in Q2? Show me as a bar chart.”
In seconds, a chart appears. It shows that while Google Ads drove the most signups, customers from podcast sponsorships have 2x the LTV. You just found your most profitable channel without writing any code.
For the Product Manager Plugging a Leaky Funnel
Your analytics flag a big drop-off in the user onboarding flow. You have a hunch but can't be sure without data. This is a classic ad hoc analysis situation.
Try asking Statspresso: “Show me the drop-off rate for each step in our onboarding flow last week as a funnel chart.”
The tool instantly generates a funnel visualization, revealing a glaring issue: 73% of users abandon the process when asked to invite teammates. You just turned a vague problem into an actionable solution.
For the Founder Needing a Real-Time Pulse
You have a board meeting in an hour. You need the latest financial snapshot, and the monthly report is already two weeks old.
Try asking Statspresso: “What is our MRR growth month-over-month for the last year?”
Instantly, you get a line chart. You can follow up with, "Compare it to our churn rate over the same period," and get a second chart. You can walk into that meeting with confidence, armed with up-to-the-minute answers.
How to Choose the Right Ad Hoc Reporting Tool
Alright, you know you need a better way to get answers. The problem is, the market is a sea of options. How do you find the one that actually works for your team?
This isn't about finding the tool with the longest feature list. It’s about finding the one that removes the friction between a question and a data-backed answer.
Ask These Three Questions to Find Your Fit
To cut through the marketing jargon, boil the decision down to three practical questions. As you look at options, from conversational analytics tools to more traditional report automation tools for enterprises, keep these in mind.
Who is this actually built for? Is it for a data analyst who speaks SQL, or for a marketing lead who needs to understand campaign performance? If your goal is to empower the whole business team, a zero-code interface is non-negotiable.
How fast can we get our first answer? Your team has questions now, not next quarter. Look for a tool you can connect and use in minutes. If a tool requires weeks of engineering support, it’s creating the bottleneck you’re trying to eliminate.
What’s the real commitment? Are you being pushed into a long-term contract before you've even seen if it works? Or can you start with a free trial to prove its value?
The Right Choice for a Fast-Moving Team
For teams that can't afford to wait, the answers point toward a new breed of tool. This is where a Conversational AI Data Analyst like Statspresso comes in. It’s built for the entire business team, connects to your database in minutes, and has a flexible model for fast-growing companies.
The goal is simple: Skip the SQL. Just ask your data a question and get a chart in seconds. The right ad hoc reporting tool makes this possible.
Frequently Asked Questions About Ad Hoc Reporting
When teams start looking into ad hoc reporting, the same questions almost always come up. Let's tackle the big ones.
Does an Ad Hoc Tool Replace My Existing Dashboards?
Not at all. Think of it as a companion. Your dashboards are for checking essentials at a glance. An ad hoc reporting tool is your GPS for investigating unexpected roadblocks and asking one-off questions.
A Conversational AI Data Analyst like Statspresso fits perfectly into this workflow. You can freely ask questions and dig into anomalies. When you find something important, you can add that new insight to a permanent dashboard.
Do I Need to Be a Data Expert to Use These Tools?
It completely depends on the tool. Older BI tools often have a steep learning curve. The newer generation of conversational tools, however, is designed for business users, not just analysts.
With Statspresso, if you can ask a question in English, you can get insights. The whole point is to tear down the technical barriers so you can focus on your business. More traditional BI is covered in this great analysis from Ajelix.com.
How Secure Is Connecting Our Database to a Third-Party Tool?
Security should be your top priority. Any serious ad hoc reporting platform will use industry-standard protections like end-to-end encryption. But here’s the most critical feature to look for: read-only access. This guarantees the tool can never change, delete, or write to your original database. It's like giving someone a copy of a book to read instead of handing them a pen and the original manuscript. Always ask for security documentation and check for compliance certifications like SOC 2.
Ready to stop waiting in line and start getting answers? Connect your first data source for free and ask your first question. With Statspresso, you can skip the SQL and get a chart in seconds. Try it now at https://www.statspresso.com.
Waiting weeks for a data analyst to build a dashboard is a relic of the past. You have a simple question about your business, but the answer is locked away in a dashboard that just won't cooperate. You’re not alone. The solution isn’t another complicated dashboard; it’s an ad hoc reporting tool. Think of it as having a Conversational AI Data Analyst on standby, ready to answer your specific, one-off questions the moment you have them.
This guide will show you how to break free from the data bottleneck and start getting answers in seconds.
TL;DR: Key Takeaways
Problem: Your data is stuck. Waiting for analysts to build reports for every small question is slow and kills momentum.
Solution: An ad hoc reporting tool lets you ask specific, one-off questions and get instant answers without needing a data expert.
The Big Shift: The best tools now use conversational AI. This means you can just ask questions in plain English.
The Bottom Line: Statspresso is a Conversational AI Data Analyst. You can skip the SQL, ask your data a question, and get a chart in seconds.
Why Your Business Data Is Trapped in a Bottleneck
For most founders and managers, the biggest frustration is having tons of data but no easy way to get quick answers from it. Waiting days for a report on last month's customer churn is a massive slowdown—a delay your business can't afford.
You know the drill. You file a ticket with the data team, your request lands in a long queue, and you cross your fingers. This old model is broken. Modern teams need to move fast, and that means getting answers now, not next Tuesday.
The Escape from Report Requests
This is where ad hoc reporting tools change the game. They're built to break this cycle of waiting by letting anyone on the team—not just data experts—explore data and find answers. It’s a shift from staring at static reports to having a dynamic, interactive conversation with your data.
A Conversational AI Data Analyst like Statspresso lets you skip the SQL and just ask your data a question to get a chart in seconds.
What Exactly Is an Ad Hoc Reporting Tool?
Ever been in a meeting when a totally unexpected question about your data comes up? Someone asks something you hadn't planned for, and your standard dashboard just stares back blankly. That’s the exact problem ad hoc reporting tools solve.
The term “ad hoc” literally means "for this specific purpose." These tools let you ask one-off, specific questions and get immediate answers by building a report on the fly.
Think of it this way: a standard dashboard is like a restaurant's set menu. It’s great for your regular orders—the key metrics you track daily. But an ad hoc reporting tool is your personal chef, ready to whip up a custom dish based on a sudden craving.
Beyond Static Dashboards
Most teams are used to "canned" reports. They're pre-built by an analyst and are great for routine monitoring, but they are totally inflexible. Ad hoc reporting software breaks you out of that rigid structure.
It’s a game-changer. Instead of being stuck with pre-approved metrics, you get the freedom to explore. You can connect directly to your data sources—whether that's Postgres, Shopify, or HubSpot—and follow a hunch.
For example, a product manager might notice a dip in user retention. With an ad hoc tool, they can instantly dig in.
Try asking Statspresso: "Show me the user drop-off rate for each step in our onboarding flow last week as a funnel chart."
The Conversational Advantage
The best modern tools take this a step further. Forget complex drag-and-drop builders. A Conversational AI Data Analyst like Statspresso allows anyone on your team to simply ask questions in plain English. This puts powerful data analysis into the hands of marketers, product managers, and sales leaders. They become self-sufficient, finding answers in seconds.
The core benefit is simple: Skip the SQL. Just ask your data a question and get a chart in seconds.
The Old Way vs. The New Way of Getting Answers
If you’ve ever worked in a business role, you know the feeling. You have a critical, time-sensitive question, but the answer is locked in a database. Getting it out feels like an uphill battle.
The old way was a masterclass in friction. It started with a formal request, then came the inevitable back-and-forth with a busy data analyst. Days—or even weeks—would crawl by. By then, the opportunity might have passed.
From Waiting Weeks to Getting Answers in Seconds
This is where a modern ad hoc reporting tool changes everything. The new approach is built for speed and curiosity. This is the essence of true self-serve business intelligence, a model where you’re no longer a bystander waiting for insights.
Imagine you’re a product manager scratching your head over a feature's poor adoption. Instead of drafting a ticket, you turn to a conversational AI data analyst like Statspresso and just ask.
Try asking Statspresso: "Compare the number of active users for Feature A versus Feature B over the last 30 days."
Within seconds, you have a chart. No queues, no email threads, no waiting. This isn’t just a minor improvement; it's a fundamental shift in how teams operate.
Data Reporting Showdown: Manual SQL vs. Conversational AI
Metric | The Old Way (Manual SQL & BI Queues) | The New Way (Statspresso) |
|---|---|---|
Time to Answer | Days or even weeks | Seconds |
Required Skill | Deep SQL knowledge or an analyst | The ability to ask a question in English |
Process | File a ticket, wait in line, clarify, get a static report | Ask a question, get an interactive chart instantly |
Result | Slow, reactive decisions on stale data | Fast, confident decisions on live data |
The new way empowers anyone on your team to make smarter decisions, faster. Skip the SQL. Just ask your data a question and get a chart in seconds.
Core Features Every Great Ad Hoc Reporting Tool Needs
Finding the right ad hoc reporting tool can feel overwhelming. The market is booming for a reason—Gartner predicts that by 2026, generative AI will significantly reduce the need for technical skills to work with data. Businesses are tired of waiting on IT and want answers now.
To cut through the noise, you need to know what features truly make a difference. Let's break down the non-negotiables.
Seamless Data Connectivity
First, the basics. If you can't easily connect your data, the tool is a non-starter. A great ad hoc tool should connect to your everyday sources—think Postgres, HubSpot, or Google Analytics—in minutes. The initial setup should be a one-and-done affair.
Pre-built connectors for the apps you already use.
A painless authentication process that doesn't require a technical manual.
The ability to ask your first question almost immediately.
An Intuitive Interface for Everyone
This is where the promise of self-service often falls apart. Many tools have clunky drag-and-drop builders with a steep learning curve. The ideal interface should feel less like operating complex software and more like having a conversation. That’s the idea behind a Conversational AI Data Analyst like Statspresso. Instead of building a query, you just ask a question.
Try asking Statspresso: "Show me our monthly recurring revenue (MRR) growth for the past 6 months."
Powerful and Instant Visualization
A screen full of raw numbers doesn't tell a story. A useful tool automatically translates your data into clear charts and graphs. The right tool completely changes the dynamic, turning a long wait into an immediate answer.
The difference is night and day. The old way means filing a ticket and hoping. The new way is asking a question and getting your answer on the spot.
Effortless Collaboration and Sharing
An insight is useless if it stays siloed on your dashboard. A modern ad hoc reporting tool must make sharing simple. Look for the ability to send findings with a direct link or push an update straight to a Slack channel. The goal is to move from data to decision. For a detailed list of what to look for, some great points are made in this article on the core features of an ad hoc reporting tool.
Putting Ad Hoc Reporting to Work: Real Use Cases
Theory is nice, but results matter. The value of a good ad hoc reporting tool is how it solves real business problems. Let's look at a few practical scenarios.
For the Marketing Lead Proving ROI
You just finished a big campaign, and the CEO wants to know which channels paid off. Your standard dashboard shows total leads but not which ones brought in the highest-value customers. Instead of waiting for an analyst, you turn to your Conversational AI Data Analyst.
Try asking Statspresso: “What was our customer lifetime value by acquisition source for customers who signed up in Q2? Show me as a bar chart.”
In seconds, a chart appears. It shows that while Google Ads drove the most signups, customers from podcast sponsorships have 2x the LTV. You just found your most profitable channel without writing any code.
For the Product Manager Plugging a Leaky Funnel
Your analytics flag a big drop-off in the user onboarding flow. You have a hunch but can't be sure without data. This is a classic ad hoc analysis situation.
Try asking Statspresso: “Show me the drop-off rate for each step in our onboarding flow last week as a funnel chart.”
The tool instantly generates a funnel visualization, revealing a glaring issue: 73% of users abandon the process when asked to invite teammates. You just turned a vague problem into an actionable solution.
For the Founder Needing a Real-Time Pulse
You have a board meeting in an hour. You need the latest financial snapshot, and the monthly report is already two weeks old.
Try asking Statspresso: “What is our MRR growth month-over-month for the last year?”
Instantly, you get a line chart. You can follow up with, "Compare it to our churn rate over the same period," and get a second chart. You can walk into that meeting with confidence, armed with up-to-the-minute answers.
How to Choose the Right Ad Hoc Reporting Tool
Alright, you know you need a better way to get answers. The problem is, the market is a sea of options. How do you find the one that actually works for your team?
This isn't about finding the tool with the longest feature list. It’s about finding the one that removes the friction between a question and a data-backed answer.
Ask These Three Questions to Find Your Fit
To cut through the marketing jargon, boil the decision down to three practical questions. As you look at options, from conversational analytics tools to more traditional report automation tools for enterprises, keep these in mind.
Who is this actually built for? Is it for a data analyst who speaks SQL, or for a marketing lead who needs to understand campaign performance? If your goal is to empower the whole business team, a zero-code interface is non-negotiable.
How fast can we get our first answer? Your team has questions now, not next quarter. Look for a tool you can connect and use in minutes. If a tool requires weeks of engineering support, it’s creating the bottleneck you’re trying to eliminate.
What’s the real commitment? Are you being pushed into a long-term contract before you've even seen if it works? Or can you start with a free trial to prove its value?
The Right Choice for a Fast-Moving Team
For teams that can't afford to wait, the answers point toward a new breed of tool. This is where a Conversational AI Data Analyst like Statspresso comes in. It’s built for the entire business team, connects to your database in minutes, and has a flexible model for fast-growing companies.
The goal is simple: Skip the SQL. Just ask your data a question and get a chart in seconds. The right ad hoc reporting tool makes this possible.
Frequently Asked Questions About Ad Hoc Reporting
When teams start looking into ad hoc reporting, the same questions almost always come up. Let's tackle the big ones.
Does an Ad Hoc Tool Replace My Existing Dashboards?
Not at all. Think of it as a companion. Your dashboards are for checking essentials at a glance. An ad hoc reporting tool is your GPS for investigating unexpected roadblocks and asking one-off questions.
A Conversational AI Data Analyst like Statspresso fits perfectly into this workflow. You can freely ask questions and dig into anomalies. When you find something important, you can add that new insight to a permanent dashboard.
Do I Need to Be a Data Expert to Use These Tools?
It completely depends on the tool. Older BI tools often have a steep learning curve. The newer generation of conversational tools, however, is designed for business users, not just analysts.
With Statspresso, if you can ask a question in English, you can get insights. The whole point is to tear down the technical barriers so you can focus on your business. More traditional BI is covered in this great analysis from Ajelix.com.
How Secure Is Connecting Our Database to a Third-Party Tool?
Security should be your top priority. Any serious ad hoc reporting platform will use industry-standard protections like end-to-end encryption. But here’s the most critical feature to look for: read-only access. This guarantees the tool can never change, delete, or write to your original database. It's like giving someone a copy of a book to read instead of handing them a pen and the original manuscript. Always ask for security documentation and check for compliance certifications like SOC 2.
Ready to stop waiting in line and start getting answers? Connect your first data source for free and ask your first question. With Statspresso, you can skip the SQL and get a chart in seconds. Try it now at https://www.statspresso.com.