Understanding KPIs: The 2026 No-BS Guide
Waiting weeks for an analyst to build a dashboard is a relic of the past. Many teams already have the data. What they do not have is a fast way to turn that data into a decision.
That is why understanding key performance indicators matters. Not in the textbook sense. In the practical sense. Which numbers deserve attention, which ones are noise, and how to spot the difference before your team spends another quarter admiring charts that answer nothing.
Your Data Is Talking But Are You Listening
You are probably not short on dashboards. You are short on clarity.
One chart says signups are up. Another says revenue is flat. A third lives in HubSpot, a fourth in Shopify, and someone exported the “real” numbers to a spreadsheet last Friday. Nobody agrees which one is right. That is not a data problem. It is an access problem.

A KPI is supposed to cut through that mess. It gives a team one clear signal tied to a real goal. Done right, KPIs stop reporting theater and start driving action.
The core problem is not too little data
Most startups drown in available metrics. They track traffic, clicks, form fills, churn, trial starts, feature usage, open rates, support tickets, win rate, and whatever else the tools spit out by default.
That sounds responsible. It usually is not.
When every metric gets equal airtime, nothing is key anymore. Teams end up reacting to movement instead of managing performance. They become excellent at describing last month and terrible at deciding what to do next.
Speed matters more than another dashboard
The gap between a question and an answer is where momentum goes to die. If a founder asks, “Are qualified leads turning into revenue fast enough?” and the answer takes a week, the business is already slower than it should be.
Organizations using a balanced mix of leading and lagging KPIs achieve up to 20 to 30 percent faster decision cycles, according to SimpleKPI’s overview of KPI practice. That matters because decision speed is not a vanity outcome. It changes how quickly teams course-correct.
Practical takeaway: If your KPI review cadence is slower than your business, your KPI setup is broken.
The fix is not more BI ceremony. It is a smaller set of sharper questions, tied to a handful of indicators your team can act on.
What Is a KPI (And What It Is Not)
A KPI is not any number you can stick on a dashboard.
That is the first thing to clear up, because plenty of teams call everything a KPI and then wonder why nobody uses the dashboard after the kickoff meeting.
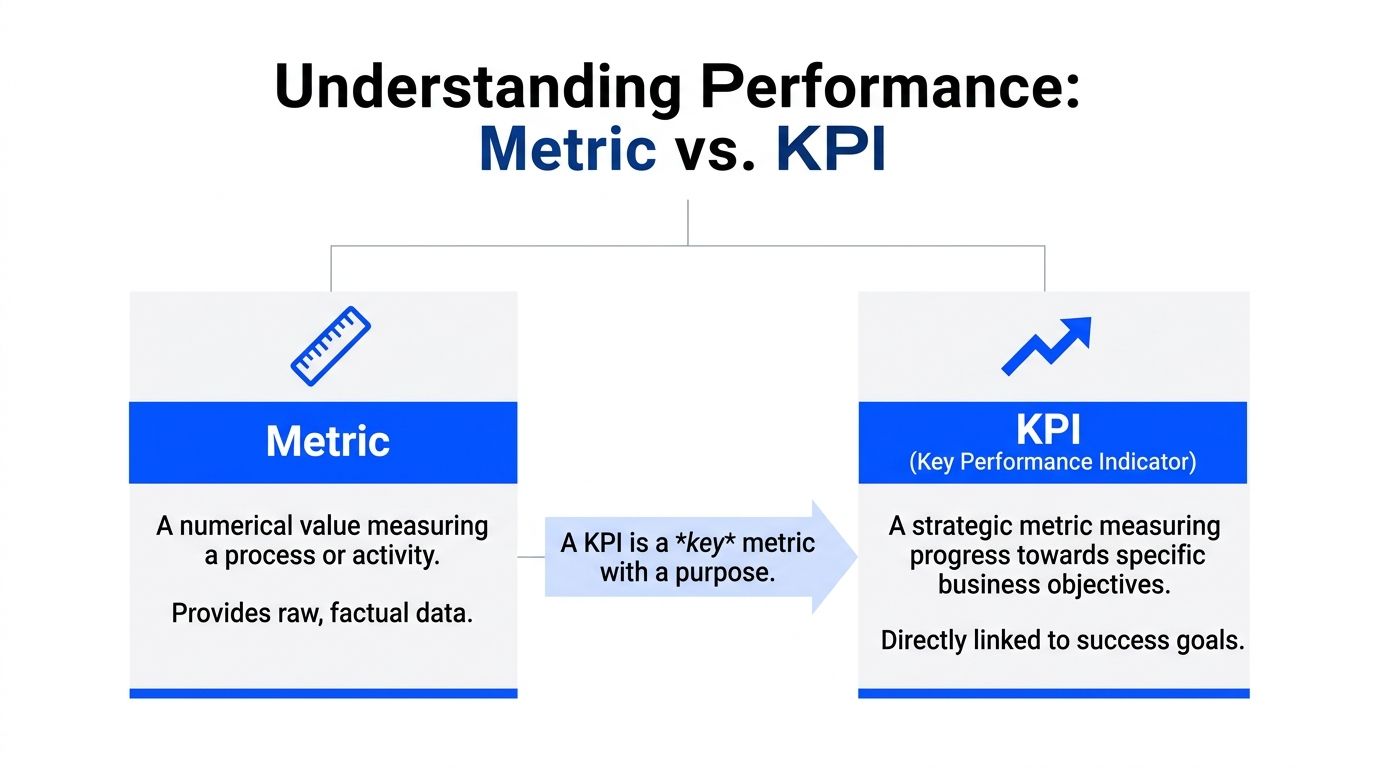
A metric measures activity
A metric tells you something happened.
Pageviews went up. Emails were sent. Users clicked a button. Tickets were closed. Those are measurements. Useful? Often, yes. Strategic? Not automatically.
If a number does not help you judge progress toward a business objective, it is a metric, not a KPI.
A KPI measures progress toward an outcome
A key performance indicator is a metric with a job. It points to whether you are getting closer to something the business cares about.
Use the car dashboard analogy. RPM is a metric. Fuel level is a metric. Speed, in the context of arriving on time, becomes a KPI because it is directly tied to the goal.
The same logic applies in a company:
Pageviews may be a metric.
Demo request conversion rate is closer to a KPI.
Qualified leads per month can be a KPI if pipeline growth is the goal.
Revenue growth rate can be a KPI if leadership is measuring strategic performance.
The difference is not complexity. It is relevance.
The three tests that separate real KPIs from dashboard wallpaper
I use three filters.
Aligned: The number must connect to a real business objective. If nobody can answer “why does this matter?” in one sentence, it probably is not a KPI.
Actionable: A team must be able to respond to it. If the number moves and nobody knows what lever to pull, it is not helping much.
Auditable: People need to trust the definition, source, and timing. If sales, product, and finance each calculate it differently, the KPI is already compromised.
Here is the blunt version. A KPI should survive a tough meeting. If a CFO, founder, or head of growth asks where the number came from, who owns it, and what action it should trigger, you need a crisp answer.
Vanity metrics are not harmless
Vanity metrics waste time because they look important while dodging accountability.
A startup can celebrate rising traffic while conversion quality drops. A product team can brag about feature clicks while retention softens. A support team can report ticket volume without showing whether response quality improved anything.
These numbers are not evil. They are just easy to overvalue.
Rule of thumb: If a metric makes the team feel busy but does not change a decision, demote it.
A simple way to pressure-test a candidate KPI
Ask these four questions:
What goal does this measure
Who owns the result
What action changes it
What decision would we make differently if it moved
If you cannot answer all four without hand-waving, keep it off the KPI list.
That one habit eliminates a lot of nonsense.
The Main Flavors of KPIs You Need to Know
Not all KPIs do the same job. Treating them as interchangeable is how teams build dashboards that are technically accurate and operationally useless.
Leading and lagging KPIs
This is the split that matters most.
A lagging KPI tells you what already happened. Revenue, churn, customer satisfaction, and turnover all fall into that camp. They are essential, but they arrive after the fact.
A leading KPI gives you an early signal. Qualified leads per month, website traffic, maintenance checks, or feature activation trends can hint at where results are headed before the quarter is over.
If lagging indicators are the rearview mirror, leading indicators are the windshield. You need both.
For a deeper practical read on how teams use lead and lag indicators, that guide is worth your time because it frames the distinction in plain business terms instead of management jargon.
Here is the common mistake. Teams obsess over lagging KPIs because they are easy to define and easy to defend. Revenue feels concrete. NPS feels familiar. But if you only track outcomes, you learn about problems after they have already become expensive.
A healthier mix looks like this:
Goal | Leading KPI | Lagging KPI |
|---|---|---|
Grow pipeline | Qualified leads per month | New sales revenue |
Improve product adoption | Activation behavior | Retention |
Strengthen customer health | Support response patterns | Customer satisfaction |
Quantitative and qualitative KPIs
Some KPIs are numerical by design. These are quantitative KPIs. They include customer acquisition cost, ROI, defect rates, revenue, and conversion rates.
They are useful because they are precise. Splunk notes that quantitative KPIs enable tight tracking across teams, and that top-performing SaaS companies often maintain an NPS between 30 and 50 while also watching leading indicators such as website traffic and qualified leads per month in its guide to KPI types and examples.
Qualitative KPIs answer a different question. They help explain the why behind the number. Customer sentiment, survey feedback, and sales call themes can provide context that raw counts cannot.
The mistake is treating qualitative signals as fluff. They often explain why a numeric KPI moved.
Strategic and operational KPIs
A founder and an ops lead should not stare at the same dashboard all day.
Strategic KPIs track long-term progress. Revenue growth, market share, profit-related measures, and customer loyalty trends belong here. These help leadership decide whether the business is headed in the right direction.
Operational KPIs focus on daily execution. They measure how the machine is running right now. Think patient wait time in healthcare, bed turnover, defect rates, order flow, or queue handling.
The practical difference is time horizon.
Strategic KPIs ask, “Are we winning?”
Operational KPIs ask, “Are we running well today?”
If you mash both into one bloated dashboard, neither audience gets what it needs. This is one reason teams end up with dashboard sprawl. It helps to keep a clean KPI library and definitions in one place, which is exactly what a metrics catalog should do. A well-structured example is available at https://www.statspresso.com/metrics.
Use this filter: Strategic KPIs belong in planning and leadership reviews. Operational KPIs belong where teams work and make daily decisions.
The mix that usually works
The best KPI stack is boring in the best way. A few forward-looking indicators. A few outcome indicators. Enough operational detail to manage execution. Not so much detail that the team needs a map to read the dashboard.
If you can explain every KPI on the screen in a single sentence, you are probably in good shape.
How to Choose KPIs That Matter for Your Team
Most KPI selection fails before anyone opens a dashboard tool. The mistake is starting with available data instead of business questions.
Start with the question. Then pick the KPI that answers it.
A 2026 analysis notes that leading KPIs are often “more challenging to set up” for SMBs, yet startups using AI tools to surface leading indicators can reduce decision cycles by up to 50 percent, according to OnStrategy’s KPI examples and analysis. That trade-off is real. Leading indicators take more thought. They are still worth the effort.
For growth teams
Growth teams usually need signals that connect demand to revenue, not just activity to applause.
Here are a few that earn their spot.
Lead conversion rate
Good question: Are we attracting the right prospects, or just more of them?
Bad use: Reporting it without separating channels, campaigns, or sales stages.
Customer acquisition cost
Good question: Are we buying growth efficiently?
Bad use: Treating blended CAC as the only truth when channel quality varies wildly.
New sales revenue
Good question: Is pipeline turning into actual money?
Bad use: Looking at it alone and ignoring what drove it.
Try asking a conversational analytics tool: “Show me qualified leads by source and lead conversion rate by month.”
Then ask the follow-up that most dashboards make annoying: “Which channels send leads that convert best?”
For product teams
Product teams often get trapped in feature theater. They track usage because usage is visible. That does not mean it is meaningful.
Better KPI choices focus on whether the product is becoming habit-forming and useful.
Feature adoption rate
This works when a feature is tied to retention, expansion, or activation. It fails when the feature is cosmetic and the team is trying to force significance onto it.
Question it answers: Are users discovering and adopting the capability we believe creates value?
Prompt example: “Show adoption of the new reporting feature by signup cohort.”
User retention
Retention is less flashy and far more honest. If users come back, something is working. If they do not, the rest of the product story probably needs editing.
Question it answers: Are we delivering repeat value over time?
Prompt example: “Compare retention for users who used Feature A versus users who did not.”
Support ticket patterns tied to product changes
Here, product and ops overlap in useful ways. Support volume alone is not a KPI by default, but paired with release cycles or onboarding stages, it becomes a useful signal.
Question it answers: Did this launch reduce friction or add it?
For operations and finance teams
Ops and finance need KPIs that expose control, efficiency, and cash reality. Fancy charts do not help if the business is leaking time or margin.
Burn rate
Answers: How fast are we consuming runway?
Common mistake: Reviewing it without context from hiring, sales timing, or expansion plans.
Gross profit margin
Answers: Are we building a business that gets healthier as it grows?
Common mistake: Treating revenue growth as success when margin quality is deteriorating.
Average sales cycle time
Answers: How quickly do deals move from interest to close?
Common mistake: Looking at averages without splitting by segment or deal size.
Prompt example: “Show monthly revenue, gross profit margin, and average sales cycle time for the last year.”
For people and team leads
Plenty of teams ignore workforce KPIs until hiring friction or turnover starts hurting delivery. That is late.
If your role includes people management, look at practical frameworks for Employee Key Performance Indicators that connect output, engagement, and accountability without reducing people to spreadsheet furniture.
A people KPI is only useful if it helps a manager intervene early and fairly.
Keep the list short enough to remember
You do not need a KPI committee. You need discipline.
For many teams, a manageable number of KPIs is enough to keep focus. If your dashboard opens with twenty tiles, you are not looking at a KPI dashboard. You are looking at unresolved prioritization.
A strong KPI set answers one sentence clearly: “If these numbers move, we know whether the team is healthy.”
Pick the KPIs that make that sentence true.
Common KPI Pitfalls and How to Dodge Them
Many teams fail from bad KPI habits than from bad data.
The tools are rarely the main issue. The habits are.
The vanity metric trap
Vanity metrics feel productive because they move often and look nice in slides. Traffic is the classic example. Traffic can matter. Traffic alone usually does not.
If a number cannot explain performance against a real goal, it belongs in supporting analysis, not on the main scoreboard.
A useful test is simple. Ask what decision changes if the metric rises or falls. If the answer is vague, demote it.
KPI sprawl
This one is everywhere. A company starts with five metrics. Each stakeholder requests “just one more.” Soon the dashboard looks like a cockpit built by committee.
When that happens, two bad outcomes show up:
People stop checking it because it takes too long to interpret.
People cherry-pick it because there is always some tile that supports their argument.
The cure is not prettier charts. It is subtraction.
Set and forget thinking
A KPI that made sense six months ago may be dead weight now.
Product changed. Sales motion changed. Pricing changed. The market changed. Yet the dashboard keeps tracking the same old numbers because nobody wants to reopen the KPI debate.
That is how dashboards become historical exhibits.
Review KPI relevance on a regular cadence. Keep the definition if it still drives action. Replace it if it does not.
Blind spots that dashboards do not surface
This is the sneaky one.
A dashboard shows what you decided to track. It does not automatically show what you forgot to track, what is correlated underneath, or where a hidden anomaly is forming. Many startup BI teams run into exactly that problem. Platform insights cited by CGM note that up to 60 percent of BI practitioners at startups face challenges with hidden patterns in raw data, and that traditional dashboards often miss these blind spots without AI surfacing gaps and anomalies in this KPI explainer.
That is why a curated dashboard alone is not enough.
Watch for this smell: The dashboard says everything is stable, but the team still feels operational pain. That usually means the KPI layer is missing context.
What works
The best teams do four unglamorous things well:
They cut aggressively. Fewer KPIs, better definitions.
They review intent. Every KPI has an owner and a decision attached.
They compare signals. Leading and lagging indicators are read together, not in isolation.
They investigate anomalies. They do not assume the dashboard will volunteer every risk on its own.
That is not fancy BI. It is competent management.
From Theory to Action How to Implement KPIs with Statspresso
Understanding key performance indicators is useful. Implementing them fast enough to help the business is what matters.
Many teams still use an old workflow. Someone asks a question. An analyst writes SQL. A dashboard gets built. Definitions get debated. The chart finally lands after the moment for action has passed.
That process is not rigorous. It is slow.

Start with connected data, not reporting requests
If your data lives across Shopify, HubSpot, Linear, and Postgres, your first KPI problem is usually fragmentation. One team trusts CRM numbers. Another trusts billing exports. Product has its own event view. Finance has a spreadsheet with a title like final_v7_really_final.
A conversational AI data analyst changes the order of operations.
Instead of filing a ticket for a report, you connect the source systems once and ask questions directly in plain English. That turns analytics from a production queue into an everyday workflow.
The workflow that reduces friction
Here is the modern sequence that works better for busy teams:
Connect the data source Bring in the systems your KPIs depend on. That might be Shopify for revenue, HubSpot for leads, or Postgres for product events.
Ask a plain-English question
Examples:
“Show me revenue by month for the last year as a bar chart.”
“Compare qualified leads and closed revenue by channel.”
“Which accounts had falling usage before churn?”
Inspect and refine
Good analysis is iterative. Ask follow-ups instead of opening another BI ticket.
“Now split that by region.”
“Exclude internal accounts.”
“Show the trend weekly.”
Pin the trusted output Once the chart answers a real business question, save it to a live dashboard.
Share and revisit The KPI lives where the team can access it, not buried in a one-off report.
Old way versus useful way
Task | Old Way (Manual BI / SQL) | New Way (Statspresso) |
|---|---|---|
Define a KPI | Meeting, spreadsheet, debate over formulas | Ask a business question and validate the result against connected data |
Build a chart | Analyst writes SQL and configures dashboard tiles | Ask in plain English and get a chart in seconds |
Handle follow-up questions | New request, new queue, more waiting | Ask a follow-up instantly in the same workflow |
Share results | Static screenshot or scheduled report | Live, shareable dashboard with trusted metrics |
Find hidden issues | Manual digging across tools | AI surfaces patterns and gaps faster than static dashboards |
Keep data fresh | Depends on sync schedules and dashboard upkeep | Real-time or near-real-time access when pipelines are healthy |
Why operational KPI plumbing matters
This part gets ignored until the whole system feels sluggish.
A KPI is only as useful as the freshness of the data feeding it. Data Pipeline Latency is one of the most important operational KPIs behind the scenes. When latency rises above 10 minutes, it can correlate with 40 to 60 percent drops in user engagement on analytics platforms because teams stop waiting and revert to manual exports. Top-quartile teams now achieve sub-2-minute latency, according to Atlan’s analysis of KPIs for data teams.
That is not a niche engineering detail. It affects trust. If a founder asks for today’s numbers and suspects the dashboard is stale, adoption drops fast.
What implementation looks like in practice
A sane rollout usually follows this pattern.
First, pick one decision-heavy use case
Do not start by rebuilding every dashboard your company has ever made. Start with one use case that creates real tension.
Good candidates:
Revenue monitoring across sources
Lead conversion visibility for growth
Retention and adoption questions for product
Margin and burn tracking for finance
Next, define the KPI in plain language
Use business language first. Technical definitions come second.
For example:
“We need to know if qualified leads are turning into revenue fast enough.”
“We need to know whether users who adopt Feature X retain better.”
“We need a clean view of gross margin by month.”
That framing matters because it prevents KPI setup from becoming a syntax exercise.
Then, let the team ask questions directly
This is the piece most legacy BI setups get wrong. They centralize access so tightly that every useful question becomes a request.
With conversational analytics, the marketing lead, founder, or product manager can ask for the number directly and refine the answer without learning SQL or Tableau gymnastics.
Try prompts like:
“Show me monthly revenue and new customers for the last year.”
“Which lead sources generate the highest conversion rate?”
“Compare user retention for customers who completed onboarding versus those who did not.”
“Chart gross profit margin by month.”
Tip: The best prompt is not the fanciest one. It is the one that mirrors the decision someone needs to make.
Finally, build dashboards from proven questions
This is a subtle but important shift. Do not start by designing a dashboard and guessing what belongs on it. Start by noticing which questions people keep asking. Then promote the reliable answers into a dashboard.
That produces leaner dashboards, stronger KPI definitions, and far fewer decorative charts.
Why this is better than the analyst bottleneck
This approach does not replace analysts. It removes pointless waiting.
Analysts should spend time on data modeling, definitions, governance, and deeper investigation. They should not spend their week fulfilling basic chart requests from people who just need to know whether revenue dipped last month or whether a campaign brought in qualified leads.
That is the primary value of a conversational AI data analyst. It lets teams skip the SQL and ask the data directly, while still grounding answers in the company’s own systems.
The end result is simple. Better questions. Faster answers. Fewer useless dashboards.
Your Next Move Stop Guessing, Start Asking
Here is the short version.
TL;DR
A KPI is a compass. It tells you whether you are moving toward a business goal.
A metric is not automatically a KPI. Plenty of numbers are measurable. Far fewer are useful.
Leading and lagging indicators work best together. One helps you anticipate. The other confirms results.
Many teams track too much. Focus on the few numbers that drive decisions.
Dashboards do not fix bad KPI thinking. Clear definitions, ownership, and action paths do.
The faster your team gets answers, the more valuable the KPI system becomes.
A lot of companies do not have a reporting problem. They have an interpretation problem, a prioritization problem, and an access problem dressed up as reporting.
That is good news, because those problems are fixable.
Pick one team. Pick one business question. Pick three to five KPIs that matter. Then make those KPIs easy to access, easy to trust, and hard to ignore.
If your current setup requires a queue, a spec doc, a dashboard review, and a prayer, it is time to retire it.
Statspresso is a Conversational AI Data Analyst built for teams that want answers without the BI bottleneck. Connect Shopify, HubSpot, Linear, Postgres, and more, then skip the SQL. Just ask your data a question and get a chart in seconds. If you are done guessing, connect your first data source for free and ask your first question at Statspresso.
Waiting weeks for an analyst to build a dashboard is a relic of the past. Many teams already have the data. What they do not have is a fast way to turn that data into a decision.
That is why understanding key performance indicators matters. Not in the textbook sense. In the practical sense. Which numbers deserve attention, which ones are noise, and how to spot the difference before your team spends another quarter admiring charts that answer nothing.
Your Data Is Talking But Are You Listening
You are probably not short on dashboards. You are short on clarity.
One chart says signups are up. Another says revenue is flat. A third lives in HubSpot, a fourth in Shopify, and someone exported the “real” numbers to a spreadsheet last Friday. Nobody agrees which one is right. That is not a data problem. It is an access problem.
A KPI is supposed to cut through that mess. It gives a team one clear signal tied to a real goal. Done right, KPIs stop reporting theater and start driving action.
The core problem is not too little data
Most startups drown in available metrics. They track traffic, clicks, form fills, churn, trial starts, feature usage, open rates, support tickets, win rate, and whatever else the tools spit out by default.
That sounds responsible. It usually is not.
When every metric gets equal airtime, nothing is key anymore. Teams end up reacting to movement instead of managing performance. They become excellent at describing last month and terrible at deciding what to do next.
Speed matters more than another dashboard
The gap between a question and an answer is where momentum goes to die. If a founder asks, “Are qualified leads turning into revenue fast enough?” and the answer takes a week, the business is already slower than it should be.
Organizations using a balanced mix of leading and lagging KPIs achieve up to 20 to 30 percent faster decision cycles, according to SimpleKPI’s overview of KPI practice. That matters because decision speed is not a vanity outcome. It changes how quickly teams course-correct.
Practical takeaway: If your KPI review cadence is slower than your business, your KPI setup is broken.
The fix is not more BI ceremony. It is a smaller set of sharper questions, tied to a handful of indicators your team can act on.
What Is a KPI (And What It Is Not)
A KPI is not any number you can stick on a dashboard.
That is the first thing to clear up, because plenty of teams call everything a KPI and then wonder why nobody uses the dashboard after the kickoff meeting.
A metric measures activity
A metric tells you something happened.
Pageviews went up. Emails were sent. Users clicked a button. Tickets were closed. Those are measurements. Useful? Often, yes. Strategic? Not automatically.
If a number does not help you judge progress toward a business objective, it is a metric, not a KPI.
A KPI measures progress toward an outcome
A key performance indicator is a metric with a job. It points to whether you are getting closer to something the business cares about.
Use the car dashboard analogy. RPM is a metric. Fuel level is a metric. Speed, in the context of arriving on time, becomes a KPI because it is directly tied to the goal.
The same logic applies in a company:
Pageviews may be a metric.
Demo request conversion rate is closer to a KPI.
Qualified leads per month can be a KPI if pipeline growth is the goal.
Revenue growth rate can be a KPI if leadership is measuring strategic performance.
The difference is not complexity. It is relevance.
The three tests that separate real KPIs from dashboard wallpaper
I use three filters.
Aligned: The number must connect to a real business objective. If nobody can answer “why does this matter?” in one sentence, it probably is not a KPI.
Actionable: A team must be able to respond to it. If the number moves and nobody knows what lever to pull, it is not helping much.
Auditable: People need to trust the definition, source, and timing. If sales, product, and finance each calculate it differently, the KPI is already compromised.
Here is the blunt version. A KPI should survive a tough meeting. If a CFO, founder, or head of growth asks where the number came from, who owns it, and what action it should trigger, you need a crisp answer.
Vanity metrics are not harmless
Vanity metrics waste time because they look important while dodging accountability.
A startup can celebrate rising traffic while conversion quality drops. A product team can brag about feature clicks while retention softens. A support team can report ticket volume without showing whether response quality improved anything.
These numbers are not evil. They are just easy to overvalue.
Rule of thumb: If a metric makes the team feel busy but does not change a decision, demote it.
A simple way to pressure-test a candidate KPI
Ask these four questions:
What goal does this measure
Who owns the result
What action changes it
What decision would we make differently if it moved
If you cannot answer all four without hand-waving, keep it off the KPI list.
That one habit eliminates a lot of nonsense.
The Main Flavors of KPIs You Need to Know
Not all KPIs do the same job. Treating them as interchangeable is how teams build dashboards that are technically accurate and operationally useless.
Leading and lagging KPIs
This is the split that matters most.
A lagging KPI tells you what already happened. Revenue, churn, customer satisfaction, and turnover all fall into that camp. They are essential, but they arrive after the fact.
A leading KPI gives you an early signal. Qualified leads per month, website traffic, maintenance checks, or feature activation trends can hint at where results are headed before the quarter is over.
If lagging indicators are the rearview mirror, leading indicators are the windshield. You need both.
For a deeper practical read on how teams use lead and lag indicators, that guide is worth your time because it frames the distinction in plain business terms instead of management jargon.
Here is the common mistake. Teams obsess over lagging KPIs because they are easy to define and easy to defend. Revenue feels concrete. NPS feels familiar. But if you only track outcomes, you learn about problems after they have already become expensive.
A healthier mix looks like this:
Goal | Leading KPI | Lagging KPI |
|---|---|---|
Grow pipeline | Qualified leads per month | New sales revenue |
Improve product adoption | Activation behavior | Retention |
Strengthen customer health | Support response patterns | Customer satisfaction |
Quantitative and qualitative KPIs
Some KPIs are numerical by design. These are quantitative KPIs. They include customer acquisition cost, ROI, defect rates, revenue, and conversion rates.
They are useful because they are precise. Splunk notes that quantitative KPIs enable tight tracking across teams, and that top-performing SaaS companies often maintain an NPS between 30 and 50 while also watching leading indicators such as website traffic and qualified leads per month in its guide to KPI types and examples.
Qualitative KPIs answer a different question. They help explain the why behind the number. Customer sentiment, survey feedback, and sales call themes can provide context that raw counts cannot.
The mistake is treating qualitative signals as fluff. They often explain why a numeric KPI moved.
Strategic and operational KPIs
A founder and an ops lead should not stare at the same dashboard all day.
Strategic KPIs track long-term progress. Revenue growth, market share, profit-related measures, and customer loyalty trends belong here. These help leadership decide whether the business is headed in the right direction.
Operational KPIs focus on daily execution. They measure how the machine is running right now. Think patient wait time in healthcare, bed turnover, defect rates, order flow, or queue handling.
The practical difference is time horizon.
Strategic KPIs ask, “Are we winning?”
Operational KPIs ask, “Are we running well today?”
If you mash both into one bloated dashboard, neither audience gets what it needs. This is one reason teams end up with dashboard sprawl. It helps to keep a clean KPI library and definitions in one place, which is exactly what a metrics catalog should do. A well-structured example is available at https://www.statspresso.com/metrics.
Use this filter: Strategic KPIs belong in planning and leadership reviews. Operational KPIs belong where teams work and make daily decisions.
The mix that usually works
The best KPI stack is boring in the best way. A few forward-looking indicators. A few outcome indicators. Enough operational detail to manage execution. Not so much detail that the team needs a map to read the dashboard.
If you can explain every KPI on the screen in a single sentence, you are probably in good shape.
How to Choose KPIs That Matter for Your Team
Most KPI selection fails before anyone opens a dashboard tool. The mistake is starting with available data instead of business questions.
Start with the question. Then pick the KPI that answers it.
A 2026 analysis notes that leading KPIs are often “more challenging to set up” for SMBs, yet startups using AI tools to surface leading indicators can reduce decision cycles by up to 50 percent, according to OnStrategy’s KPI examples and analysis. That trade-off is real. Leading indicators take more thought. They are still worth the effort.
For growth teams
Growth teams usually need signals that connect demand to revenue, not just activity to applause.
Here are a few that earn their spot.
Lead conversion rate
Good question: Are we attracting the right prospects, or just more of them?
Bad use: Reporting it without separating channels, campaigns, or sales stages.
Customer acquisition cost
Good question: Are we buying growth efficiently?
Bad use: Treating blended CAC as the only truth when channel quality varies wildly.
New sales revenue
Good question: Is pipeline turning into actual money?
Bad use: Looking at it alone and ignoring what drove it.
Try asking a conversational analytics tool: “Show me qualified leads by source and lead conversion rate by month.”
Then ask the follow-up that most dashboards make annoying: “Which channels send leads that convert best?”
For product teams
Product teams often get trapped in feature theater. They track usage because usage is visible. That does not mean it is meaningful.
Better KPI choices focus on whether the product is becoming habit-forming and useful.
Feature adoption rate
This works when a feature is tied to retention, expansion, or activation. It fails when the feature is cosmetic and the team is trying to force significance onto it.
Question it answers: Are users discovering and adopting the capability we believe creates value?
Prompt example: “Show adoption of the new reporting feature by signup cohort.”
User retention
Retention is less flashy and far more honest. If users come back, something is working. If they do not, the rest of the product story probably needs editing.
Question it answers: Are we delivering repeat value over time?
Prompt example: “Compare retention for users who used Feature A versus users who did not.”
Support ticket patterns tied to product changes
Here, product and ops overlap in useful ways. Support volume alone is not a KPI by default, but paired with release cycles or onboarding stages, it becomes a useful signal.
Question it answers: Did this launch reduce friction or add it?
For operations and finance teams
Ops and finance need KPIs that expose control, efficiency, and cash reality. Fancy charts do not help if the business is leaking time or margin.
Burn rate
Answers: How fast are we consuming runway?
Common mistake: Reviewing it without context from hiring, sales timing, or expansion plans.
Gross profit margin
Answers: Are we building a business that gets healthier as it grows?
Common mistake: Treating revenue growth as success when margin quality is deteriorating.
Average sales cycle time
Answers: How quickly do deals move from interest to close?
Common mistake: Looking at averages without splitting by segment or deal size.
Prompt example: “Show monthly revenue, gross profit margin, and average sales cycle time for the last year.”
For people and team leads
Plenty of teams ignore workforce KPIs until hiring friction or turnover starts hurting delivery. That is late.
If your role includes people management, look at practical frameworks for Employee Key Performance Indicators that connect output, engagement, and accountability without reducing people to spreadsheet furniture.
A people KPI is only useful if it helps a manager intervene early and fairly.
Keep the list short enough to remember
You do not need a KPI committee. You need discipline.
For many teams, a manageable number of KPIs is enough to keep focus. If your dashboard opens with twenty tiles, you are not looking at a KPI dashboard. You are looking at unresolved prioritization.
A strong KPI set answers one sentence clearly: “If these numbers move, we know whether the team is healthy.”
Pick the KPIs that make that sentence true.
Common KPI Pitfalls and How to Dodge Them
Many teams fail from bad KPI habits than from bad data.
The tools are rarely the main issue. The habits are.
The vanity metric trap
Vanity metrics feel productive because they move often and look nice in slides. Traffic is the classic example. Traffic can matter. Traffic alone usually does not.
If a number cannot explain performance against a real goal, it belongs in supporting analysis, not on the main scoreboard.
A useful test is simple. Ask what decision changes if the metric rises or falls. If the answer is vague, demote it.
KPI sprawl
This one is everywhere. A company starts with five metrics. Each stakeholder requests “just one more.” Soon the dashboard looks like a cockpit built by committee.
When that happens, two bad outcomes show up:
People stop checking it because it takes too long to interpret.
People cherry-pick it because there is always some tile that supports their argument.
The cure is not prettier charts. It is subtraction.
Set and forget thinking
A KPI that made sense six months ago may be dead weight now.
Product changed. Sales motion changed. Pricing changed. The market changed. Yet the dashboard keeps tracking the same old numbers because nobody wants to reopen the KPI debate.
That is how dashboards become historical exhibits.
Review KPI relevance on a regular cadence. Keep the definition if it still drives action. Replace it if it does not.
Blind spots that dashboards do not surface
This is the sneaky one.
A dashboard shows what you decided to track. It does not automatically show what you forgot to track, what is correlated underneath, or where a hidden anomaly is forming. Many startup BI teams run into exactly that problem. Platform insights cited by CGM note that up to 60 percent of BI practitioners at startups face challenges with hidden patterns in raw data, and that traditional dashboards often miss these blind spots without AI surfacing gaps and anomalies in this KPI explainer.
That is why a curated dashboard alone is not enough.
Watch for this smell: The dashboard says everything is stable, but the team still feels operational pain. That usually means the KPI layer is missing context.
What works
The best teams do four unglamorous things well:
They cut aggressively. Fewer KPIs, better definitions.
They review intent. Every KPI has an owner and a decision attached.
They compare signals. Leading and lagging indicators are read together, not in isolation.
They investigate anomalies. They do not assume the dashboard will volunteer every risk on its own.
That is not fancy BI. It is competent management.
From Theory to Action How to Implement KPIs with Statspresso
Understanding key performance indicators is useful. Implementing them fast enough to help the business is what matters.
Many teams still use an old workflow. Someone asks a question. An analyst writes SQL. A dashboard gets built. Definitions get debated. The chart finally lands after the moment for action has passed.
That process is not rigorous. It is slow.
Start with connected data, not reporting requests
If your data lives across Shopify, HubSpot, Linear, and Postgres, your first KPI problem is usually fragmentation. One team trusts CRM numbers. Another trusts billing exports. Product has its own event view. Finance has a spreadsheet with a title like final_v7_really_final.
A conversational AI data analyst changes the order of operations.
Instead of filing a ticket for a report, you connect the source systems once and ask questions directly in plain English. That turns analytics from a production queue into an everyday workflow.
The workflow that reduces friction
Here is the modern sequence that works better for busy teams:
Connect the data source Bring in the systems your KPIs depend on. That might be Shopify for revenue, HubSpot for leads, or Postgres for product events.
Ask a plain-English question
Examples:
“Show me revenue by month for the last year as a bar chart.”
“Compare qualified leads and closed revenue by channel.”
“Which accounts had falling usage before churn?”
Inspect and refine
Good analysis is iterative. Ask follow-ups instead of opening another BI ticket.
“Now split that by region.”
“Exclude internal accounts.”
“Show the trend weekly.”
Pin the trusted output Once the chart answers a real business question, save it to a live dashboard.
Share and revisit The KPI lives where the team can access it, not buried in a one-off report.
Old way versus useful way
Task | Old Way (Manual BI / SQL) | New Way (Statspresso) |
|---|---|---|
Define a KPI | Meeting, spreadsheet, debate over formulas | Ask a business question and validate the result against connected data |
Build a chart | Analyst writes SQL and configures dashboard tiles | Ask in plain English and get a chart in seconds |
Handle follow-up questions | New request, new queue, more waiting | Ask a follow-up instantly in the same workflow |
Share results | Static screenshot or scheduled report | Live, shareable dashboard with trusted metrics |
Find hidden issues | Manual digging across tools | AI surfaces patterns and gaps faster than static dashboards |
Keep data fresh | Depends on sync schedules and dashboard upkeep | Real-time or near-real-time access when pipelines are healthy |
Why operational KPI plumbing matters
This part gets ignored until the whole system feels sluggish.
A KPI is only as useful as the freshness of the data feeding it. Data Pipeline Latency is one of the most important operational KPIs behind the scenes. When latency rises above 10 minutes, it can correlate with 40 to 60 percent drops in user engagement on analytics platforms because teams stop waiting and revert to manual exports. Top-quartile teams now achieve sub-2-minute latency, according to Atlan’s analysis of KPIs for data teams.
That is not a niche engineering detail. It affects trust. If a founder asks for today’s numbers and suspects the dashboard is stale, adoption drops fast.
What implementation looks like in practice
A sane rollout usually follows this pattern.
First, pick one decision-heavy use case
Do not start by rebuilding every dashboard your company has ever made. Start with one use case that creates real tension.
Good candidates:
Revenue monitoring across sources
Lead conversion visibility for growth
Retention and adoption questions for product
Margin and burn tracking for finance
Next, define the KPI in plain language
Use business language first. Technical definitions come second.
For example:
“We need to know if qualified leads are turning into revenue fast enough.”
“We need to know whether users who adopt Feature X retain better.”
“We need a clean view of gross margin by month.”
That framing matters because it prevents KPI setup from becoming a syntax exercise.
Then, let the team ask questions directly
This is the piece most legacy BI setups get wrong. They centralize access so tightly that every useful question becomes a request.
With conversational analytics, the marketing lead, founder, or product manager can ask for the number directly and refine the answer without learning SQL or Tableau gymnastics.
Try prompts like:
“Show me monthly revenue and new customers for the last year.”
“Which lead sources generate the highest conversion rate?”
“Compare user retention for customers who completed onboarding versus those who did not.”
“Chart gross profit margin by month.”
Tip: The best prompt is not the fanciest one. It is the one that mirrors the decision someone needs to make.
Finally, build dashboards from proven questions
This is a subtle but important shift. Do not start by designing a dashboard and guessing what belongs on it. Start by noticing which questions people keep asking. Then promote the reliable answers into a dashboard.
That produces leaner dashboards, stronger KPI definitions, and far fewer decorative charts.
Why this is better than the analyst bottleneck
This approach does not replace analysts. It removes pointless waiting.
Analysts should spend time on data modeling, definitions, governance, and deeper investigation. They should not spend their week fulfilling basic chart requests from people who just need to know whether revenue dipped last month or whether a campaign brought in qualified leads.
That is the primary value of a conversational AI data analyst. It lets teams skip the SQL and ask the data directly, while still grounding answers in the company’s own systems.
The end result is simple. Better questions. Faster answers. Fewer useless dashboards.
Your Next Move Stop Guessing, Start Asking
Here is the short version.
TL;DR
A KPI is a compass. It tells you whether you are moving toward a business goal.
A metric is not automatically a KPI. Plenty of numbers are measurable. Far fewer are useful.
Leading and lagging indicators work best together. One helps you anticipate. The other confirms results.
Many teams track too much. Focus on the few numbers that drive decisions.
Dashboards do not fix bad KPI thinking. Clear definitions, ownership, and action paths do.
The faster your team gets answers, the more valuable the KPI system becomes.
A lot of companies do not have a reporting problem. They have an interpretation problem, a prioritization problem, and an access problem dressed up as reporting.
That is good news, because those problems are fixable.
Pick one team. Pick one business question. Pick three to five KPIs that matter. Then make those KPIs easy to access, easy to trust, and hard to ignore.
If your current setup requires a queue, a spec doc, a dashboard review, and a prayer, it is time to retire it.
Statspresso is a Conversational AI Data Analyst built for teams that want answers without the BI bottleneck. Connect Shopify, HubSpot, Linear, Postgres, and more, then skip the SQL. Just ask your data a question and get a chart in seconds. If you are done guessing, connect your first data source for free and ask your first question at Statspresso.