Self-Serve Analytics for Non-Technical Teams

Waiting a week for a simple chart is absurd, yet plenty of teams still live that way. A marketing lead wants last month’s top signup channel. A product manager wants activation by cohort. A founder wants churn by plan. The answers exist, but they’re trapped behind analyst queues, dashboard sprawl, or tools that expect everyone to think like a BI developer.
That’s the core case for self-serve analytics for non-technical teams. Not more dashboards. Faster answers. Better questions. Less ritual humiliation in front of a filter panel with seventeen dropdowns and no clue which metric definition is the “real” one.
The good version of self-serve analytics lets people ask what they mean and get a trustworthy answer quickly. The bad version gives them access to a maze and calls it capability.
Stop Waiting for Data and Start Making Decisions
It’s Tuesday morning. You need to know which marketing channel drove the most signups last month. You send the request to the data team. The reply comes back fast enough to be annoying: added to queue.
That queue is expensive. It slows decisions, turns analysts into ticket processors, and teaches teams to operate on guesswork while the actual answer is “coming soon.”

This isn’t a niche software category looking for a problem. The global self-service analytics market was valued at USD 4.82 billion in 2024 and is projected to reach USD 17.52 billion by 2033, according to Grand View Research’s self-service analytics market report. Companies are buying these tools because waiting on IT or a central data team no longer fits how modern teams work.
Why the old reporting model breaks down
Centralized reporting works for board decks, finance controls, and carefully governed KPI packs. It fails when a growth team needs to test an idea today, not next week.
A few things usually go wrong at once:
Requests pile up: straightforward questions sit beside major analytical work in the same queue.
Context gets lost: the person asking knows the business nuance, but the analyst has to reconstruct it from a Slack message.
Dashboards lag behind reality: yesterday’s carefully built view rarely answers today’s weird but important question.
Teams stop asking: once people expect delay, they make decisions with partial information.
Self-serve doesn’t matter because dashboards are trendy. It matters because decision speed compounds.
What good self-serve actually changes
Good self-serve analytics doesn’t eliminate analysts. It protects their time for modeling, instrumentation, governance, and harder investigations. It also gives operators, marketers, PMs, and founders a way to get routine answers without booking a ticket and a prayer.
That shift matters most when users can work in plain language. Most non-technical teams don’t think in joins, dimensions, and chart configuration. They think in questions. Which campaign drove upgrades? Which customer segment is slipping? Why did conversion dip after the launch?
If your tool starts by teaching them where to click, you’ve already made adoption harder than it needs to be.
Laying the Groundwork for Self-Serve Success
Most failed rollouts have the same smell. Someone buys a tool first, points it at messy data second, and discovers third that “self-serve” users don’t trust what they’re seeing.
The setup work isn’t glamorous. It is what keeps the whole thing from becoming another abandoned analytics experiment.
Start with business questions, not tool features
Non-technical teams don’t need “access to all available fields.” They need answers to recurring business questions.
A better starting point is a small set of high-value questions by function:
Marketing asks: Which channels drive qualified signups, pipeline, or repeat purchases?
Product asks: Where do users drop off in activation, retention, or feature adoption?
Sales asks: Which segments convert faster, stall longer, or expand more often?
Operations asks: Where are delays, exceptions, or support load clustering?
That list does two things. First, it tells you what data must be available and trustworthy. Second, it stops the rollout from becoming a giant “explore anything” promise that sounds helpful and usually lands as chaos.
Separate core metrics from exploratory analysis
Not every number should be endlessly remixable.
Your core metrics need stable definitions. Revenue. Churn. ARR. CAC. Active users. Conversion rate. If different teams can casually redefine these on the fly, self-serve becomes self-inflicted pain.
Exploratory metrics are different. These are the ad hoc cuts and comparisons people use to investigate behavior. Campaign performance by audience. Activation by signup source. Resolution time by issue type. These can be flexible, as long as the underlying definitions stay anchored.
Practical rule: Lock down metric definitions. Open up the paths people can use to explore them.
Build a self-serve ready data layer
In these situations, experienced data teams save everyone else from confusion.
Before rollout, check whether your data is usable by someone who doesn’t live inside warehouse schemas. If a table name looks like an internal joke and the key field requires tribal knowledge, that’s not self-serve. That’s a scavenger hunt.
Use a simple readiness checklist:
Clear naming: business-friendly table and field names beat warehouse shorthand every time.
Trusted definitions: each headline metric should have one agreed meaning.
Useful descriptions: users should know what a field represents without asking an analyst.
Reasonable defaults: date ranges, segments, and chart types should steer people toward sane starting points.
Permission boundaries: people need access to the right data, not all data.
Freshness visibility: users should know whether a dataset is current enough for the decision at hand.
Define success before launch
Many teams become careless at this stage. They announce the tool, run a demo, and only later ask whether it’s working.
That’s backwards. A successful self-serve analytics program has a small set of agreed outcomes before anybody starts querying data. One of the recurring problems in the category is unclear measurement. A staggering 65% of self-service analytics programs lack clear metrics, which leads to “impatience and lack of support” from leadership, according to Dataversity’s review of self-service analytics pros and cons.
Useful measures are usually operational, not theatrical:
Fewer ad hoc analyst tickets: are routine questions moving out of the queue?
Faster answers to recurring business questions: are teams getting from question to action faster?
Higher confidence in shared metrics: are fewer meetings derailed by definition fights?
Sustained usage by target teams: are people returning because the tool is useful, not because they were told to click around during training?
Prepare people for interpretation, not just clicking
The user problem isn’t only access. It’s interpretation.
A self-serve environment without guidance can make confident mistakes easier to produce. Teams need lightweight guardrails: what this metric includes, when to compare cohorts, when sample size is too thin, and when a question should go back to the data team for a deeper cut.
That’s why the rollout should include short examples tied to real decisions. Not a generic product walkthrough. Show a PM how to inspect activation by source. Show marketing how to compare campaign outcomes without redefining revenue in the process.
The point is simple. If the data isn’t trustworthy, the interface won’t save you. If the questions aren’t clear, more access won’t help. And if success isn’t defined up front, the initiative will feel fuzzy right when leadership asks whether it’s worth continuing.
Choose Your Experience Visual Dashboards vs Conversational AI
Here’s the fork in the road. You can give non-technical teams a visual BI environment full of dashboards, filters, and drill paths. Or you can give them a system that lets them ask a question in plain English and get an answer.
Both count as self-serve. They are not equally usable.
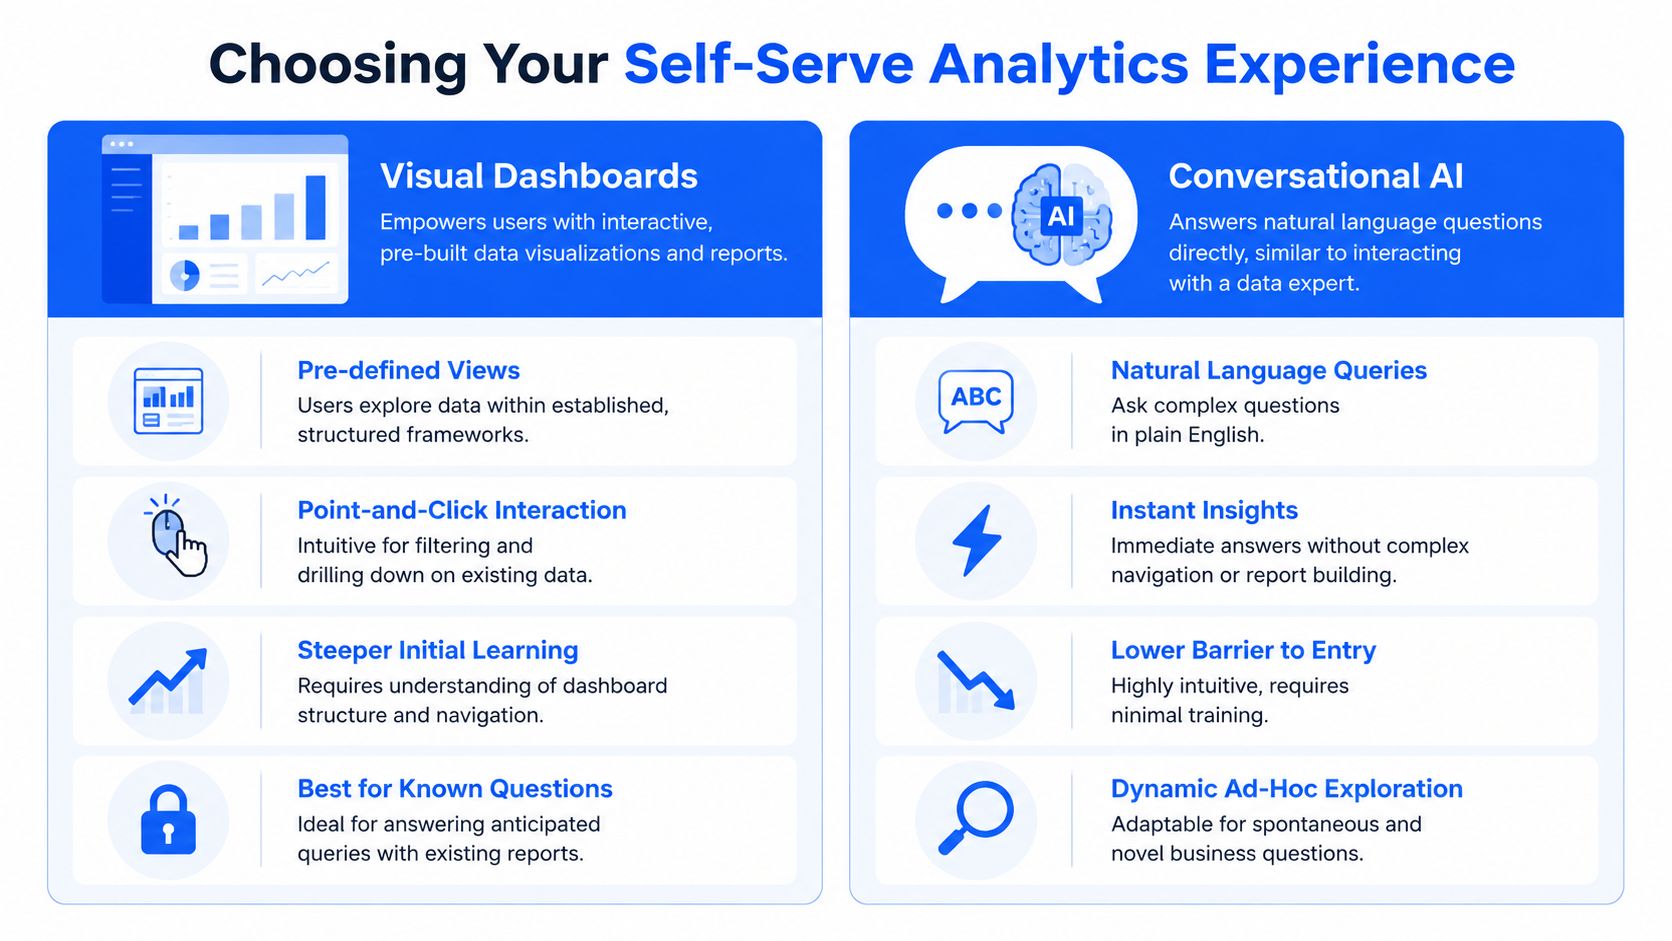
Visual dashboards are great for known paths
Traditional BI dashboards are useful when the question is already anticipated. A sales leader wants the weekly pipeline view. A support manager wants ticket volume by queue. A finance team needs a stable monthly pack.
That’s what visual dashboards do well. They package recurring views and let users filter within established boundaries. If you’re designing mobile app dashboards or embedded reporting experiences for structured workflows, this model can be a good fit.
The catch is obvious the moment the user asks something slightly off-script. They now need to understand where the data lives, which dashboard to open, which filters matter, and whether the chart in front of them is close enough to the question they meant to ask.
Conversational analytics fits how non-technical people think
Most operators don’t wake up wanting to “use a dashboard.” They want an answer.
That’s why conversational analytics has become the more natural path for self-serve analytics for non-technical teams. The interaction starts with business language, not report architecture. Ask the question. Refine it. Compare periods. Break it down by channel. Turn it into a chart.
A Conversational AI Data Analyst serves as a better mental model than a BI builder because it meets people where they already are: in question form.
Try asking Statspresso: “Show me revenue by month for the last year as a bar chart.”
For teams evaluating this approach, Statspresso’s guide on chatting with your data is a useful example of how conversational analytics works in practice.
The trade-off in plain English
Visual BI asks the user to learn the system.
Conversational analytics asks the system to understand the user.
That difference looks small on a vendor landing page and huge inside a busy team.
Factor | The Old Way (Visual BI Dashboards) | The New Way (Conversational Analytics) |
|---|---|---|
Starting point | Open a dashboard and find the right view | Ask a question in plain English |
User mindset | Builder or navigator | Operator or decision-maker |
Best for | Known, repeatable questions | Ad hoc, evolving questions |
Learning curve | Higher, because users must learn layout and filter logic | Lower, because interaction mirrors normal language |
Exploration style | Click through pre-built paths | Ask follow-up questions naturally |
Failure mode | Users get lost in dashboards or stop at surface-level answers | Users need clear metric definitions and trusted data under the hood |
A drag-and-drop interface is still an interface people have to learn. A question is already something they know how to write.
What to choose
If your team has analysts building curated views for repeat monitoring, visual dashboards still matter.
If your goal is broad adoption among marketing leads, product managers, founders, account managers, and operators who think in business questions, conversational analytics is the stronger default. It removes the “learn the cockpit first” tax that undermines adoption.
The right experience isn’t the one with the most controls. It’s the one people will rely on when they need an answer before the meeting starts.
The Implementation Playbook From Connection to Governance
Most rollouts fail from overconfidence, not lack of software. Someone connects a few sources, announces company-wide access, and expects self-serve magic by Monday.
That’s how you get confusion, weak trust, and a lot of “can someone help me read this?” messages.

Step one, connect a narrow set of useful data
Start with the systems people already ask about every week. For most startups and SMBs, that means some mix of Shopify, HubSpot, Stripe, Postgres, product event data, CRM data, and support data.
Don’t start by connecting everything. Start by connecting the sources that can answer a handful of recurring business questions well.
A narrow launch does three useful things:
It reduces cleanup work.
It makes metric definition easier.
It gives users a better first impression because the available answers are relevant.
If you’re introducing a conversational tool, this is also the point where one option like Statspresso can fit cleanly. It connects business data sources and lets users ask plain-English questions for charts and answers without SQL. That’s useful when the audience is made up of PMs, marketers, and operators, not dashboard hobbyists.
Step two, give people quick wins
Nobody adopts a new analytics workflow because the architecture diagram is elegant.
They adopt it because the first few questions work.
Seed the rollout with practical prompts tied to real rituals:
Weekly growth review: “Show signups by channel for the last month.”
Product check-in: “Compare activation rate by signup cohort.”
Sales review: “Which lead sources produced the most opportunities this quarter?”
Ops triage: “Break down support volume by category over the past four weeks.”
Shortcuts matter. Templates matter. Familiar examples matter even more.
Field note: The first successful question does more for adoption than the fanciest launch presentation.
Step three, pilot with early adopters
This is the part teams skip when they’re in a hurry. Then they wonder why usage craters.
Launching self-serve analytics to all users simultaneously without building consensus leads to 70%+ drop-off rates in adoption, while successful programs that start with a pilot of 10-20% of early adopters see 3x higher long-term engagement, according to Tellius on common self-service analytics rollout pitfalls.
That pattern tracks with real life. The people you want first are the ones already trying to answer questions on their own. Curious PMs. Growth leads who keep exporting CSVs. RevOps people building spreadsheets after hours. They won’t need a speech about why this matters.
A good pilot group usually includes:
One marketer who owns campaign decisions.
One PM who needs product usage context.
One ops or sales lead who depends on recurring performance questions.
One data representative who can resolve definition issues quickly.
The pilot is where you discover whether your metric names make sense, whether your data model is understandable, and where users get stuck. Better to learn that with a small group than with the whole company watching.
Step four, put governance in before scale
Self-serve without governance is just decentralized confusion.
The word “governance” scares people because it sounds like a committee and a PDF nobody reads. In practice, it means simple rules that keep analytics useful and safe:
Metric ownership: somebody owns the definition of each key KPI.
Access control: users can query what they’re allowed to see.
Definition visibility: business terms are documented where people use them.
Change management: if revenue logic changes, users know it changed.
Escalation paths: ambiguous or risky analysis goes to the data team.
If your company handles regulated content or sensitive records, adjacent governance disciplines become relevant fast. Teams working through AI usage policies often benefit from broader checklists like this guide to document AI governance for regulated teams, even though analytics governance has its own specifics.
What not to do
A few rollout mistakes show up again and again:
Dumping users into raw schemas: they won’t know what anything means, and they shouldn’t have to.
Treating training as a one-time webinar: people forget generic demos almost instantly.
Letting every team define the same metric differently: this creates speed for a week and distrust for a year.
Calling logins adoption: opening the tool once is not the same as getting value from it.
The strongest implementation feels almost boring behind the scenes. Clean connections. Obvious definitions. Small pilot. Tight feedback loop. Governed growth. That’s what lets the user experience feel easy.
Driving Adoption and Embedding Analytics in Workflows
A tool can be technically rolled out and socially dead. That’s common. The login exists, the connector works, the launch message got a few emoji reactions, and then everyone goes back to asking the data team in Slack.
Adoption happens when analytics shows up where people already work and helps them do the next decision faster.

Make the first habit painfully easy
The fastest path to usage is not “advanced analytics training.” It’s one recurring question solved inside an existing workflow.
A marketing team reviews campaign performance every Monday. A PM checks activation every Thursday. A founder asks about churn before the staff meeting. Those are habits already in motion. Self-serve analytics should slide into them without ceremony.
That’s also why teams report meaningful efficiency gains from self-serve. Companies implementing self-serve analytics report up to a 70% reduction in time-to-insight, turning days of back-and-forth into minutes and freeing data teams from routine requests, according to Querio’s discussion of self-service analytics for data-driven teams.
The key phrase there is routine requests. You want the obvious, repetitive, “I just need to know this now” questions out of the queue.
Train with prompts, not lectures
Most analytics training is too abstract. It teaches interface features instead of decision moments.
Better training sounds like this:
For growth: “Ask which campaign produced the most signups last month.”
For product: “Ask where activation dropped by cohort.”
For sales: “Ask which lead source generated the highest opportunity volume.”
For support: “Ask which issue categories are rising week over week.”
These examples give people a starting language. Once they get a good answer, they naturally ask the next question.
Try asking your analytics assistant:
“Show me signups by source for the last 30 days.”
“Compare activation rate by signup month.”
“Which campaigns influenced the most conversions?”
“Break down churn by plan type.”
Embed answers into the tools people already open
At this point, self-serve stops being a side quest.
A few practical patterns work well:
Workflow | Embedded analytics habit |
|---|---|
Notion team hub | Add a live chart for weekly leads, signups, or support backlog |
Slack channel | Post a scheduled summary when a key metric changes materially |
Weekly leadership doc | Pull in a current chart instead of pasting screenshots |
Product ritual | Link the exact query used in the review so anyone can rerun it |
Campaign review | Keep the question and chart together for repeat analysis |
The less context switching required, the more likely the behavior sticks.
Don’t ask a busy team to remember another destination. Put the answer inside the route they already take.
Create local champions, not central nagging
Adoption rarely spreads because the BI team keeps reminding everyone to use the tool. It spreads because one marketer shows another marketer a faster way to answer a real question.
That means your early adopters should be visible. Let them bring examples into meetings. Let them share the prompt they used. Let them show the chart that settled an argument in five minutes.
A founder doesn’t need everybody to become an analyst. A founder needs each team to become less blocked.
Keep analysts in the loop for deeper work
Self-serve should reduce low-value dependency, not pretend every question is simple.
Good teams create a healthy split:
routine descriptive questions stay with the business user,
cross-functional metric disputes go to the data team,
deeper investigations still involve an analyst,
structural issues in tracking or modeling get fixed at the source.
That arrangement is healthier for everyone. Non-technical users get speed. Analysts get their time back for the harder work they were hired to do.
Measuring What Matters Adoption and Real ROI
If leadership asks whether the self-serve rollout worked and the best answer is “people seem to like it,” you have a measurement problem.
That’s common. A staggering 65% of self-service analytics programs lack clear metrics, and that gap often creates impatience and weak executive support, as noted in the earlier Dataversity research.
Stop worshipping vanity metrics
Logins are easy to count and easy to misread.
A person can open an analytics tool, click around, get confused, and never come back. That still shows up as usage. It does not show up as value.
Better indicators focus on whether the operating model improved.
Use a scorecard like this:
Analyst ticket reduction: Are fewer routine ad hoc questions reaching the data team?
Time-to-answer for recurring decisions: Are weekly reviews moving faster because the answer is already available?
Query success rate: Do users get a useful, actionable answer without escalation?
Decision throughput: Are teams testing and responding faster because analysis isn’t bottlenecked?
Metric consistency: Are there fewer disputes over what core KPIs mean?
Measure before and after, not vibes versus vibes
The cleanest way to show ROI is to compare the old workflow with the new one.
Before rollout, capture a baseline:
how routine requests are submitted,
how long answers typically take,
which meetings rely on stale screenshots,
where analysts spend time on repetitive questions,
which decisions are delayed waiting for basic reporting.
After rollout, compare the same workflow.
A practical framework:
Area | Before self-serve | After self-serve |
|---|---|---|
Routine question handling | Queue, Slack thread, analyst follow-up | User asks directly and gets an answer |
Decision timing | Delayed until reporting arrives | Handled in the same work session |
Analyst workload | Heavy on repeated requests | More time for modeling and strategic analysis |
Trust in metrics | Depends on who built the spreadsheet | Stronger if definitions are centralized |
Cross-team access | Limited by BI bottleneck | Broader access with guardrails |
Tie ROI to labor saved and better decisions
You don’t need a theatrical spreadsheet to make the case. Keep it grounded.
Calculate value from three buckets:
Time returned to analysts: fewer routine requests means more time for data quality, instrumentation, forecasting, and strategic work.
Time returned to operators: PMs, marketers, and leads stop waiting for straightforward answers.
Decision quality: teams make fewer calls based on stale or partial information.
That third bucket is harder to quantify precisely, so describe it carefully unless you have your own internal numbers. The first two are usually easier to observe directly in tickets, meeting flow, and team feedback.
Use targets that reflect behavior change
A good measurement plan includes targets, but they should be realistic and tied to the actual rollout. Good examples are qualitative unless your team has validated baselines.
Strong target types include:
routine questions answered without analyst intervention,
faster preparation for weekly business reviews,
repeated usage by pilot teams,
fewer duplicate spreadsheets for the same KPI,
more consistent use of shared metric definitions.
Weak target types include “everyone uses it” and “all reporting is self-serve.” That’s not how mature analytics functions work.
If your ROI story depends on replacing analysts, you’re measuring the wrong thing. The real gain is removing needless dependency.
A practical TL DR
Start with real business questions: don’t launch a tool into a vacuum.
Clean up definitions first: trust dies faster than adoption grows.
Choose the right interface: non-technical teams usually need conversational analytics more than dashboard complexity.
Pilot before broad rollout: early adopters help you fix friction before it becomes public.
Embed analytics into work habits: make answers part of meetings, docs, and channels.
Measure operational change: focus on time saved, tickets reduced, and decision speed.
The strongest ROI case is boring in the best way. Fewer interruptions. Faster answers. Better meetings. More analyst time spent on work that actually requires an analyst.
From Questions to Clarity And From Clarity to Action
Teams often don’t have a data scarcity problem. They have an access problem, a usability problem, and sometimes a “why does this dashboard require a minor in dashboard archaeology” problem.
That’s why self-serve analytics for non-technical teams matters. It changes the pace of the business. Marketing can inspect performance without waiting. Product can explore behavior without filing a request. Operations can spot issues before they become a weekly surprise. Analysts stop being human vending machines for charts.
The important shift isn’t from one BI tool to another. It’s from query-thinking to question-thinking. When the interface matches how people naturally work, analytics stops being a specialized event and becomes part of daily decision-making.
Connect your first data source with Statspresso and ask your first question in plain English. It’s a conversational AI data analyst built for teams that want answers and charts without writing SQL. Skip the reporting queue, skip the dashboard maze, and get to the next decision faster.
Waiting a week for a simple chart is absurd, yet plenty of teams still live that way. A marketing lead wants last month’s top signup channel. A product manager wants activation by cohort. A founder wants churn by plan. The answers exist, but they’re trapped behind analyst queues, dashboard sprawl, or tools that expect everyone to think like a BI developer.
That’s the core case for self-serve analytics for non-technical teams. Not more dashboards. Faster answers. Better questions. Less ritual humiliation in front of a filter panel with seventeen dropdowns and no clue which metric definition is the “real” one.
The good version of self-serve analytics lets people ask what they mean and get a trustworthy answer quickly. The bad version gives them access to a maze and calls it capability.
Stop Waiting for Data and Start Making Decisions
It’s Tuesday morning. You need to know which marketing channel drove the most signups last month. You send the request to the data team. The reply comes back fast enough to be annoying: added to queue.
That queue is expensive. It slows decisions, turns analysts into ticket processors, and teaches teams to operate on guesswork while the actual answer is “coming soon.”
This isn’t a niche software category looking for a problem. The global self-service analytics market was valued at USD 4.82 billion in 2024 and is projected to reach USD 17.52 billion by 2033, according to Grand View Research’s self-service analytics market report. Companies are buying these tools because waiting on IT or a central data team no longer fits how modern teams work.
Why the old reporting model breaks down
Centralized reporting works for board decks, finance controls, and carefully governed KPI packs. It fails when a growth team needs to test an idea today, not next week.
A few things usually go wrong at once:
Requests pile up: straightforward questions sit beside major analytical work in the same queue.
Context gets lost: the person asking knows the business nuance, but the analyst has to reconstruct it from a Slack message.
Dashboards lag behind reality: yesterday’s carefully built view rarely answers today’s weird but important question.
Teams stop asking: once people expect delay, they make decisions with partial information.
Self-serve doesn’t matter because dashboards are trendy. It matters because decision speed compounds.
What good self-serve actually changes
Good self-serve analytics doesn’t eliminate analysts. It protects their time for modeling, instrumentation, governance, and harder investigations. It also gives operators, marketers, PMs, and founders a way to get routine answers without booking a ticket and a prayer.
That shift matters most when users can work in plain language. Most non-technical teams don’t think in joins, dimensions, and chart configuration. They think in questions. Which campaign drove upgrades? Which customer segment is slipping? Why did conversion dip after the launch?
If your tool starts by teaching them where to click, you’ve already made adoption harder than it needs to be.
Laying the Groundwork for Self-Serve Success
Most failed rollouts have the same smell. Someone buys a tool first, points it at messy data second, and discovers third that “self-serve” users don’t trust what they’re seeing.
The setup work isn’t glamorous. It is what keeps the whole thing from becoming another abandoned analytics experiment.
Start with business questions, not tool features
Non-technical teams don’t need “access to all available fields.” They need answers to recurring business questions.
A better starting point is a small set of high-value questions by function:
Marketing asks: Which channels drive qualified signups, pipeline, or repeat purchases?
Product asks: Where do users drop off in activation, retention, or feature adoption?
Sales asks: Which segments convert faster, stall longer, or expand more often?
Operations asks: Where are delays, exceptions, or support load clustering?
That list does two things. First, it tells you what data must be available and trustworthy. Second, it stops the rollout from becoming a giant “explore anything” promise that sounds helpful and usually lands as chaos.
Separate core metrics from exploratory analysis
Not every number should be endlessly remixable.
Your core metrics need stable definitions. Revenue. Churn. ARR. CAC. Active users. Conversion rate. If different teams can casually redefine these on the fly, self-serve becomes self-inflicted pain.
Exploratory metrics are different. These are the ad hoc cuts and comparisons people use to investigate behavior. Campaign performance by audience. Activation by signup source. Resolution time by issue type. These can be flexible, as long as the underlying definitions stay anchored.
Practical rule: Lock down metric definitions. Open up the paths people can use to explore them.
Build a self-serve ready data layer
In these situations, experienced data teams save everyone else from confusion.
Before rollout, check whether your data is usable by someone who doesn’t live inside warehouse schemas. If a table name looks like an internal joke and the key field requires tribal knowledge, that’s not self-serve. That’s a scavenger hunt.
Use a simple readiness checklist:
Clear naming: business-friendly table and field names beat warehouse shorthand every time.
Trusted definitions: each headline metric should have one agreed meaning.
Useful descriptions: users should know what a field represents without asking an analyst.
Reasonable defaults: date ranges, segments, and chart types should steer people toward sane starting points.
Permission boundaries: people need access to the right data, not all data.
Freshness visibility: users should know whether a dataset is current enough for the decision at hand.
Define success before launch
Many teams become careless at this stage. They announce the tool, run a demo, and only later ask whether it’s working.
That’s backwards. A successful self-serve analytics program has a small set of agreed outcomes before anybody starts querying data. One of the recurring problems in the category is unclear measurement. A staggering 65% of self-service analytics programs lack clear metrics, which leads to “impatience and lack of support” from leadership, according to Dataversity’s review of self-service analytics pros and cons.
Useful measures are usually operational, not theatrical:
Fewer ad hoc analyst tickets: are routine questions moving out of the queue?
Faster answers to recurring business questions: are teams getting from question to action faster?
Higher confidence in shared metrics: are fewer meetings derailed by definition fights?
Sustained usage by target teams: are people returning because the tool is useful, not because they were told to click around during training?
Prepare people for interpretation, not just clicking
The user problem isn’t only access. It’s interpretation.
A self-serve environment without guidance can make confident mistakes easier to produce. Teams need lightweight guardrails: what this metric includes, when to compare cohorts, when sample size is too thin, and when a question should go back to the data team for a deeper cut.
That’s why the rollout should include short examples tied to real decisions. Not a generic product walkthrough. Show a PM how to inspect activation by source. Show marketing how to compare campaign outcomes without redefining revenue in the process.
The point is simple. If the data isn’t trustworthy, the interface won’t save you. If the questions aren’t clear, more access won’t help. And if success isn’t defined up front, the initiative will feel fuzzy right when leadership asks whether it’s worth continuing.
Choose Your Experience Visual Dashboards vs Conversational AI
Here’s the fork in the road. You can give non-technical teams a visual BI environment full of dashboards, filters, and drill paths. Or you can give them a system that lets them ask a question in plain English and get an answer.
Both count as self-serve. They are not equally usable.
Visual dashboards are great for known paths
Traditional BI dashboards are useful when the question is already anticipated. A sales leader wants the weekly pipeline view. A support manager wants ticket volume by queue. A finance team needs a stable monthly pack.
That’s what visual dashboards do well. They package recurring views and let users filter within established boundaries. If you’re designing mobile app dashboards or embedded reporting experiences for structured workflows, this model can be a good fit.
The catch is obvious the moment the user asks something slightly off-script. They now need to understand where the data lives, which dashboard to open, which filters matter, and whether the chart in front of them is close enough to the question they meant to ask.
Conversational analytics fits how non-technical people think
Most operators don’t wake up wanting to “use a dashboard.” They want an answer.
That’s why conversational analytics has become the more natural path for self-serve analytics for non-technical teams. The interaction starts with business language, not report architecture. Ask the question. Refine it. Compare periods. Break it down by channel. Turn it into a chart.
A Conversational AI Data Analyst serves as a better mental model than a BI builder because it meets people where they already are: in question form.
Try asking Statspresso: “Show me revenue by month for the last year as a bar chart.”
For teams evaluating this approach, Statspresso’s guide on chatting with your data is a useful example of how conversational analytics works in practice.
The trade-off in plain English
Visual BI asks the user to learn the system.
Conversational analytics asks the system to understand the user.
That difference looks small on a vendor landing page and huge inside a busy team.
Factor | The Old Way (Visual BI Dashboards) | The New Way (Conversational Analytics) |
|---|---|---|
Starting point | Open a dashboard and find the right view | Ask a question in plain English |
User mindset | Builder or navigator | Operator or decision-maker |
Best for | Known, repeatable questions | Ad hoc, evolving questions |
Learning curve | Higher, because users must learn layout and filter logic | Lower, because interaction mirrors normal language |
Exploration style | Click through pre-built paths | Ask follow-up questions naturally |
Failure mode | Users get lost in dashboards or stop at surface-level answers | Users need clear metric definitions and trusted data under the hood |
A drag-and-drop interface is still an interface people have to learn. A question is already something they know how to write.
What to choose
If your team has analysts building curated views for repeat monitoring, visual dashboards still matter.
If your goal is broad adoption among marketing leads, product managers, founders, account managers, and operators who think in business questions, conversational analytics is the stronger default. It removes the “learn the cockpit first” tax that undermines adoption.
The right experience isn’t the one with the most controls. It’s the one people will rely on when they need an answer before the meeting starts.
The Implementation Playbook From Connection to Governance
Most rollouts fail from overconfidence, not lack of software. Someone connects a few sources, announces company-wide access, and expects self-serve magic by Monday.
That’s how you get confusion, weak trust, and a lot of “can someone help me read this?” messages.
Step one, connect a narrow set of useful data
Start with the systems people already ask about every week. For most startups and SMBs, that means some mix of Shopify, HubSpot, Stripe, Postgres, product event data, CRM data, and support data.
Don’t start by connecting everything. Start by connecting the sources that can answer a handful of recurring business questions well.
A narrow launch does three useful things:
It reduces cleanup work.
It makes metric definition easier.
It gives users a better first impression because the available answers are relevant.
If you’re introducing a conversational tool, this is also the point where one option like Statspresso can fit cleanly. It connects business data sources and lets users ask plain-English questions for charts and answers without SQL. That’s useful when the audience is made up of PMs, marketers, and operators, not dashboard hobbyists.
Step two, give people quick wins
Nobody adopts a new analytics workflow because the architecture diagram is elegant.
They adopt it because the first few questions work.
Seed the rollout with practical prompts tied to real rituals:
Weekly growth review: “Show signups by channel for the last month.”
Product check-in: “Compare activation rate by signup cohort.”
Sales review: “Which lead sources produced the most opportunities this quarter?”
Ops triage: “Break down support volume by category over the past four weeks.”
Shortcuts matter. Templates matter. Familiar examples matter even more.
Field note: The first successful question does more for adoption than the fanciest launch presentation.
Step three, pilot with early adopters
This is the part teams skip when they’re in a hurry. Then they wonder why usage craters.
Launching self-serve analytics to all users simultaneously without building consensus leads to 70%+ drop-off rates in adoption, while successful programs that start with a pilot of 10-20% of early adopters see 3x higher long-term engagement, according to Tellius on common self-service analytics rollout pitfalls.
That pattern tracks with real life. The people you want first are the ones already trying to answer questions on their own. Curious PMs. Growth leads who keep exporting CSVs. RevOps people building spreadsheets after hours. They won’t need a speech about why this matters.
A good pilot group usually includes:
One marketer who owns campaign decisions.
One PM who needs product usage context.
One ops or sales lead who depends on recurring performance questions.
One data representative who can resolve definition issues quickly.
The pilot is where you discover whether your metric names make sense, whether your data model is understandable, and where users get stuck. Better to learn that with a small group than with the whole company watching.
Step four, put governance in before scale
Self-serve without governance is just decentralized confusion.
The word “governance” scares people because it sounds like a committee and a PDF nobody reads. In practice, it means simple rules that keep analytics useful and safe:
Metric ownership: somebody owns the definition of each key KPI.
Access control: users can query what they’re allowed to see.
Definition visibility: business terms are documented where people use them.
Change management: if revenue logic changes, users know it changed.
Escalation paths: ambiguous or risky analysis goes to the data team.
If your company handles regulated content or sensitive records, adjacent governance disciplines become relevant fast. Teams working through AI usage policies often benefit from broader checklists like this guide to document AI governance for regulated teams, even though analytics governance has its own specifics.
What not to do
A few rollout mistakes show up again and again:
Dumping users into raw schemas: they won’t know what anything means, and they shouldn’t have to.
Treating training as a one-time webinar: people forget generic demos almost instantly.
Letting every team define the same metric differently: this creates speed for a week and distrust for a year.
Calling logins adoption: opening the tool once is not the same as getting value from it.
The strongest implementation feels almost boring behind the scenes. Clean connections. Obvious definitions. Small pilot. Tight feedback loop. Governed growth. That’s what lets the user experience feel easy.
Driving Adoption and Embedding Analytics in Workflows
A tool can be technically rolled out and socially dead. That’s common. The login exists, the connector works, the launch message got a few emoji reactions, and then everyone goes back to asking the data team in Slack.
Adoption happens when analytics shows up where people already work and helps them do the next decision faster.
Make the first habit painfully easy
The fastest path to usage is not “advanced analytics training.” It’s one recurring question solved inside an existing workflow.
A marketing team reviews campaign performance every Monday. A PM checks activation every Thursday. A founder asks about churn before the staff meeting. Those are habits already in motion. Self-serve analytics should slide into them without ceremony.
That’s also why teams report meaningful efficiency gains from self-serve. Companies implementing self-serve analytics report up to a 70% reduction in time-to-insight, turning days of back-and-forth into minutes and freeing data teams from routine requests, according to Querio’s discussion of self-service analytics for data-driven teams.
The key phrase there is routine requests. You want the obvious, repetitive, “I just need to know this now” questions out of the queue.
Train with prompts, not lectures
Most analytics training is too abstract. It teaches interface features instead of decision moments.
Better training sounds like this:
For growth: “Ask which campaign produced the most signups last month.”
For product: “Ask where activation dropped by cohort.”
For sales: “Ask which lead source generated the highest opportunity volume.”
For support: “Ask which issue categories are rising week over week.”
These examples give people a starting language. Once they get a good answer, they naturally ask the next question.
Try asking your analytics assistant:
“Show me signups by source for the last 30 days.”
“Compare activation rate by signup month.”
“Which campaigns influenced the most conversions?”
“Break down churn by plan type.”
Embed answers into the tools people already open
At this point, self-serve stops being a side quest.
A few practical patterns work well:
Workflow | Embedded analytics habit |
|---|---|
Notion team hub | Add a live chart for weekly leads, signups, or support backlog |
Slack channel | Post a scheduled summary when a key metric changes materially |
Weekly leadership doc | Pull in a current chart instead of pasting screenshots |
Product ritual | Link the exact query used in the review so anyone can rerun it |
Campaign review | Keep the question and chart together for repeat analysis |
The less context switching required, the more likely the behavior sticks.
Don’t ask a busy team to remember another destination. Put the answer inside the route they already take.
Create local champions, not central nagging
Adoption rarely spreads because the BI team keeps reminding everyone to use the tool. It spreads because one marketer shows another marketer a faster way to answer a real question.
That means your early adopters should be visible. Let them bring examples into meetings. Let them share the prompt they used. Let them show the chart that settled an argument in five minutes.
A founder doesn’t need everybody to become an analyst. A founder needs each team to become less blocked.
Keep analysts in the loop for deeper work
Self-serve should reduce low-value dependency, not pretend every question is simple.
Good teams create a healthy split:
routine descriptive questions stay with the business user,
cross-functional metric disputes go to the data team,
deeper investigations still involve an analyst,
structural issues in tracking or modeling get fixed at the source.
That arrangement is healthier for everyone. Non-technical users get speed. Analysts get their time back for the harder work they were hired to do.
Measuring What Matters Adoption and Real ROI
If leadership asks whether the self-serve rollout worked and the best answer is “people seem to like it,” you have a measurement problem.
That’s common. A staggering 65% of self-service analytics programs lack clear metrics, and that gap often creates impatience and weak executive support, as noted in the earlier Dataversity research.
Stop worshipping vanity metrics
Logins are easy to count and easy to misread.
A person can open an analytics tool, click around, get confused, and never come back. That still shows up as usage. It does not show up as value.
Better indicators focus on whether the operating model improved.
Use a scorecard like this:
Analyst ticket reduction: Are fewer routine ad hoc questions reaching the data team?
Time-to-answer for recurring decisions: Are weekly reviews moving faster because the answer is already available?
Query success rate: Do users get a useful, actionable answer without escalation?
Decision throughput: Are teams testing and responding faster because analysis isn’t bottlenecked?
Metric consistency: Are there fewer disputes over what core KPIs mean?
Measure before and after, not vibes versus vibes
The cleanest way to show ROI is to compare the old workflow with the new one.
Before rollout, capture a baseline:
how routine requests are submitted,
how long answers typically take,
which meetings rely on stale screenshots,
where analysts spend time on repetitive questions,
which decisions are delayed waiting for basic reporting.
After rollout, compare the same workflow.
A practical framework:
Area | Before self-serve | After self-serve |
|---|---|---|
Routine question handling | Queue, Slack thread, analyst follow-up | User asks directly and gets an answer |
Decision timing | Delayed until reporting arrives | Handled in the same work session |
Analyst workload | Heavy on repeated requests | More time for modeling and strategic analysis |
Trust in metrics | Depends on who built the spreadsheet | Stronger if definitions are centralized |
Cross-team access | Limited by BI bottleneck | Broader access with guardrails |
Tie ROI to labor saved and better decisions
You don’t need a theatrical spreadsheet to make the case. Keep it grounded.
Calculate value from three buckets:
Time returned to analysts: fewer routine requests means more time for data quality, instrumentation, forecasting, and strategic work.
Time returned to operators: PMs, marketers, and leads stop waiting for straightforward answers.
Decision quality: teams make fewer calls based on stale or partial information.
That third bucket is harder to quantify precisely, so describe it carefully unless you have your own internal numbers. The first two are usually easier to observe directly in tickets, meeting flow, and team feedback.
Use targets that reflect behavior change
A good measurement plan includes targets, but they should be realistic and tied to the actual rollout. Good examples are qualitative unless your team has validated baselines.
Strong target types include:
routine questions answered without analyst intervention,
faster preparation for weekly business reviews,
repeated usage by pilot teams,
fewer duplicate spreadsheets for the same KPI,
more consistent use of shared metric definitions.
Weak target types include “everyone uses it” and “all reporting is self-serve.” That’s not how mature analytics functions work.
If your ROI story depends on replacing analysts, you’re measuring the wrong thing. The real gain is removing needless dependency.
A practical TL DR
Start with real business questions: don’t launch a tool into a vacuum.
Clean up definitions first: trust dies faster than adoption grows.
Choose the right interface: non-technical teams usually need conversational analytics more than dashboard complexity.
Pilot before broad rollout: early adopters help you fix friction before it becomes public.
Embed analytics into work habits: make answers part of meetings, docs, and channels.
Measure operational change: focus on time saved, tickets reduced, and decision speed.
The strongest ROI case is boring in the best way. Fewer interruptions. Faster answers. Better meetings. More analyst time spent on work that actually requires an analyst.
From Questions to Clarity And From Clarity to Action
Teams often don’t have a data scarcity problem. They have an access problem, a usability problem, and sometimes a “why does this dashboard require a minor in dashboard archaeology” problem.
That’s why self-serve analytics for non-technical teams matters. It changes the pace of the business. Marketing can inspect performance without waiting. Product can explore behavior without filing a request. Operations can spot issues before they become a weekly surprise. Analysts stop being human vending machines for charts.
The important shift isn’t from one BI tool to another. It’s from query-thinking to question-thinking. When the interface matches how people naturally work, analytics stops being a specialized event and becomes part of daily decision-making.
Connect your first data source with Statspresso and ask your first question in plain English. It’s a conversational AI data analyst built for teams that want answers and charts without writing SQL. Skip the reporting queue, skip the dashboard maze, and get to the next decision faster.