Dashboard Automation: The 2026 Guide

Waiting weeks for a data analyst to build a dashboard is a relic of the past. If you're still stuck in that cycle of email requests, complex SQL, and copy-pasting into spreadsheets, you're not just slow—you're burning valuable time. The truth is, by the time that report hits your inbox, the data is already stale. Dashboard automation fixes this. It's about getting real-time answers so you can make decisions that actually drive growth.
Let's cut to the chase.
The Old Way vs. The New Way
The old BI workflow is agonizingly slow. It creates data silos and is riddled with human error. A single bad formula can derail your strategy. This is exactly where a Conversational AI Data Analyst like Statspresso changes the game. Instead of filing a ticket and waiting, you just ask a question.
Here’s how the two approaches stack up. It’s not even a fair fight.
Metric | The Old Way (Manual SQL & Spreadsheets) | The New Way (Statspresso & Automation) |
|---|---|---|
Time to Insight | Days or weeks. Hope your analyst is in a good mood. | Seconds. Just ask a question. |
Data Freshness | Stale the moment it's exported. | Always live, always real-time. |
Accuracy | High risk of copy-paste errors and bad formulas. | Error-free, thanks to direct data connections. |
Accessibility | Trapped in an email attachment. | Accessible to your whole team, anytime. |
Effort Required | 10-12 hours of mind-numbing manual work per week. | Set it up once. It runs forever. |
The table makes it obvious: the manual process is broken. It simply can't keep up with the pace of modern business. With Statspresso, you skip the SQL and get a chart in seconds.
Try asking Statspresso: "Show me my revenue by month for the last year as a bar chart."
This shift isn't a small tweak. A 2026 industry report from Gartner highlights that companies adopting "GenBI" (Generative Business Intelligence) are out-pacing competitors by over 40% in decision speed. Why? Because they move from data wrangling to data action.
If you want to dive deeper, we have a detailed guide on how you can automate your reports and dashboards.
So, What Is Dashboard Automation, Really?
Forget the corporate speak. Think of dashboard automation as an employee who works 24/7. Their only job is to fetch, clean, and organize your business data so it’s always ready for you. No coffee breaks, no vacation days.
In simple terms, it's a system that automatically connects to all your data sources—your Shopify store, your HubSpot CRM, your team's Postgres database—and pulls the latest numbers on a schedule. It instantly updates every chart and KPI on your dashboard. No more manually exporting CSVs or copy-pasting into spreadsheets. Your reports are always live, accurate, and require zero hands-on effort.
How It Works Under the Hood
The process feels like magic, but it’s just smart tech. Here’s a quick, no-fluff breakdown:
Data Connectors: These are the keys that securely unlock data from your platforms. A good system has a master key for everything from a Google Sheet to a complex data warehouse.
Refresh Scheduler: This is the alarm clock for your data. You tell it when to fetch new info—every hour, every day, whatever your business needs.
Visualization Layer: This is the part you see—the charts and graphs that turn raw numbers into clear insights.
This concept map shows the move from a manual mess to an automated workflow.
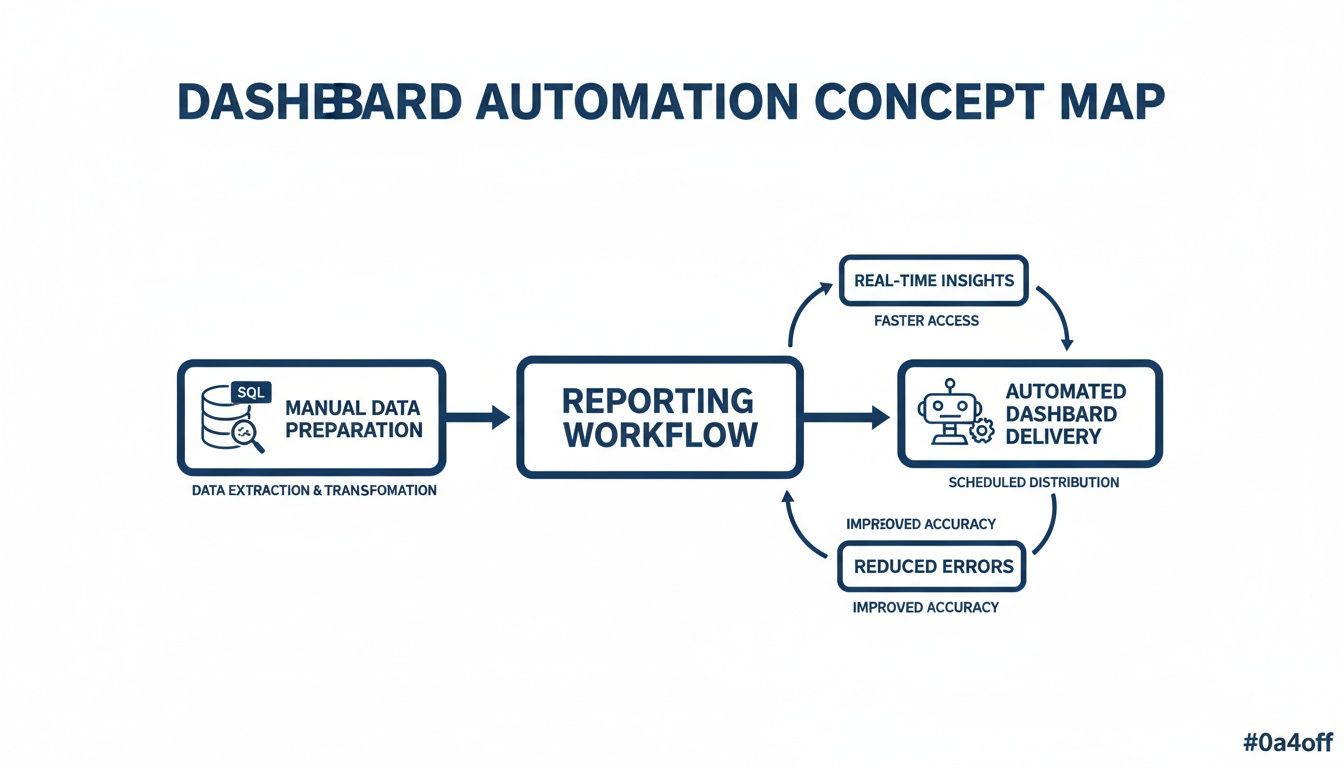
The difference is stark. You trade a slow, error-prone routine for a hands-off, reliable system.
This is where a Conversational AI Data Analyst like Statspresso shines. It handles all three parts for you, letting you skip the SQL entirely. You just ask a question in plain English, and it builds the visual for you.
Try asking Statspresso: 'Show me my new users by acquisition channel over the last 90 days.'
Ultimately, you stop spending time building reports and start spending it acting on the data.
Why Automated Dashboards Are a Startup Superpower

For a growing company, speed is everything. It’s the difference between seizing an opportunity and watching a competitor get there first. Dashboard automation isn't a nice-to-have; it's your secret weapon. It changes how fast your team can spot a trend, fix a problem, and make calls that drive growth.
Gain Unbeatable Speed to Insight
Think about the old way. You have a question, file a ticket, and... you wait. Days later, a spreadsheet lands in your inbox. The moment has passed. With dashboard automation, that question-to-answer cycle shrinks from weeks to seconds.
Imagine your marketing lead wants to check the ROI on a new campaign. Instead of begging for exports from HubSpot and Google Ads, they get a live view. This means you can adjust ad spend at 10 a.m. based on what happened at 9 a.m., not last week’s numbers. This shift away from static reports is detailed on Yellowfin's blog.
Establish a Single Source of Truth
How often have you seen sales and marketing show up with different numbers for the same metric? It happens constantly. Each team pulls data manually, creating conflicting "versions of the truth." Automated dashboarding ends this. By connecting directly to your core systems, it creates a single, unified view everyone trusts.
The arguments over "whose numbers are right" vanish. The conversation shifts to "What should we do next?" This is where a Conversational AI Data Analyst like Statspresso acts as the impartial referee, pulling real-time data to give everyone the same answer.
Empower True Data Self-Service
Your engineers are some of your most valuable people. So why are they wasting their days pulling CSVs? It’s a huge waste of talent. Dashboard automation gives your entire team the power of self-service analytics.
A product manager can check user engagement.
A founder can track real-time Monthly Recurring Revenue (MRR).
A marketing lead can monitor campaign performance.
They can do it all without writing a line of SQL or bugging an engineer. With a tool like Statspresso, it's as simple as asking a question.
Try asking Statspresso: 'Compare my ad spend vs conversions for the last month.'
This frees up your tech team to build a great product, not reports.
How to Implement Dashboard Automation the Smart Way
Getting started can feel overwhelming. People think they need to track every metric from day one. That’s a recipe for noisy, useless dashboards. Trust me, the smart way is to start small, prove the value, and then expand.
Forget perfection. It's about progress. The whole process boils down to three simple phases.
Phase 1: Identify Your Key Metrics
The biggest mistake is trying to track everything. A dashboard with 50 charts creates noise, not clarity. Instead, ask: "If I could only know five things about my business right now, what would they be?"
This forces you to focus on your most critical Key Performance Indicators (KPIs). For a startup, that list might be:
Monthly Recurring Revenue (MRR)
Customer Acquisition Cost (CAC)
Customer Churn Rate
Daily Active Users (DAU)
Lead-to-Conversion Rate
Seriously, limit yourself to 3-5 essential metrics. This gives you an immediate, valuable snapshot without drowning you in data.
Phase 2: Locate Your Data Sources
Once you have your "must-know" numbers, the next question is simple: where does that information live? Your KPIs are likely scattered across a few tools. For instance, MRR is in Stripe, CAC is in Google Ads, and user activity is in a Postgres database.
Make a simple list mapping each KPI to its source. The goal is to create a road map so you know where to point your automation tool.
Phase 3: Connect and Automate
This is the payoff. A modern tool like Statspresso makes it easy. Instead of wrestling with custom integrations, you use pre-built connectors. Statspresso offers one-click connections for popular sources like Postgres, Shopify, and HubSpot.
You connect your source, and the system does the heavy lifting. No need to write SQL or bug an engineer. As a Conversational AI Data Analyst, Statspresso lets you start asking questions right away. It's not just about simple metrics; smart automation involves closing the feedback loop with AI and automation to find deeper insights.
Try asking Statspresso: 'Show me my top 10 selling products this quarter.'
This three-phase approach—Identify, Locate, Connect—turns a six-month engineering nightmare into a weekend project. Start small, get a quick win, and build momentum.
Uncovering Trends With Historical Data
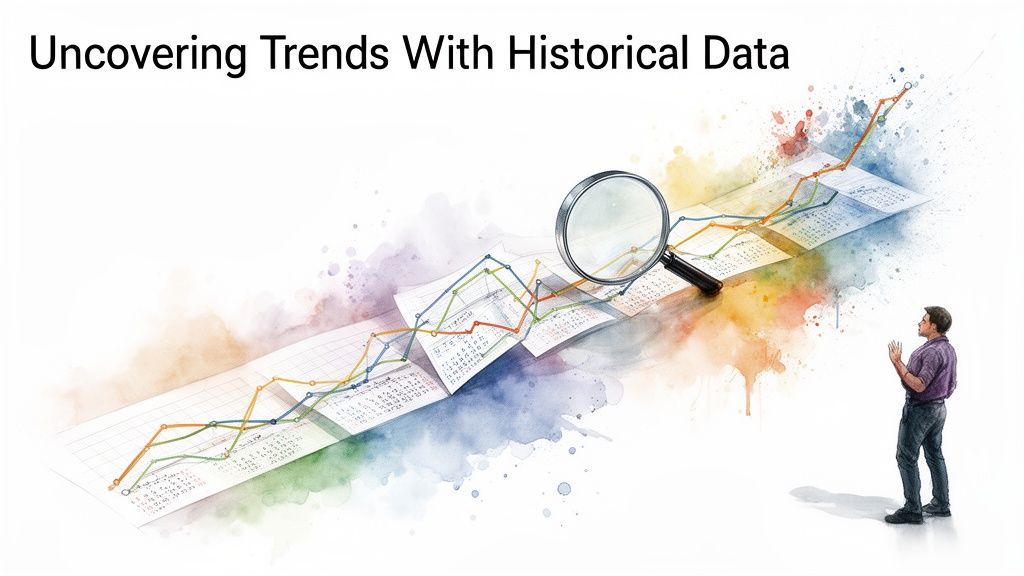
A good dashboard tells you what’s happening now. A great one tells you how you got here. Without historical context, you're missing the plot. Automating your dashboards to track metrics over time is how you uncover the patterns and seasonality that drive your business. Is that dip in sales a panic-worthy event or just a predictable January slump? You can read more in these insights on data-driven decision making.
The Power of Looking Backwards
Automating historical views builds your company’s institutional memory. This is massively efficient. Studies show that automated historical reporting cuts analysis time by 65%. You can learn more about how automation is transforming data monitoring.
This is where a Conversational AI Data Analyst like Statspresso changes everything. It makes digging into historical data effortless. Forget exporting old files. Just ask.
Try asking Statspresso: "Compare our Q1 revenue this year to last year as a line chart."
From Historical Data to Future Predictions
Once you have a reliable view of your past, you unlock a powerful new capability: forecasting. When you can see trends and cycles, you can make more accurate predictions.
Anticipate resource needs: Spot growth trends to know when to hire that next salesperson.
Improve inventory management: Understand seasonal sales to avoid stockouts.
Set realistic goals: Base revenue targets on actual growth rates, not wishful thinking.
The best part? You skip the SQL and complex data modeling. You just ask your data a question about its past and get an immediate, visualized answer.
Key Takeaways (The TL;DR)
We've covered a lot, but it all boils down to a few core ideas.
Manual Reporting Is a Bottleneck: Relying on SQL queries and spreadsheets is slow, error-prone, and burns out your best people.
Automation Creates Trust: Connecting your tools directly to a dashboard creates a single source of truth. The data is live, reliable, and always on.
Conversational AI Unlocks Access: The real game-changer is you no longer need to be a data expert to get answers. With a Conversational AI Data Analyst like Statspresso, anyone can ask questions in plain English and get insights in seconds. Skip the SQL. Just ask your data a question.
Don't Just Read About It—Solve It
Knowing there’s a better way is one thing. Experiencing it is another. The frustrating delay between a critical business question and a clear answer is a problem you can solve right now.
Instead of waiting weeks for a report, you can have answers in minutes. The power to have a conversation with your data is here. Connect your first data source for free and ask your first question. See for yourself how quickly you can go from wondering to knowing.
Frequently Asked Questions About Dashboard Automation
Bringing in a new tool that touches your data? It's smart to have questions. Here are honest answers to what we hear most.
Is My Data Secure When I Connect It?
Yes, absolutely. Security is our foundation, not an afterthought.
When you connect a source like your Postgres database or Shopify store, Statspresso uses read-only access. This is crucial. We can query your data to build charts, but we have zero ability to change, update, or delete your original information. Your source data remains untouched.
Plus, all data is encrypted both in transit and at rest using industry-standard protocols. It’s like giving a consultant a key to read books in your library, but they can't write in them or take them, and the library is inside a vault.
How Long Does It Take To Set Up?
Forget massive IT projects. For common sources like Stripe, Postgres, or your marketing platform, you can be connected and asking your first question in under five minutes.
We’ve built secure, ready-to-go connectors. The process is three quick steps:
Pick your data source.
Enter your credentials in a secure form.
Click "Connect."
That’s it. Statspresso is designed to get you from setup to insight instantly.
Try asking this right after you connect: 'Show me my total sales from last week.'
Does This Replace My Data Analyst?
Not at all. It makes them superhuman. Most data analysts spend up to 70% of their day on routine data pulls and building the same reports over and over. It's a huge bottleneck.
Statspresso, our Conversational AI Data Analyst, partners with your team by automating the grunt work.
Your business team gets instant, self-service answers to daily questions without filing a ticket.
Your data analyst is freed from that repetitive cycle. They can finally dig into high-impact projects that move the needle, like building predictive models.
Think of it this way: Statspresso handles the ad-hoc requests, letting your senior analyst focus on the big-picture questions. You skip the SQL for routine reports and empower your whole team.
Stop waiting for data. Statspresso is the Conversational AI Data Analyst that turns your questions into charts in seconds.
Connect your first data source for free and ask your first question.
Waiting weeks for a data analyst to build a dashboard is a relic of the past. If you're still stuck in that cycle of email requests, complex SQL, and copy-pasting into spreadsheets, you're not just slow—you're burning valuable time. The truth is, by the time that report hits your inbox, the data is already stale. Dashboard automation fixes this. It's about getting real-time answers so you can make decisions that actually drive growth.
Let's cut to the chase.
The Old Way vs. The New Way
The old BI workflow is agonizingly slow. It creates data silos and is riddled with human error. A single bad formula can derail your strategy. This is exactly where a Conversational AI Data Analyst like Statspresso changes the game. Instead of filing a ticket and waiting, you just ask a question.
Here’s how the two approaches stack up. It’s not even a fair fight.
Metric | The Old Way (Manual SQL & Spreadsheets) | The New Way (Statspresso & Automation) |
|---|---|---|
Time to Insight | Days or weeks. Hope your analyst is in a good mood. | Seconds. Just ask a question. |
Data Freshness | Stale the moment it's exported. | Always live, always real-time. |
Accuracy | High risk of copy-paste errors and bad formulas. | Error-free, thanks to direct data connections. |
Accessibility | Trapped in an email attachment. | Accessible to your whole team, anytime. |
Effort Required | 10-12 hours of mind-numbing manual work per week. | Set it up once. It runs forever. |
The table makes it obvious: the manual process is broken. It simply can't keep up with the pace of modern business. With Statspresso, you skip the SQL and get a chart in seconds.
Try asking Statspresso: "Show me my revenue by month for the last year as a bar chart."
This shift isn't a small tweak. A 2026 industry report from Gartner highlights that companies adopting "GenBI" (Generative Business Intelligence) are out-pacing competitors by over 40% in decision speed. Why? Because they move from data wrangling to data action.
If you want to dive deeper, we have a detailed guide on how you can automate your reports and dashboards.
So, What Is Dashboard Automation, Really?
Forget the corporate speak. Think of dashboard automation as an employee who works 24/7. Their only job is to fetch, clean, and organize your business data so it’s always ready for you. No coffee breaks, no vacation days.
In simple terms, it's a system that automatically connects to all your data sources—your Shopify store, your HubSpot CRM, your team's Postgres database—and pulls the latest numbers on a schedule. It instantly updates every chart and KPI on your dashboard. No more manually exporting CSVs or copy-pasting into spreadsheets. Your reports are always live, accurate, and require zero hands-on effort.
How It Works Under the Hood
The process feels like magic, but it’s just smart tech. Here’s a quick, no-fluff breakdown:
Data Connectors: These are the keys that securely unlock data from your platforms. A good system has a master key for everything from a Google Sheet to a complex data warehouse.
Refresh Scheduler: This is the alarm clock for your data. You tell it when to fetch new info—every hour, every day, whatever your business needs.
Visualization Layer: This is the part you see—the charts and graphs that turn raw numbers into clear insights.
This concept map shows the move from a manual mess to an automated workflow.
The difference is stark. You trade a slow, error-prone routine for a hands-off, reliable system.
This is where a Conversational AI Data Analyst like Statspresso shines. It handles all three parts for you, letting you skip the SQL entirely. You just ask a question in plain English, and it builds the visual for you.
Try asking Statspresso: 'Show me my new users by acquisition channel over the last 90 days.'
Ultimately, you stop spending time building reports and start spending it acting on the data.
Why Automated Dashboards Are a Startup Superpower
For a growing company, speed is everything. It’s the difference between seizing an opportunity and watching a competitor get there first. Dashboard automation isn't a nice-to-have; it's your secret weapon. It changes how fast your team can spot a trend, fix a problem, and make calls that drive growth.
Gain Unbeatable Speed to Insight
Think about the old way. You have a question, file a ticket, and... you wait. Days later, a spreadsheet lands in your inbox. The moment has passed. With dashboard automation, that question-to-answer cycle shrinks from weeks to seconds.
Imagine your marketing lead wants to check the ROI on a new campaign. Instead of begging for exports from HubSpot and Google Ads, they get a live view. This means you can adjust ad spend at 10 a.m. based on what happened at 9 a.m., not last week’s numbers. This shift away from static reports is detailed on Yellowfin's blog.
Establish a Single Source of Truth
How often have you seen sales and marketing show up with different numbers for the same metric? It happens constantly. Each team pulls data manually, creating conflicting "versions of the truth." Automated dashboarding ends this. By connecting directly to your core systems, it creates a single, unified view everyone trusts.
The arguments over "whose numbers are right" vanish. The conversation shifts to "What should we do next?" This is where a Conversational AI Data Analyst like Statspresso acts as the impartial referee, pulling real-time data to give everyone the same answer.
Empower True Data Self-Service
Your engineers are some of your most valuable people. So why are they wasting their days pulling CSVs? It’s a huge waste of talent. Dashboard automation gives your entire team the power of self-service analytics.
A product manager can check user engagement.
A founder can track real-time Monthly Recurring Revenue (MRR).
A marketing lead can monitor campaign performance.
They can do it all without writing a line of SQL or bugging an engineer. With a tool like Statspresso, it's as simple as asking a question.
Try asking Statspresso: 'Compare my ad spend vs conversions for the last month.'
This frees up your tech team to build a great product, not reports.
How to Implement Dashboard Automation the Smart Way
Getting started can feel overwhelming. People think they need to track every metric from day one. That’s a recipe for noisy, useless dashboards. Trust me, the smart way is to start small, prove the value, and then expand.
Forget perfection. It's about progress. The whole process boils down to three simple phases.
Phase 1: Identify Your Key Metrics
The biggest mistake is trying to track everything. A dashboard with 50 charts creates noise, not clarity. Instead, ask: "If I could only know five things about my business right now, what would they be?"
This forces you to focus on your most critical Key Performance Indicators (KPIs). For a startup, that list might be:
Monthly Recurring Revenue (MRR)
Customer Acquisition Cost (CAC)
Customer Churn Rate
Daily Active Users (DAU)
Lead-to-Conversion Rate
Seriously, limit yourself to 3-5 essential metrics. This gives you an immediate, valuable snapshot without drowning you in data.
Phase 2: Locate Your Data Sources
Once you have your "must-know" numbers, the next question is simple: where does that information live? Your KPIs are likely scattered across a few tools. For instance, MRR is in Stripe, CAC is in Google Ads, and user activity is in a Postgres database.
Make a simple list mapping each KPI to its source. The goal is to create a road map so you know where to point your automation tool.
Phase 3: Connect and Automate
This is the payoff. A modern tool like Statspresso makes it easy. Instead of wrestling with custom integrations, you use pre-built connectors. Statspresso offers one-click connections for popular sources like Postgres, Shopify, and HubSpot.
You connect your source, and the system does the heavy lifting. No need to write SQL or bug an engineer. As a Conversational AI Data Analyst, Statspresso lets you start asking questions right away. It's not just about simple metrics; smart automation involves closing the feedback loop with AI and automation to find deeper insights.
Try asking Statspresso: 'Show me my top 10 selling products this quarter.'
This three-phase approach—Identify, Locate, Connect—turns a six-month engineering nightmare into a weekend project. Start small, get a quick win, and build momentum.
Uncovering Trends With Historical Data
A good dashboard tells you what’s happening now. A great one tells you how you got here. Without historical context, you're missing the plot. Automating your dashboards to track metrics over time is how you uncover the patterns and seasonality that drive your business. Is that dip in sales a panic-worthy event or just a predictable January slump? You can read more in these insights on data-driven decision making.
The Power of Looking Backwards
Automating historical views builds your company’s institutional memory. This is massively efficient. Studies show that automated historical reporting cuts analysis time by 65%. You can learn more about how automation is transforming data monitoring.
This is where a Conversational AI Data Analyst like Statspresso changes everything. It makes digging into historical data effortless. Forget exporting old files. Just ask.
Try asking Statspresso: "Compare our Q1 revenue this year to last year as a line chart."
From Historical Data to Future Predictions
Once you have a reliable view of your past, you unlock a powerful new capability: forecasting. When you can see trends and cycles, you can make more accurate predictions.
Anticipate resource needs: Spot growth trends to know when to hire that next salesperson.
Improve inventory management: Understand seasonal sales to avoid stockouts.
Set realistic goals: Base revenue targets on actual growth rates, not wishful thinking.
The best part? You skip the SQL and complex data modeling. You just ask your data a question about its past and get an immediate, visualized answer.
Key Takeaways (The TL;DR)
We've covered a lot, but it all boils down to a few core ideas.
Manual Reporting Is a Bottleneck: Relying on SQL queries and spreadsheets is slow, error-prone, and burns out your best people.
Automation Creates Trust: Connecting your tools directly to a dashboard creates a single source of truth. The data is live, reliable, and always on.
Conversational AI Unlocks Access: The real game-changer is you no longer need to be a data expert to get answers. With a Conversational AI Data Analyst like Statspresso, anyone can ask questions in plain English and get insights in seconds. Skip the SQL. Just ask your data a question.
Don't Just Read About It—Solve It
Knowing there’s a better way is one thing. Experiencing it is another. The frustrating delay between a critical business question and a clear answer is a problem you can solve right now.
Instead of waiting weeks for a report, you can have answers in minutes. The power to have a conversation with your data is here. Connect your first data source for free and ask your first question. See for yourself how quickly you can go from wondering to knowing.
Frequently Asked Questions About Dashboard Automation
Bringing in a new tool that touches your data? It's smart to have questions. Here are honest answers to what we hear most.
Is My Data Secure When I Connect It?
Yes, absolutely. Security is our foundation, not an afterthought.
When you connect a source like your Postgres database or Shopify store, Statspresso uses read-only access. This is crucial. We can query your data to build charts, but we have zero ability to change, update, or delete your original information. Your source data remains untouched.
Plus, all data is encrypted both in transit and at rest using industry-standard protocols. It’s like giving a consultant a key to read books in your library, but they can't write in them or take them, and the library is inside a vault.
How Long Does It Take To Set Up?
Forget massive IT projects. For common sources like Stripe, Postgres, or your marketing platform, you can be connected and asking your first question in under five minutes.
We’ve built secure, ready-to-go connectors. The process is three quick steps:
Pick your data source.
Enter your credentials in a secure form.
Click "Connect."
That’s it. Statspresso is designed to get you from setup to insight instantly.
Try asking this right after you connect: 'Show me my total sales from last week.'
Does This Replace My Data Analyst?
Not at all. It makes them superhuman. Most data analysts spend up to 70% of their day on routine data pulls and building the same reports over and over. It's a huge bottleneck.
Statspresso, our Conversational AI Data Analyst, partners with your team by automating the grunt work.
Your business team gets instant, self-service answers to daily questions without filing a ticket.
Your data analyst is freed from that repetitive cycle. They can finally dig into high-impact projects that move the needle, like building predictive models.
Think of it this way: Statspresso handles the ad-hoc requests, letting your senior analyst focus on the big-picture questions. You skip the SQL for routine reports and empower your whole team.
Stop waiting for data. Statspresso is the Conversational AI Data Analyst that turns your questions into charts in seconds.
Connect your first data source for free and ask your first question.