Cross-Channel Reporting Guide (2026)

Stop Juggling Tabs: A Founder's Guide to Cross-Channel Reporting
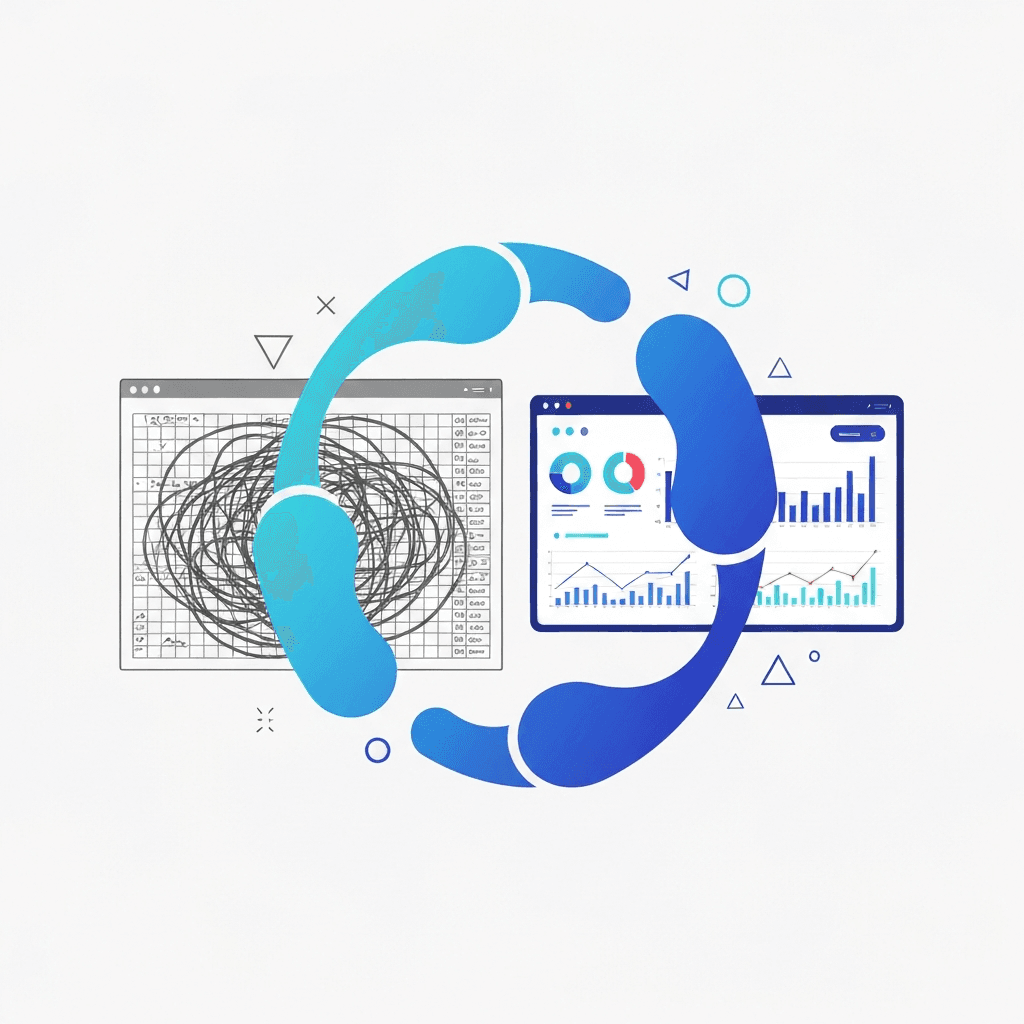
It's the end of the month, and the ritual begins. You open a tab for Google Ads. Another for Meta Ads. One for LinkedIn. Google Analytics 4. Your CRM. Maybe even Stripe. You painstakingly export CSV files, wrangle them into a monstrous spreadsheet, and pray the VLOOKUPs don't break. Your goal is to answer a seemingly simple question: "Is our marketing actually working?" By the time you have a semblance of an answer, it’s already outdated. This chaotic, time-consuming process is a reality for too many businesses in 2026.
The core problem is data silos. Each marketing platform provides a detailed, but narrow, view of its own performance. But your customers don't live in a silo. Their journey is fluid, often starting with a LinkedIn ad, followed by a Google search, and ending after seeing a retargeting ad on Instagram. To truly understand performance, you need to see the entire picture, not just isolated snapshots. This is where cross-channel reporting comes in. It’s the practice of breaking down those data walls to build a single, unified view of your entire marketing engine. For a deeper dive into the overall strategy, our A Guide to Cross Channel Marketing That Drives Growth is an excellent starting point. This guide, however, focuses on the practical 'how-to'—transforming fragmented data into your single source of truth.
What is Cross-Channel Reporting (And Why Is It So Hard)?
Cross-channel reporting is the process of consolidating data from various marketing channels into one centralized dashboard to analyze overall campaign performance and the complete customer journey. It’s fundamentally different from multi-channel reporting. Multi-channel reporting looks at each channel in isolation. You might have a great Google Ads report and a great Facebook Ads report, but they don't talk to each other. It’s like having the individual recipes for flour, sugar, and eggs but no instructions on how to bake a cake.
Cross-channel reporting is the complete recipe. It tells you how the ingredients work together, allowing you to measure the blended Cost-per-Acquisition (CPA) and the true Return on Ad Spend (ROAS) across your entire marketing budget. The strategic value is immense, but executing it has historically been a significant challenge for several key reasons:
Pervasive Data Silos: Every ad platform—from Google to TikTok to LinkedIn—is its own walled garden. They have unique APIs, data structures, and reporting interfaces. Extracting and combining this data manually is the primary bottleneck.
Attribution Complexity: If a customer clicks a Facebook ad, then a Google ad, then converts, who gets the credit? A siloed view makes it impossible to answer this. A unified dataset is the prerequisite for any meaningful attribution modeling beyond simplistic last-touch analysis.
Inconsistent Metrics: An "engagement" on LinkedIn is not the same as a "view" on YouTube. A "click" in Google Search has different intent than a "click" on a display banner. Standardizing these metrics (or knowing when not to) requires a layer of transformation and business logic that spreadsheets handle poorly.
Manual Labor and Human Error: The copy-paste-and-pray method of spreadsheet reporting is not just slow; it's fragile. A single incorrect formula or misplaced column can invalidate an entire report, leading to decisions based on flawed data. It’s a process that simply doesn’t scale.
These challenges are why so many businesses remain stuck in a reactive loop, analyzing the past instead of proactively shaping the future. A modern approach eliminates these hurdles through automation.
The Core Components of a Powerful Cross-Channel Dashboard
Before you build anything, you need a blueprint. A truly effective cross-channel dashboard isn’t a data dump; it’s a curated, opinionated view of the metrics that matter most to business growth. It should tell a clear story from initial ad impression to final revenue.

Here are the essential components to include:
1. Data Sources and Integration
The foundation of your dashboard is reliable, automated data integration. This means connecting directly to the APIs of your marketing and business platforms. Your source list should include:
Ad Platforms: Google Ads, Meta (Facebook & Instagram) Ads, LinkedIn Ads, TikTok Ads, etc.
Web Analytics: Google Analytics 4 (GA4) is essential for on-site behavior and conversion tracking.
CRM: HubSpot, Salesforce, or your proprietary system to track lead quality and sales pipeline data.
Revenue Data: Stripe, Braintree, or your e-commerce platform to connect spend directly to revenue.
2. Key Metrics: The Full-Funnel View
Organize your dashboard to mirror the customer journey. This provides a logical flow and makes it easy to spot bottlenecks.
Top-of-Funnel (Awareness & Reach): These metrics tell you if you're reaching your target audience. Track Total Impressions, Reach, and CPM (Cost Per Mille). At a glance, you should be able to see your total ad visibility and cost across all platforms.
Mid-Funnel (Engagement & Consideration): This is where you measure interest. Focus on Total Clicks, CTR (Click-Through Rate), and blended CPC (Cost Per Click). This helps you understand which channels are most efficient at driving traffic.
Bottom-of-Funnel (Conversion): The moment of truth. Track Total Conversions (e.g., lead form fills, sign-ups, purchases), Conversion Rate, and your blended CPA (Cost Per Acquisition). This is the single most important metric for many performance marketers.
Post-Conversion (Revenue & ROI): This is what separates good reporting from great reporting. By integrating revenue data, you can track Total Revenue, ROAS (Return On Ad Spend), and ultimately, LTV (Customer Lifetime Value) to CAC (Customer Acquisition Cost) ratio. This connects marketing effort directly to business impact.
3. Essential Visualizations
How you display your data is as important as the data itself. The goal is clarity and immediate insight. For a comprehensive overview, review these 10 Data Visualization Best Practices That Actually Work in 2026.
KPI Scorecards: Big, bold numbers at the top of your dashboard for your North Star metrics: Total Spend, Total Revenue, Blended ROAS, Total Conversions. These should include comparison periods (e.g., vs. previous month) to provide instant context.
Time-Series Charts: Line graphs are perfect for tracking performance over time. Plotting Spend vs. Revenue on the same chart can instantly reveal the relationship between investment and return.
Bar/Column Charts: Use these for direct comparisons. A stacked column chart showing spend by channel, or a bar chart comparing CPA across Facebook, Google, and LinkedIn, provides immediate clarity on channel efficiency.
Tables: While less visually exciting, tables are crucial for granular detail. A table breaking down performance by campaign, with columns for Spend, Conversions, and CPA, is an indispensable tool for optimization.
How to Build Your Cross-Channel Report: A Step-by-Step Guide
Now, let's move from theory to practice. There are two paths to building your report: the manual way and the automated way. Understanding the manual process is useful primarily to appreciate the immense value of automation.
Step 1: Define Your North Star Question
Don't start by pulling data. Start by asking a question. What is the single most important thing you need to know? Examples include:
"What is our true, blended ROAS across all paid marketing channels for Q1?"
"Which channel is acquiring customers with the highest LTV most efficiently?"
"How is our campaign 'X' performing across Google and Facebook combined?"
This question will guide every subsequent step and prevent you from building a dashboard that’s full of data but empty of insights.
Step 2: The Manual Method (The Spreadsheet Nightmare)
Data Export: Log in to each platform (Google Ads, Meta, etc.) and export your campaign data for the desired date range as a CSV file.
Data Cleaning & Standardization: This is the most painful step. Each platform uses different column names ('Campaign' vs. 'Campaign Name'). You must manually rename columns to create a consistent structure. You'll also need to ensure date formats match. This process is complex, and our guide on How to Clean Up Data in 2026 can help navigate the complexities.
Data Aggregation: Combine all the cleaned CSVs into a single master sheet in Google Sheets or Excel.
Calculations & Pivot Tables: Use SUMIFs, VLOOKUPs, and other formulas to aggregate your key metrics. Create pivot tables to summarize performance by channel, campaign, etc.
Chart Creation: Build charts and graphs from your pivot tables to visualize the results.
The Verdict: While technically possible, this method is slow, unsustainable, and incredibly prone to error. The report is obsolete the moment you create it, and the weekly effort required is a massive drain on resources.
Step 3: The Automated Method (The Modern BI Approach)
This approach leverages a modern business intelligence platform to do all the heavy lifting for you.
Connect Data Sources: Instead of exporting CSVs, you use pre-built connectors. You authenticate your Google Ads, Meta Ads, and other accounts once, and the platform handles the data pipeline.
Automated ETL: The tool automatically Extracts the data from the source, Transforms it into a standardized format, and Loads it into a performance-optimized database. No more cleaning CSVs.
Build Your Dashboard: Use a drag-and-drop interface or, even better, an AI-powered assistant to create your visualizations. You can simply ask a question in plain English like, "Show me our CPA by channel for the last 30 days as a bar chart." Tools with this capability essentially provide you with an on-demand analyst. To understand this new paradigm, read our guide on What Is an AI Data Assistant and Why You Need One.
Schedule & Share: Set your data to refresh automatically—hourly or daily. Your dashboard is always up-to-date. You can then share a live link with your team or schedule PDF/email reports.
The Verdict: This method takes a few hours to set up once, and then runs on autopilot. It provides real-time, reliable data, freeing up your team to focus on analysis and strategy instead of manual data entry.
Advanced Cross-Channel Analysis: Beyond Basic Reporting
Once your automated dashboard is live, you can move beyond simple reporting and into a world of strategic analysis.
Holistic Pacing Analysis: Instead of checking budgets in each platform, create a single view that shows your total spend across all channels against your overall monthly or quarterly budget. This allows you to reallocate funds from underperforming to overperforming channels in real-time.
Unified Creative Analysis: Use a consistent campaign naming convention that includes variables like creative angle or audience type (e.g., `US_Q1_Video-Testimonial_Prospecting`). With a unified dashboard, you can filter for "Video-Testimonial" and instantly see how that creative angle performs across every channel, giving you much faster insights into what resonates with your market.
Connecting Ad Spend to Revenue: This is the holy grail. By joining your ad platform data (spend, clicks) with your CRM or payment processor data (deal size, new MRR, subscription status), you can definitively answer the question: "For every dollar we put into LinkedIn ads, how many dollars in new revenue are we generating?" This is the analysis that gets you a bigger budget.
From Data Chaos to Strategic Clarity
In 2026, cross-channel reporting is no longer a luxury reserved for enterprises with dedicated data teams. The rise of modern, AI-powered BI platforms has democratized this capability. Moving away from manual spreadsheets to an automated, unified dashboard is one of the highest-leverage investments a marketing team or founder can make.
The benefits are transformative: you save dozens of hours per month, eliminate costly data errors, and empower your team to make faster, smarter decisions. You can finally stop guessing and start building a marketing engine where every dollar of spend is accounted for and optimized for maximum return. The era of juggling tabs is over. It's time for a single source of truth.
Stop Juggling Tabs: A Founder's Guide to Cross-Channel Reporting
It's the end of the month, and the ritual begins. You open a tab for Google Ads. Another for Meta Ads. One for LinkedIn. Google Analytics 4. Your CRM. Maybe even Stripe. You painstakingly export CSV files, wrangle them into a monstrous spreadsheet, and pray the VLOOKUPs don't break. Your goal is to answer a seemingly simple question: "Is our marketing actually working?" By the time you have a semblance of an answer, it’s already outdated. This chaotic, time-consuming process is a reality for too many businesses in 2026.
The core problem is data silos. Each marketing platform provides a detailed, but narrow, view of its own performance. But your customers don't live in a silo. Their journey is fluid, often starting with a LinkedIn ad, followed by a Google search, and ending after seeing a retargeting ad on Instagram. To truly understand performance, you need to see the entire picture, not just isolated snapshots. This is where cross-channel reporting comes in. It’s the practice of breaking down those data walls to build a single, unified view of your entire marketing engine. For a deeper dive into the overall strategy, our A Guide to Cross Channel Marketing That Drives Growth is an excellent starting point. This guide, however, focuses on the practical 'how-to'—transforming fragmented data into your single source of truth.
What is Cross-Channel Reporting (And Why Is It So Hard)?
Cross-channel reporting is the process of consolidating data from various marketing channels into one centralized dashboard to analyze overall campaign performance and the complete customer journey. It’s fundamentally different from multi-channel reporting. Multi-channel reporting looks at each channel in isolation. You might have a great Google Ads report and a great Facebook Ads report, but they don't talk to each other. It’s like having the individual recipes for flour, sugar, and eggs but no instructions on how to bake a cake.
Cross-channel reporting is the complete recipe. It tells you how the ingredients work together, allowing you to measure the blended Cost-per-Acquisition (CPA) and the true Return on Ad Spend (ROAS) across your entire marketing budget. The strategic value is immense, but executing it has historically been a significant challenge for several key reasons:
Pervasive Data Silos: Every ad platform—from Google to TikTok to LinkedIn—is its own walled garden. They have unique APIs, data structures, and reporting interfaces. Extracting and combining this data manually is the primary bottleneck.
Attribution Complexity: If a customer clicks a Facebook ad, then a Google ad, then converts, who gets the credit? A siloed view makes it impossible to answer this. A unified dataset is the prerequisite for any meaningful attribution modeling beyond simplistic last-touch analysis.
Inconsistent Metrics: An "engagement" on LinkedIn is not the same as a "view" on YouTube. A "click" in Google Search has different intent than a "click" on a display banner. Standardizing these metrics (or knowing when not to) requires a layer of transformation and business logic that spreadsheets handle poorly.
Manual Labor and Human Error: The copy-paste-and-pray method of spreadsheet reporting is not just slow; it's fragile. A single incorrect formula or misplaced column can invalidate an entire report, leading to decisions based on flawed data. It’s a process that simply doesn’t scale.
These challenges are why so many businesses remain stuck in a reactive loop, analyzing the past instead of proactively shaping the future. A modern approach eliminates these hurdles through automation.
The Core Components of a Powerful Cross-Channel Dashboard
Before you build anything, you need a blueprint. A truly effective cross-channel dashboard isn’t a data dump; it’s a curated, opinionated view of the metrics that matter most to business growth. It should tell a clear story from initial ad impression to final revenue.
Here are the essential components to include:
1. Data Sources and Integration
The foundation of your dashboard is reliable, automated data integration. This means connecting directly to the APIs of your marketing and business platforms. Your source list should include:
Ad Platforms: Google Ads, Meta (Facebook & Instagram) Ads, LinkedIn Ads, TikTok Ads, etc.
Web Analytics: Google Analytics 4 (GA4) is essential for on-site behavior and conversion tracking.
CRM: HubSpot, Salesforce, or your proprietary system to track lead quality and sales pipeline data.
Revenue Data: Stripe, Braintree, or your e-commerce platform to connect spend directly to revenue.
2. Key Metrics: The Full-Funnel View
Organize your dashboard to mirror the customer journey. This provides a logical flow and makes it easy to spot bottlenecks.
Top-of-Funnel (Awareness & Reach): These metrics tell you if you're reaching your target audience. Track Total Impressions, Reach, and CPM (Cost Per Mille). At a glance, you should be able to see your total ad visibility and cost across all platforms.
Mid-Funnel (Engagement & Consideration): This is where you measure interest. Focus on Total Clicks, CTR (Click-Through Rate), and blended CPC (Cost Per Click). This helps you understand which channels are most efficient at driving traffic.
Bottom-of-Funnel (Conversion): The moment of truth. Track Total Conversions (e.g., lead form fills, sign-ups, purchases), Conversion Rate, and your blended CPA (Cost Per Acquisition). This is the single most important metric for many performance marketers.
Post-Conversion (Revenue & ROI): This is what separates good reporting from great reporting. By integrating revenue data, you can track Total Revenue, ROAS (Return On Ad Spend), and ultimately, LTV (Customer Lifetime Value) to CAC (Customer Acquisition Cost) ratio. This connects marketing effort directly to business impact.
3. Essential Visualizations
How you display your data is as important as the data itself. The goal is clarity and immediate insight. For a comprehensive overview, review these 10 Data Visualization Best Practices That Actually Work in 2026.
KPI Scorecards: Big, bold numbers at the top of your dashboard for your North Star metrics: Total Spend, Total Revenue, Blended ROAS, Total Conversions. These should include comparison periods (e.g., vs. previous month) to provide instant context.
Time-Series Charts: Line graphs are perfect for tracking performance over time. Plotting Spend vs. Revenue on the same chart can instantly reveal the relationship between investment and return.
Bar/Column Charts: Use these for direct comparisons. A stacked column chart showing spend by channel, or a bar chart comparing CPA across Facebook, Google, and LinkedIn, provides immediate clarity on channel efficiency.
Tables: While less visually exciting, tables are crucial for granular detail. A table breaking down performance by campaign, with columns for Spend, Conversions, and CPA, is an indispensable tool for optimization.
How to Build Your Cross-Channel Report: A Step-by-Step Guide
Now, let's move from theory to practice. There are two paths to building your report: the manual way and the automated way. Understanding the manual process is useful primarily to appreciate the immense value of automation.
Step 1: Define Your North Star Question
Don't start by pulling data. Start by asking a question. What is the single most important thing you need to know? Examples include:
"What is our true, blended ROAS across all paid marketing channels for Q1?"
"Which channel is acquiring customers with the highest LTV most efficiently?"
"How is our campaign 'X' performing across Google and Facebook combined?"
This question will guide every subsequent step and prevent you from building a dashboard that’s full of data but empty of insights.
Step 2: The Manual Method (The Spreadsheet Nightmare)
Data Export: Log in to each platform (Google Ads, Meta, etc.) and export your campaign data for the desired date range as a CSV file.
Data Cleaning & Standardization: This is the most painful step. Each platform uses different column names ('Campaign' vs. 'Campaign Name'). You must manually rename columns to create a consistent structure. You'll also need to ensure date formats match. This process is complex, and our guide on How to Clean Up Data in 2026 can help navigate the complexities.
Data Aggregation: Combine all the cleaned CSVs into a single master sheet in Google Sheets or Excel.
Calculations & Pivot Tables: Use SUMIFs, VLOOKUPs, and other formulas to aggregate your key metrics. Create pivot tables to summarize performance by channel, campaign, etc.
Chart Creation: Build charts and graphs from your pivot tables to visualize the results.
The Verdict: While technically possible, this method is slow, unsustainable, and incredibly prone to error. The report is obsolete the moment you create it, and the weekly effort required is a massive drain on resources.
Step 3: The Automated Method (The Modern BI Approach)
This approach leverages a modern business intelligence platform to do all the heavy lifting for you.
Connect Data Sources: Instead of exporting CSVs, you use pre-built connectors. You authenticate your Google Ads, Meta Ads, and other accounts once, and the platform handles the data pipeline.
Automated ETL: The tool automatically Extracts the data from the source, Transforms it into a standardized format, and Loads it into a performance-optimized database. No more cleaning CSVs.
Build Your Dashboard: Use a drag-and-drop interface or, even better, an AI-powered assistant to create your visualizations. You can simply ask a question in plain English like, "Show me our CPA by channel for the last 30 days as a bar chart." Tools with this capability essentially provide you with an on-demand analyst. To understand this new paradigm, read our guide on What Is an AI Data Assistant and Why You Need One.
Schedule & Share: Set your data to refresh automatically—hourly or daily. Your dashboard is always up-to-date. You can then share a live link with your team or schedule PDF/email reports.
The Verdict: This method takes a few hours to set up once, and then runs on autopilot. It provides real-time, reliable data, freeing up your team to focus on analysis and strategy instead of manual data entry.
Advanced Cross-Channel Analysis: Beyond Basic Reporting
Once your automated dashboard is live, you can move beyond simple reporting and into a world of strategic analysis.
Holistic Pacing Analysis: Instead of checking budgets in each platform, create a single view that shows your total spend across all channels against your overall monthly or quarterly budget. This allows you to reallocate funds from underperforming to overperforming channels in real-time.
Unified Creative Analysis: Use a consistent campaign naming convention that includes variables like creative angle or audience type (e.g., `US_Q1_Video-Testimonial_Prospecting`). With a unified dashboard, you can filter for "Video-Testimonial" and instantly see how that creative angle performs across every channel, giving you much faster insights into what resonates with your market.
Connecting Ad Spend to Revenue: This is the holy grail. By joining your ad platform data (spend, clicks) with your CRM or payment processor data (deal size, new MRR, subscription status), you can definitively answer the question: "For every dollar we put into LinkedIn ads, how many dollars in new revenue are we generating?" This is the analysis that gets you a bigger budget.
From Data Chaos to Strategic Clarity
In 2026, cross-channel reporting is no longer a luxury reserved for enterprises with dedicated data teams. The rise of modern, AI-powered BI platforms has democratized this capability. Moving away from manual spreadsheets to an automated, unified dashboard is one of the highest-leverage investments a marketing team or founder can make.
The benefits are transformative: you save dozens of hours per month, eliminate costly data errors, and empower your team to make faster, smarter decisions. You can finally stop guessing and start building a marketing engine where every dollar of spend is accounted for and optimized for maximum return. The era of juggling tabs is over. It's time for a single source of truth.