Cross-Channel Reporting: The Complete 2026 Guide

Stop Juggling Tabs: Your Marketing Data Belongs in One Place
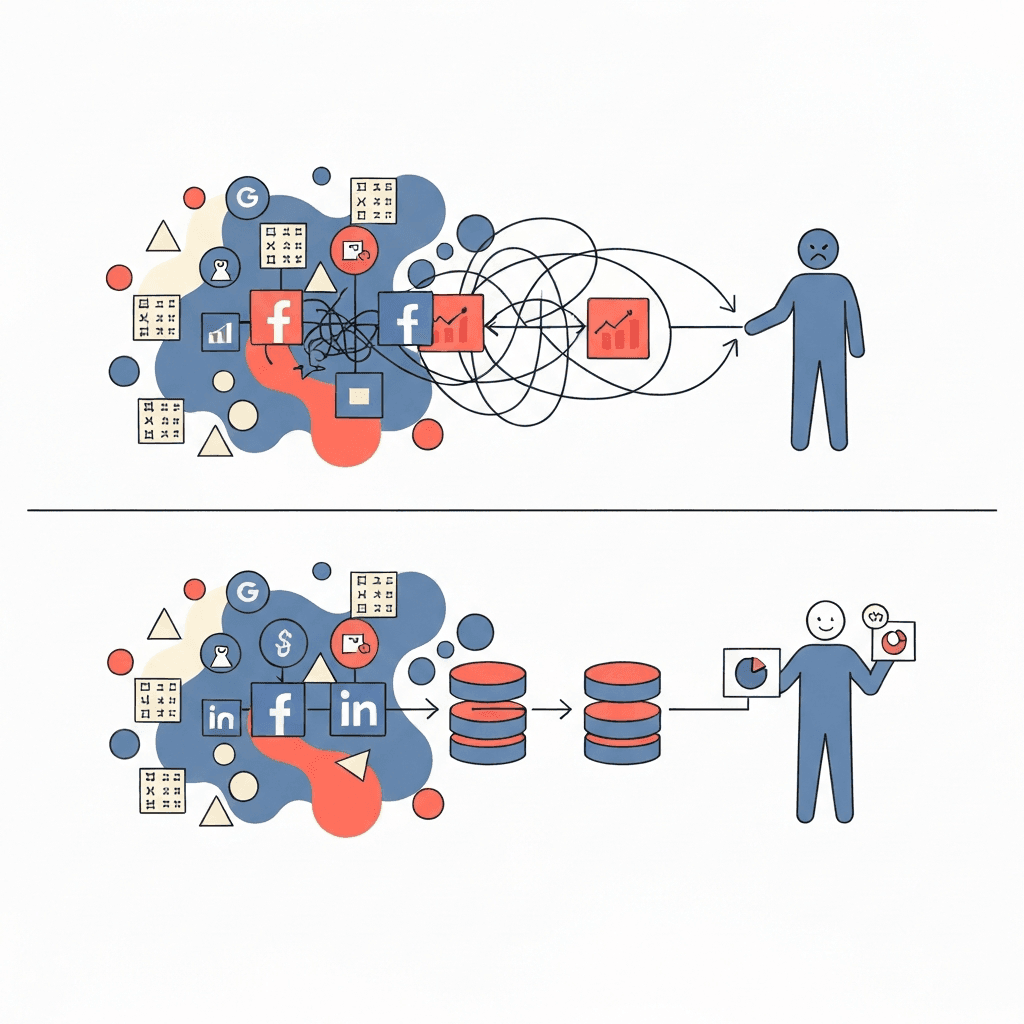
Your marketing team is brilliant, but they're spending hours a week acting like data entry clerks. They download CSVs from Google Ads, Meta Business Suite, LinkedIn Campaign Manager, and Google Analytics 4. They paste everything into a monstrous spreadsheet, fight with VLOOKUPs that break, and manually update charts for the weekly performance meeting. This “Franken-sheet” is slow, error-prone, and tells you what happened last week, not what you should do tomorrow. This entire process is a bottleneck to growth. The solution isn't a more complex spreadsheet; it's a complete shift in strategy to cross-channel reporting.
Cross-channel reporting is the practice of consolidating data from all your marketing channels into a single, unified view. It’s about creating a single source of truth that allows you to see the entire customer journey, accurately measure return on investment (ROI), and make intelligent budget decisions. Instead of guessing if your LinkedIn ads are influencing conversions that Google Analytics attributes to organic search, you'll know. This guide moves beyond the basics of A Guide to Cross Channel Marketing That Drives Growth and gives you a practical, step-by-step framework to build a reporting system that finally connects your ad spend to your revenue, no matter which platform it comes from.
Why Siloed Channel Data Is Killing Your ROI
Relying on individual platform dashboards for performance analysis is one of the most common—and costly—mistakes a startup can make in 2026. The Facebook Ads dashboard is designed to do one thing: convince you to spend more money on Facebook. The same is true for every other platform. They provide channel-specific vanity metrics that lack the context of your overall business goals.
Here are the core limitations you face when your data lives in silos:
Inaccurate Performance Measurement: You can't calculate a true, blended Customer Acquisition Cost (CAC) or Return on Ad Spend (ROAS) when your ad spend data is in four different platforms and your revenue data is in Stripe or HubSpot. You're left with channel-specific ROAS figures that don't account for the complex, multi-touch journey most customers take.
Opaque Customer Journeys: A customer might see a LinkedIn ad, click a Google search result a week later, and finally convert through an email campaign. No single platform can show you this entire path. Without a unified view, you're blind to how your channels work together, leading to poor budget allocation—like cutting the budget for an upper-funnel channel that’s actually generating valuable awareness.
Wasted Time and Resources: The most immediate pain is operational drag. Manually compiling reports is not a high-value activity. Every hour a marketing manager spends wrestling with spreadsheets is an hour they aren't spending on strategy, creative testing, or campaign optimization. This manual work also introduces a high risk of human error, where a simple copy-paste mistake can lead to decisions based on faulty data.
Delayed Decision-Making: Manual reporting is reactive. By the time you’ve built the report, the data is already old. In a competitive market, you need the ability to spot trends, catch anomalies, and pivot strategy in near real-time, not based on a report that took two days to assemble.
The Manual Method vs. The Automated Future
There are two ways to approach cross-channel reporting: the way most companies start, and the way successful companies scale.
The Manual Hell: Spreadsheets and Brute Force
This process is painfully familiar. It involves logging into each platform, setting the date range, exporting a CSV file, and repeating this for every data source. Then comes the “data cleanup” phase in Google Sheets or Excel, where you attempt to normalize naming conventions and stitch together datasets with different column structures. The final step is manually updating pivot tables and charts. This workflow isn't just inefficient; it’s fragile. One API change from a platform or an accidental deletion of a formula can break the entire report.
The Automated Approach: A Modern Data Workflow
The automated future eliminates these manual steps. It relies on a system where data connectors (APIs) automatically pull information from your sources at regular intervals. This data is fed into a central repository and then made available for analysis in a user-friendly interface. You build a dashboard once, and it updates automatically, freeing your team to focus on analysis and action, not data collection.
A 4-Step Framework to Build Your Cross-Channel Reporting System
Transitioning from manual chaos to automated clarity requires a structured approach. Follow these four steps to build a system that delivers reliable insights.
Step 1: Define Your North Star Metrics (KPIs)
Before you connect a single data source, you must define what you need to measure. Don’t fall into the trap of tracking everything. A good cross-channel dashboard focuses on a handful of KPIs that directly reflect business health. Group them into three categories:
Acquisition Metrics: How effectively are you attracting customers?
Blended Customer Acquisition Cost (CAC): (Total Marketing & Sales Spend) / (Number of New Customers). This is your single most important acquisition metric.
Cost Per Lead (CPL) by Channel: Essential for B2B and lead-gen businesses to understand which channels drive the most cost-effective leads.
Lead Velocity Rate (LVR): Measures the month-over-month growth in qualified leads. A leading indicator of future revenue.
Behavioral Metrics: What actions are users taking?
Lead-to-Customer Conversion Rate: (New Customers / Total Leads) * 100. How effective is your sales or nurturing process?
Funnel Drop-off Rates: What percentage of users move from one stage of the funnel to the next? Identify where the leaks are.
Outcome Metrics: Are you generating revenue profitably?
Return on Ad Spend (ROAS) by Channel: (Revenue from Channel) / (Ad Spend on Channel). Requires connecting ad spend data with transaction data.
Customer Lifetime Value (CLV): The total revenue a single customer is projected to generate. Critical for understanding how much you can afford to spend to acquire them.
Revenue by Channel: A clear breakdown of which channels are driving direct and influenced revenue.
Step 2: Identify and Map Your Data Sources
Make a comprehensive list of every tool that holds a piece of your customer journey puzzle. Common sources include:
Advertising Platforms: Google Ads, Meta Ads (Facebook & Instagram), LinkedIn Ads, TikTok Ads, X (Twitter) Ads.
Website & App Analytics: Google Analytics 4 (GA4), Mixpanel, Amplitude.
CRM & Sales Platforms: HubSpot, Salesforce, Pipedrive.
Payment & Billing Systems: Stripe, Braintree, Shopify, Chargebee.
Organic & Social Tools: Google Search Console, Sprout Social, Agorapulse.
Step 3: Choose Your Data Consolidation Method
This is where you decide on the engine for your reporting system. There are three main paths:
The Advanced Spreadsheet: Using tools like Supermetrics or Power Query to pull data directly into Google Sheets or Excel. This is a step up from pure manual work but can become slow and unwieldy as data volume grows. It’s a temporary fix, not a scalable solution.
The Composable Data Stack: This is the traditional, enterprise-grade approach. It involves using an ETL/ELT tool (like Fivetran or Airbyte) to pull data, a cloud data warehouse (like BigQuery or Snowflake) to store it, and a BI tool (like Tableau or Power BI) to visualize it. This method is incredibly powerful and flexible but requires significant technical expertise, setup time, and budget. It's often overkill for startups and SMBs.
The All-in-One Analytics Platform: A new breed of tools, like Statspresso, combines these functions into a single, user-friendly platform. They offer pre-built connectors for all your key data sources, handle the data storage and modeling behind the scenes, and provide an intuitive interface for building dashboards and asking questions using natural language. This is the fastest and most efficient path for non-technical teams who need answers now.
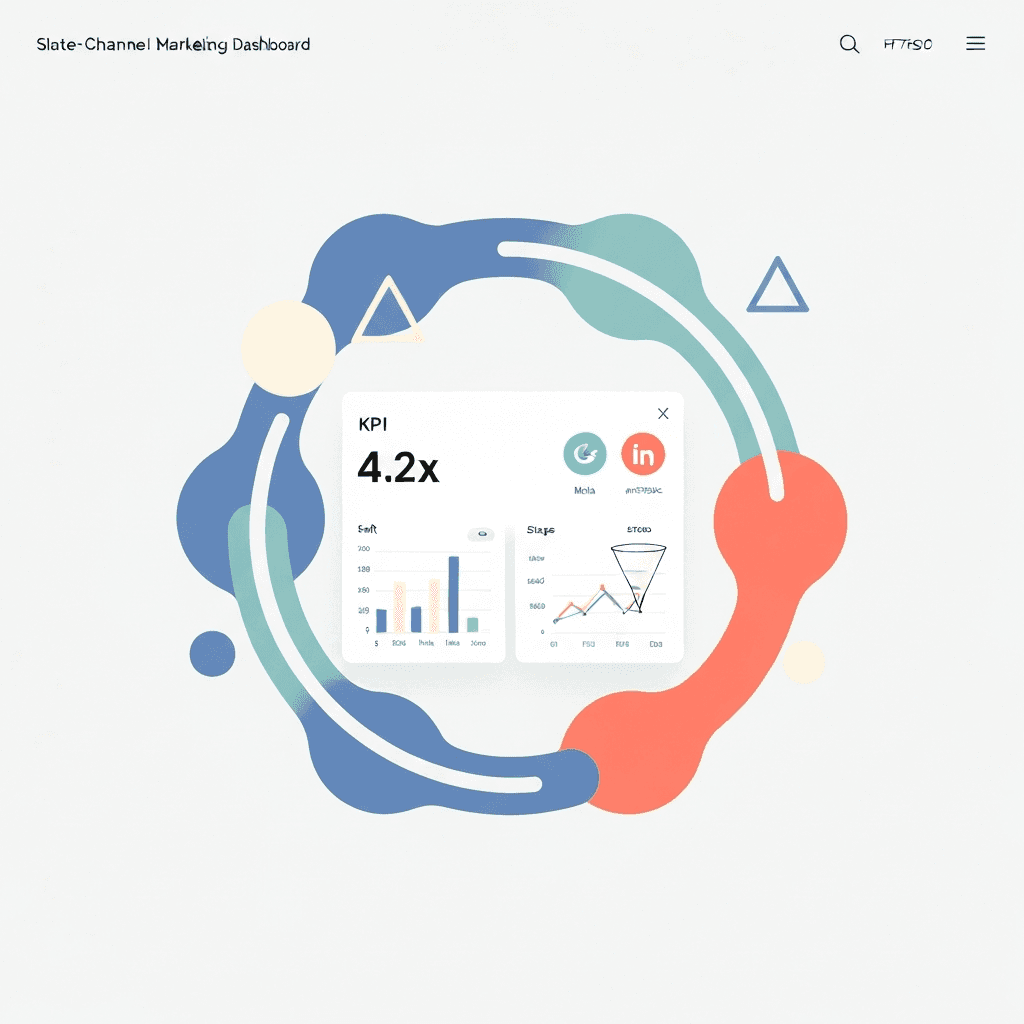
Step 4: Design and Build Your Master Dashboard
Your dashboard should tell a story, moving from a high-level overview down to granular details. A best-practice layout includes:
Top-Line Summary: Start with the most critical KPIs: Blended ROAS, Total Ad Spend, Total Revenue, Blended CAC, and New Customers for the selected time period (e.g., last 30 days).
Performance by Channel: A table or bar chart comparing key metrics (Spend, Revenue, ROAS, CAC, Conversions) across each channel (Google, Meta, LinkedIn, etc.). This immediately shows you what's working and what's not.
Funnel Visualization: A visual representation of your marketing funnel, from impressions/reach down to paying customers, showing the conversion rate at each stage.
Trend Lines: Line charts showing your key KPIs over time. Are you improving? Is there seasonality to your performance? This helps you understand momentum.
Overcoming Common Cross-Channel Reporting Hurdles
Building this system is not without its challenges. Here are the most common roadblocks and how to navigate them.
Data Discrepancies: You will inevitably find that Facebook reports 50 conversions while Google Analytics only attributes 35 to Facebook. This is normal. Platforms use different attribution models (e.g., 7-day click, 1-day view vs. data-driven attribution). The goal isn't to make the numbers match perfectly. The goal is to choose a single source of truth for your analysis (usually your analytics platform or consolidated BI tool) and use it consistently for decision-making.
Inconsistent Naming Conventions: Your biggest enemy is messy data. A campaign named `US_Q4_BlackFriday` in Google Ads and `black-friday-sale-us-2026` in Facebook Ads cannot be automatically grouped. Implement a strict, standardized UTM and campaign naming convention across all teams and platforms. Document this convention and enforce it.
Attribution Complexity: Deciding how to assign credit for a conversion is one of marketing's oldest challenges. Don't get stuck on finding the
Stop Juggling Tabs: Your Marketing Data Belongs in One Place
Your marketing team is brilliant, but they're spending hours a week acting like data entry clerks. They download CSVs from Google Ads, Meta Business Suite, LinkedIn Campaign Manager, and Google Analytics 4. They paste everything into a monstrous spreadsheet, fight with VLOOKUPs that break, and manually update charts for the weekly performance meeting. This “Franken-sheet” is slow, error-prone, and tells you what happened last week, not what you should do tomorrow. This entire process is a bottleneck to growth. The solution isn't a more complex spreadsheet; it's a complete shift in strategy to cross-channel reporting.
Cross-channel reporting is the practice of consolidating data from all your marketing channels into a single, unified view. It’s about creating a single source of truth that allows you to see the entire customer journey, accurately measure return on investment (ROI), and make intelligent budget decisions. Instead of guessing if your LinkedIn ads are influencing conversions that Google Analytics attributes to organic search, you'll know. This guide moves beyond the basics of A Guide to Cross Channel Marketing That Drives Growth and gives you a practical, step-by-step framework to build a reporting system that finally connects your ad spend to your revenue, no matter which platform it comes from.
Why Siloed Channel Data Is Killing Your ROI
Relying on individual platform dashboards for performance analysis is one of the most common—and costly—mistakes a startup can make in 2026. The Facebook Ads dashboard is designed to do one thing: convince you to spend more money on Facebook. The same is true for every other platform. They provide channel-specific vanity metrics that lack the context of your overall business goals.
Here are the core limitations you face when your data lives in silos:
Inaccurate Performance Measurement: You can't calculate a true, blended Customer Acquisition Cost (CAC) or Return on Ad Spend (ROAS) when your ad spend data is in four different platforms and your revenue data is in Stripe or HubSpot. You're left with channel-specific ROAS figures that don't account for the complex, multi-touch journey most customers take.
Opaque Customer Journeys: A customer might see a LinkedIn ad, click a Google search result a week later, and finally convert through an email campaign. No single platform can show you this entire path. Without a unified view, you're blind to how your channels work together, leading to poor budget allocation—like cutting the budget for an upper-funnel channel that’s actually generating valuable awareness.
Wasted Time and Resources: The most immediate pain is operational drag. Manually compiling reports is not a high-value activity. Every hour a marketing manager spends wrestling with spreadsheets is an hour they aren't spending on strategy, creative testing, or campaign optimization. This manual work also introduces a high risk of human error, where a simple copy-paste mistake can lead to decisions based on faulty data.
Delayed Decision-Making: Manual reporting is reactive. By the time you’ve built the report, the data is already old. In a competitive market, you need the ability to spot trends, catch anomalies, and pivot strategy in near real-time, not based on a report that took two days to assemble.
The Manual Method vs. The Automated Future
There are two ways to approach cross-channel reporting: the way most companies start, and the way successful companies scale.
The Manual Hell: Spreadsheets and Brute Force
This process is painfully familiar. It involves logging into each platform, setting the date range, exporting a CSV file, and repeating this for every data source. Then comes the “data cleanup” phase in Google Sheets or Excel, where you attempt to normalize naming conventions and stitch together datasets with different column structures. The final step is manually updating pivot tables and charts. This workflow isn't just inefficient; it’s fragile. One API change from a platform or an accidental deletion of a formula can break the entire report.
The Automated Approach: A Modern Data Workflow
The automated future eliminates these manual steps. It relies on a system where data connectors (APIs) automatically pull information from your sources at regular intervals. This data is fed into a central repository and then made available for analysis in a user-friendly interface. You build a dashboard once, and it updates automatically, freeing your team to focus on analysis and action, not data collection.
A 4-Step Framework to Build Your Cross-Channel Reporting System
Transitioning from manual chaos to automated clarity requires a structured approach. Follow these four steps to build a system that delivers reliable insights.
Step 1: Define Your North Star Metrics (KPIs)
Before you connect a single data source, you must define what you need to measure. Don’t fall into the trap of tracking everything. A good cross-channel dashboard focuses on a handful of KPIs that directly reflect business health. Group them into three categories:
Acquisition Metrics: How effectively are you attracting customers?
Blended Customer Acquisition Cost (CAC): (Total Marketing & Sales Spend) / (Number of New Customers). This is your single most important acquisition metric.
Cost Per Lead (CPL) by Channel: Essential for B2B and lead-gen businesses to understand which channels drive the most cost-effective leads.
Lead Velocity Rate (LVR): Measures the month-over-month growth in qualified leads. A leading indicator of future revenue.
Behavioral Metrics: What actions are users taking?
Lead-to-Customer Conversion Rate: (New Customers / Total Leads) * 100. How effective is your sales or nurturing process?
Funnel Drop-off Rates: What percentage of users move from one stage of the funnel to the next? Identify where the leaks are.
Outcome Metrics: Are you generating revenue profitably?
Return on Ad Spend (ROAS) by Channel: (Revenue from Channel) / (Ad Spend on Channel). Requires connecting ad spend data with transaction data.
Customer Lifetime Value (CLV): The total revenue a single customer is projected to generate. Critical for understanding how much you can afford to spend to acquire them.
Revenue by Channel: A clear breakdown of which channels are driving direct and influenced revenue.
Step 2: Identify and Map Your Data Sources
Make a comprehensive list of every tool that holds a piece of your customer journey puzzle. Common sources include:
Advertising Platforms: Google Ads, Meta Ads (Facebook & Instagram), LinkedIn Ads, TikTok Ads, X (Twitter) Ads.
Website & App Analytics: Google Analytics 4 (GA4), Mixpanel, Amplitude.
CRM & Sales Platforms: HubSpot, Salesforce, Pipedrive.
Payment & Billing Systems: Stripe, Braintree, Shopify, Chargebee.
Organic & Social Tools: Google Search Console, Sprout Social, Agorapulse.
Step 3: Choose Your Data Consolidation Method
This is where you decide on the engine for your reporting system. There are three main paths:
The Advanced Spreadsheet: Using tools like Supermetrics or Power Query to pull data directly into Google Sheets or Excel. This is a step up from pure manual work but can become slow and unwieldy as data volume grows. It’s a temporary fix, not a scalable solution.
The Composable Data Stack: This is the traditional, enterprise-grade approach. It involves using an ETL/ELT tool (like Fivetran or Airbyte) to pull data, a cloud data warehouse (like BigQuery or Snowflake) to store it, and a BI tool (like Tableau or Power BI) to visualize it. This method is incredibly powerful and flexible but requires significant technical expertise, setup time, and budget. It's often overkill for startups and SMBs.
The All-in-One Analytics Platform: A new breed of tools, like Statspresso, combines these functions into a single, user-friendly platform. They offer pre-built connectors for all your key data sources, handle the data storage and modeling behind the scenes, and provide an intuitive interface for building dashboards and asking questions using natural language. This is the fastest and most efficient path for non-technical teams who need answers now.
Step 4: Design and Build Your Master Dashboard
Your dashboard should tell a story, moving from a high-level overview down to granular details. A best-practice layout includes:
Top-Line Summary: Start with the most critical KPIs: Blended ROAS, Total Ad Spend, Total Revenue, Blended CAC, and New Customers for the selected time period (e.g., last 30 days).
Performance by Channel: A table or bar chart comparing key metrics (Spend, Revenue, ROAS, CAC, Conversions) across each channel (Google, Meta, LinkedIn, etc.). This immediately shows you what's working and what's not.
Funnel Visualization: A visual representation of your marketing funnel, from impressions/reach down to paying customers, showing the conversion rate at each stage.
Trend Lines: Line charts showing your key KPIs over time. Are you improving? Is there seasonality to your performance? This helps you understand momentum.
Overcoming Common Cross-Channel Reporting Hurdles
Building this system is not without its challenges. Here are the most common roadblocks and how to navigate them.
Data Discrepancies: You will inevitably find that Facebook reports 50 conversions while Google Analytics only attributes 35 to Facebook. This is normal. Platforms use different attribution models (e.g., 7-day click, 1-day view vs. data-driven attribution). The goal isn't to make the numbers match perfectly. The goal is to choose a single source of truth for your analysis (usually your analytics platform or consolidated BI tool) and use it consistently for decision-making.
Inconsistent Naming Conventions: Your biggest enemy is messy data. A campaign named `US_Q4_BlackFriday` in Google Ads and `black-friday-sale-us-2026` in Facebook Ads cannot be automatically grouped. Implement a strict, standardized UTM and campaign naming convention across all teams and platforms. Document this convention and enforce it.
Attribution Complexity: Deciding how to assign credit for a conversion is one of marketing's oldest challenges. Don't get stuck on finding the