What Is an AI Reporting Tool? (2026 Guide)

Waiting weeks for a data analyst to build a dashboard is a relic of the past. You have urgent questions, but the answers are locked away in databases, only accessible to people who know SQL. An AI reporting tool flips this upside down. It’s software that uses artificial intelligence to let you ask questions about your data in plain English. You get back instant charts and answers, almost like you're having a conversation.
Think of it as having a data expert on your team who is available 24/7. This is the new world of self-serve business intelligence—where anyone can find the metrics that matter.
TL;DR: Key Takeaways
What is an AI Reporting Tool? It’s software that lets you ask questions about your data in plain English and get charts back instantly.
The Big Benefit: You skip the SQL. Founders, marketers, and PMs can get answers without waiting for a data analyst.
How it Works: It securely connects to your data, translates your question into code (NLP), and picks the best chart to visualize the answer.
Must-Have Features: Natural Language Querying, automated insights, collaborative dashboards, and showing you the SQL it generated (transparency is key).
The Bottom Line: Tools like Statspresso, a Conversational AI Data Analyst, are about speed—moving from question to decision in seconds, not weeks.
Stop Waiting for Reports and Start Asking Questions
Remember the old workflow? You have a question, so you file a ticket with the data team. You wait in a queue. After some back-and-forth, you finally get a static report weeks later. The problem? It always leads to more questions, starting the frustrating cycle all over again.
That process is a bottleneck. An AI reporting tool demolishes it.
The Old Way vs. The New Way
Let's be blunt. The traditional way of getting data is slow and packed with friction. It forces smart teams to rely on a small group of technical experts for every little request. The new way is direct.
Task | The Old Way (Manual SQL & BI Tools) | The New Way (with Statspresso) |
|---|---|---|
Get a chart | Write SQL, export to CSV, import to Excel, build a chart. | Ask a question. Get a chart in seconds. |
Build a dashboard | File a ticket, wait for an analyst to code it. | Ask questions, pin the answers to a new board. |
Share an insight | Take a screenshot, paste it into Slack with a long explanation. | Share a direct link to the live, interactive chart. |
The difference is night and day. A Conversational AI Data Analyst like Statspresso changes the game entirely. You can skip the SQL, skip the tickets, and skip the wait.
The core idea is simple: If you can ask a question, you should be able to get an answer. Instantly. This is the promise of modern AI-driven analytics.
From Gatekeepers to Instant Insights
This conversational model removes the dependency on data "gatekeepers." Suddenly, marketing leads, product managers, and founders can directly explore their databases without writing a single line of code.
Instead of begging a developer to pull sales data, you just ask the tool yourself.
Try asking Statspresso: "Show me my revenue by month for the last year as a bar chart."
This immediate access fuels faster, smarter decision-making. It’s about getting the right information to the right people at the exact moment they need it most.
How AI Reporting Tools Actually Work
So, how does asking a simple question turn into a perfect chart? It’s not magic, but it feels close. An AI reporting tool acts as a skilled translator between you and your company's data.
The whole thing boils down to three key steps: connecting to the data, translating your question, and then creating a visual answer. It all begins by giving the AI a secure, read-only window into your data.
Securely Connecting to Your Data
First, the tool has to get to know your business. It links up directly with your databases—whether that’s a Postgres backend, your Google Analytics account, or a CRM. These connections are almost always read-only, a critical safety feature. The AI can look, but it can't touch.
Once connected, the AI scans the structure of your data—what tech folks call the "schema"—to figure out what information lives where. It learns about your tables for users, orders, and marketing_campaigns and how they relate. Think of it as the AI building its own internal blueprint of your business.
Translating Questions into Queries
This is where the real intelligence kicks in. When you type a question like, "What were our top 5 cities by sales last month?", a technology called Natural Language Processing (NLP) takes over.
The NLP engine dissects your sentence, figures out your intent, and then translates your English request into a language the database understands. In most cases, this means writing a perfect SQL query on the fly. It's the digital equivalent of a data expert instantly intuiting the precise code needed to pull the right information.
Think of it like a skilled librarian. You describe the story you're looking for, and they know exactly which shelf to scan. An AI reporting tool does the same thing for your company's data.
The chart below shows how much this new approach streamlines the old, clunky process.
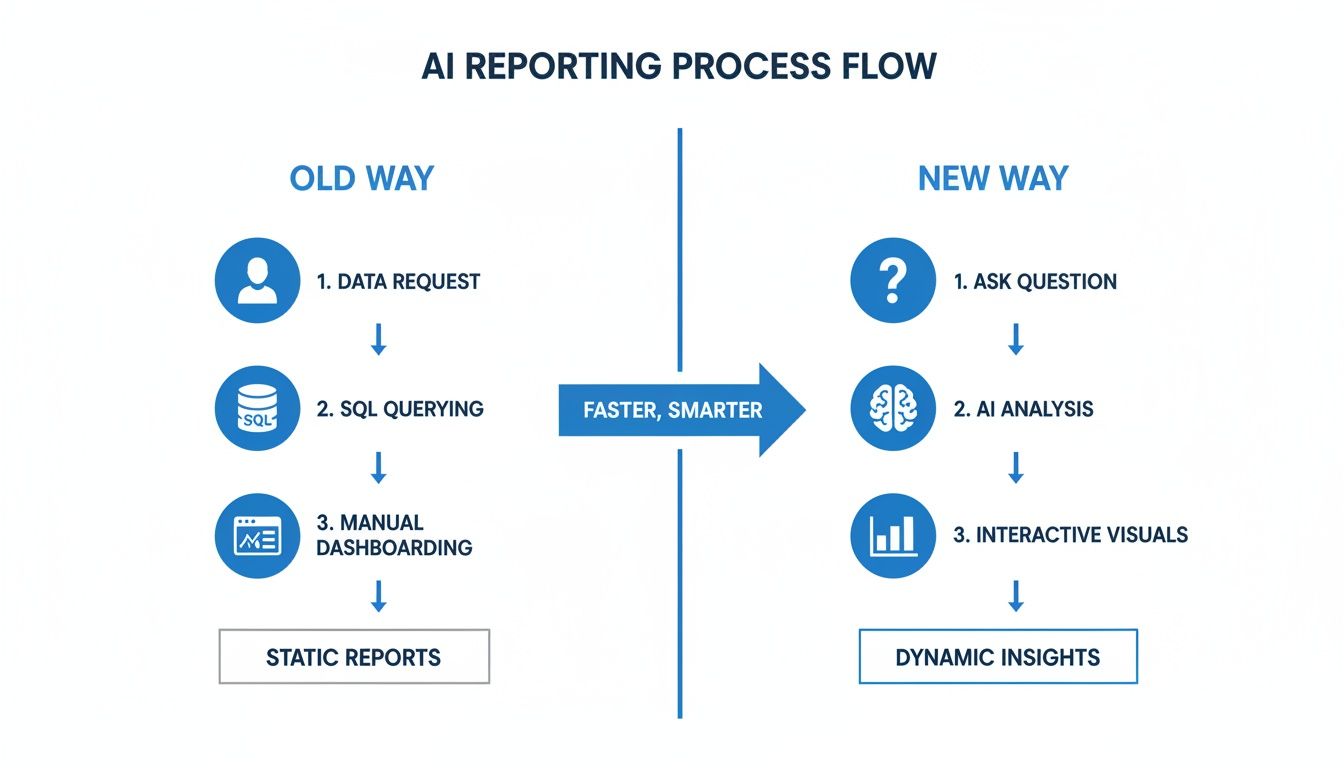
As you can see, the new way cuts out the slow, manual steps, replacing them with a simple, conversational loop.
Generating Smart Visualizations
After the query fetches the data, the tool’s last job is making the answer easy to understand. A good AI won't just dump a spreadsheet on you. It intelligently analyzes the data and chooses the best way to present it.
Showing trends over time? It’ll create a line chart.
Comparing different categories? A bar chart is the natural choice.
Looking at data by location? You'll get a map, right out of the box.
This smart visualization is what makes the insights pop. Tools like Statspresso, a true Conversational AI Data Analyst, run through this entire sequence—from question to visual insight—in seconds. You skip the SQL and get straight to the answer.
6 Core Capabilities of a Modern AI Reporting Tool
A real AI reporting tool is more than a chatbot sitting on top of your data. It’s a complete platform built to shorten the analytics workflow. The best tools don't just answer your questions; they anticipate your next ones and make the insights easy to share.
Let's dig into the six essential capabilities that separate a truly useful tool from a basic query interface.
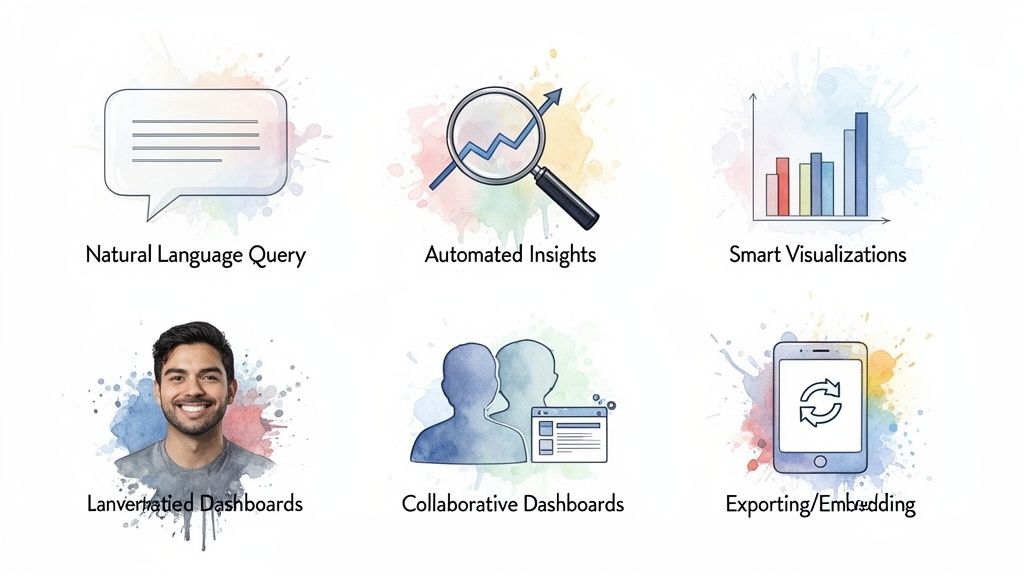
1. Natural Language Querying
This is the bedrock. It’s the ability to ask complex business questions in plain English. A true Conversational AI Data Analyst like Statspresso understands your intent, knows how to handle filters, and can segment data without you ever needing to write a line of code.
Try asking Statspresso: “What were our top 5 performing marketing channels last quarter by conversion rate?”
2. Automated Insights
The most powerful tools don't just wait for you to ask the perfect question. They actively scan your data for meaningful patterns, emerging trends, or strange outliers you might have missed. This feature is like having a tireless analyst on your team, working 24/7 to surface critical information.
This is the crucial shift from reactive reporting to proactive discovery. An AI can spot a sudden dip in customer retention and alert you, giving your team a valuable head start.
3. Smart Visualizations
Getting a raw number is one thing; seeing it in context is what drives understanding. A modern AI reporting tool automatically picks the best chart type to visualize the answer. No more fumbling with chart settings. You get the right visual, right away.
4. Collaborative Dashboards
Got the perfect chart? Great. Now share it. With a single click, you can save instantly-generated charts to a live dashboard. These aren't the rigid, static dashboards of the past. They are dynamic, shareable spaces where your entire team can track key metrics in real-time.
5. AI-Powered Explainability
Great AI tools don't just give you an answer; they show their work. When the AI tells you that sales are up, it should also be able to explain why. This context is what turns a simple number into an actionable strategy. For instance, it might report: "Sales increased by 15%, primarily driven by a 40% lift in the 'Returning Customers' segment."
6. Easy Exporting and Embedding
Your data should never be locked inside one tool. The best platforms make it incredibly simple to get your insights where your team already works. This means you need the flexibility to:
Export data as a CSV or an image for a presentation.
Schedule reports to be sent to your team's inbox or Slack.
Embed live charts into other applications, like Notion or even your own SaaS product.
This ensures data-driven decisions become a seamless part of your team's daily workflow.
Real-World Use Cases for Every Team
What does this look like on a typical Monday morning? The real magic of an AI reporting tool is how it gets specific, crucial answers into the hands of the people who need them, right when they need them.

For Marketing Leads
Marketing teams are drowning in data. Waiting a week for an analyst to dig into campaign numbers means you’ve already torched a good chunk of your budget. A Conversational AI Data Analyst gives marketers an immediate feedback loop.
The Old Way: "Hey data team, can you pull a report on blog performance for last month?" (Wait time: 3 days)
The New Way with Statspresso: "Which blog posts drove the most signups last month?" (Wait time: 10 seconds)
For Product Managers
Product managers juggle feature requests, bugs, and the long-term roadmap. Is that new feature getting any love? Are customers on a certain plan churning? Answering these questions used to mean pulling an engineer away from building the product. Now, a PM can find these insights on their own.
The Old Way: "Can we get a query to see engagement with the new dashboard feature?" (Wait time: 1 week, plus a developer's time)
The New Way with Statspresso: "Show me user engagement for our new feature, segmented by subscription plan." (Wait time: 15 seconds)
For Founders and CEOs
For a founder, the health of the business is everything. You need a constant pulse on MRR, customer lifetime value, and burn rate. An AI reporting tool is like an executive dashboard you can actually talk to. A Conversational AI Data Analyst like Statspresso puts the company's vital signs right at your fingertips.
The Old Way: Asking the finance team for an updated MRR trend line for a board deck. (Wait time: 1 day)
The New Way with Statspresso: "What is our monthly recurring revenue trend for the past year?" (Wait time: 5 seconds)
Choosing the Right AI Reporting Tool
The market for AI tools is crowded. With the global AI software market projected to explode past $1.8 trillion by 2030, according to Grandview Research, it's tough to tell what's genuinely useful. You can see the projections for the AI software market for yourself—it’s a dizzying climb.
This means you need a clear plan. Not every platform that calls itself an AI reporting tool can give you the instant, reliable answers you need.
Your Evaluation Checklist
Before you sign up for a demo, have a list of essential questions ready.
Data Source Compatibility: Does it connect easily to your stack? Whether your data is in Postgres, Snowflake, or Google Analytics, the connection should be simple.
Security and Compliance: This is a deal-breaker. The tool must offer read-only connections and be compliant with standards like SOC 2. Your data is your most valuable asset—protect it.
Ease of Implementation: How long until you get your first real answer? The best tools deliver value on day one.
Natural Language Understanding: Push it beyond simple questions. Ask something tricky like, "Compare user signups from last month to the month before, but only for users in the United States."
Pricing That Makes Sense: Find a model that grows with your team's usage. Be wary of per-user fees that punish you for getting more people to use data.
Look for Transparency, Not a Black Box
If I had to pick the single most important factor, it would be trust.
A great AI reporting tool doesn’t just spit out a chart. It shows its work. It should give you the ability to see the exact query it ran. This level of transparency is everything. It lets your technical folks double-check the logic and gives everyone else confidence in the answers.
Statspresso was built on this principle. As a Conversational AI Data Analyst, it lets you skip the SQL but also gives you the power to inspect it whenever you need to.
Go from Raw Data to Your First Dashboard in Minutes
Tired of reading about faster insights? Let’s get you some. Bringing a modern AI reporting tool on board isn't a months-long IT slog. The point is to deliver value right away.
Here are the three simple steps to go from a raw database to a shareable dashboard.
Connect Your Data Securely: Link up your data sources with one-click connections to popular databases like Postgres or CRMs like HubSpot. This connection is always read-only.
Ask Your First Question: Open the conversational interface and ask a question in plain English. No code, no complicated filters. Just ask.
Build Your First Dashboard: See a useful chart? Click "pin" to a new dashboard. Ask another question, get another chart, and pin that one, too. In minutes, you've built a live, interactive dashboard.
The core idea is incredibly simple: Skip the SQL. Just ask your data a question and get a chart in seconds. Statspresso, as a Conversational AI Data Analyst, is built entirely around this principle.
Ready to see for yourself? Connect your first data source for free and ask your first question.
Frequently Asked Questions
It's normal to have questions when changing how your team interacts with data. Let's tackle the most common ones.
Is My Company Data Secure?
Yes. Platforms like Statspresso are built with multiple layers of security.
Read-Only Connections: The AI gets "look, don't touch" access. It can query your database but has zero ability to change, write, or delete your data.
Data Encryption: All data is encrypted using industry-standard protocols, both in transit and at rest.
Access Controls: You decide who on your team can access which data.
Will an AI Reporting Tool Replace Our Data Analysts?
Not a chance. It makes them more valuable. A Conversational AI Data Analyst handles the repetitive, day-to-day questions. This frees up your human experts to focus on deep-dive strategic analysis, building sophisticated data models, and mentoring colleagues. It's about empowerment, not replacement.
How Accurate Are the Answers?
This is a fantastic question. Unlike general AIs that can "hallucinate," a dedicated AI reporting tool is tethered to reality—your company's data. Its answers are derived directly from the information you provide.
The best tools offer total transparency.
For every answer it provides, Statspresso shows you the exact SQL query it used. This "show your work" feature lets anyone verify the logic, which builds trust and confidence in the results.
Before committing to one tool, see how they compare: our ranked guide to the best AI reporting tools for 2026 covers 8 options side-by-side on ease of use, data source breadth, and time to first answer.
Ready to stop waiting and start asking? Connect your first data source for free and ask your first question.
Waiting weeks for a data analyst to build a dashboard is a relic of the past. You have urgent questions, but the answers are locked away in databases, only accessible to people who know SQL. An AI reporting tool flips this upside down. It’s software that uses artificial intelligence to let you ask questions about your data in plain English. You get back instant charts and answers, almost like you're having a conversation.
Think of it as having a data expert on your team who is available 24/7. This is the new world of self-serve business intelligence—where anyone can find the metrics that matter.
TL;DR: Key Takeaways
What is an AI Reporting Tool? It’s software that lets you ask questions about your data in plain English and get charts back instantly.
The Big Benefit: You skip the SQL. Founders, marketers, and PMs can get answers without waiting for a data analyst.
How it Works: It securely connects to your data, translates your question into code (NLP), and picks the best chart to visualize the answer.
Must-Have Features: Natural Language Querying, automated insights, collaborative dashboards, and showing you the SQL it generated (transparency is key).
The Bottom Line: Tools like Statspresso, a Conversational AI Data Analyst, are about speed—moving from question to decision in seconds, not weeks.
Stop Waiting for Reports and Start Asking Questions
Remember the old workflow? You have a question, so you file a ticket with the data team. You wait in a queue. After some back-and-forth, you finally get a static report weeks later. The problem? It always leads to more questions, starting the frustrating cycle all over again.
That process is a bottleneck. An AI reporting tool demolishes it.
The Old Way vs. The New Way
Let's be blunt. The traditional way of getting data is slow and packed with friction. It forces smart teams to rely on a small group of technical experts for every little request. The new way is direct.
Task | The Old Way (Manual SQL & BI Tools) | The New Way (with Statspresso) |
|---|---|---|
Get a chart | Write SQL, export to CSV, import to Excel, build a chart. | Ask a question. Get a chart in seconds. |
Build a dashboard | File a ticket, wait for an analyst to code it. | Ask questions, pin the answers to a new board. |
Share an insight | Take a screenshot, paste it into Slack with a long explanation. | Share a direct link to the live, interactive chart. |
The difference is night and day. A Conversational AI Data Analyst like Statspresso changes the game entirely. You can skip the SQL, skip the tickets, and skip the wait.
The core idea is simple: If you can ask a question, you should be able to get an answer. Instantly. This is the promise of modern AI-driven analytics.
From Gatekeepers to Instant Insights
This conversational model removes the dependency on data "gatekeepers." Suddenly, marketing leads, product managers, and founders can directly explore their databases without writing a single line of code.
Instead of begging a developer to pull sales data, you just ask the tool yourself.
Try asking Statspresso: "Show me my revenue by month for the last year as a bar chart."
This immediate access fuels faster, smarter decision-making. It’s about getting the right information to the right people at the exact moment they need it most.
How AI Reporting Tools Actually Work
So, how does asking a simple question turn into a perfect chart? It’s not magic, but it feels close. An AI reporting tool acts as a skilled translator between you and your company's data.
The whole thing boils down to three key steps: connecting to the data, translating your question, and then creating a visual answer. It all begins by giving the AI a secure, read-only window into your data.
Securely Connecting to Your Data
First, the tool has to get to know your business. It links up directly with your databases—whether that’s a Postgres backend, your Google Analytics account, or a CRM. These connections are almost always read-only, a critical safety feature. The AI can look, but it can't touch.
Once connected, the AI scans the structure of your data—what tech folks call the "schema"—to figure out what information lives where. It learns about your tables for users, orders, and marketing_campaigns and how they relate. Think of it as the AI building its own internal blueprint of your business.
Translating Questions into Queries
This is where the real intelligence kicks in. When you type a question like, "What were our top 5 cities by sales last month?", a technology called Natural Language Processing (NLP) takes over.
The NLP engine dissects your sentence, figures out your intent, and then translates your English request into a language the database understands. In most cases, this means writing a perfect SQL query on the fly. It's the digital equivalent of a data expert instantly intuiting the precise code needed to pull the right information.
Think of it like a skilled librarian. You describe the story you're looking for, and they know exactly which shelf to scan. An AI reporting tool does the same thing for your company's data.
The chart below shows how much this new approach streamlines the old, clunky process.
As you can see, the new way cuts out the slow, manual steps, replacing them with a simple, conversational loop.
Generating Smart Visualizations
After the query fetches the data, the tool’s last job is making the answer easy to understand. A good AI won't just dump a spreadsheet on you. It intelligently analyzes the data and chooses the best way to present it.
Showing trends over time? It’ll create a line chart.
Comparing different categories? A bar chart is the natural choice.
Looking at data by location? You'll get a map, right out of the box.
This smart visualization is what makes the insights pop. Tools like Statspresso, a true Conversational AI Data Analyst, run through this entire sequence—from question to visual insight—in seconds. You skip the SQL and get straight to the answer.
6 Core Capabilities of a Modern AI Reporting Tool
A real AI reporting tool is more than a chatbot sitting on top of your data. It’s a complete platform built to shorten the analytics workflow. The best tools don't just answer your questions; they anticipate your next ones and make the insights easy to share.
Let's dig into the six essential capabilities that separate a truly useful tool from a basic query interface.
1. Natural Language Querying
This is the bedrock. It’s the ability to ask complex business questions in plain English. A true Conversational AI Data Analyst like Statspresso understands your intent, knows how to handle filters, and can segment data without you ever needing to write a line of code.
Try asking Statspresso: “What were our top 5 performing marketing channels last quarter by conversion rate?”
2. Automated Insights
The most powerful tools don't just wait for you to ask the perfect question. They actively scan your data for meaningful patterns, emerging trends, or strange outliers you might have missed. This feature is like having a tireless analyst on your team, working 24/7 to surface critical information.
This is the crucial shift from reactive reporting to proactive discovery. An AI can spot a sudden dip in customer retention and alert you, giving your team a valuable head start.
3. Smart Visualizations
Getting a raw number is one thing; seeing it in context is what drives understanding. A modern AI reporting tool automatically picks the best chart type to visualize the answer. No more fumbling with chart settings. You get the right visual, right away.
4. Collaborative Dashboards
Got the perfect chart? Great. Now share it. With a single click, you can save instantly-generated charts to a live dashboard. These aren't the rigid, static dashboards of the past. They are dynamic, shareable spaces where your entire team can track key metrics in real-time.
5. AI-Powered Explainability
Great AI tools don't just give you an answer; they show their work. When the AI tells you that sales are up, it should also be able to explain why. This context is what turns a simple number into an actionable strategy. For instance, it might report: "Sales increased by 15%, primarily driven by a 40% lift in the 'Returning Customers' segment."
6. Easy Exporting and Embedding
Your data should never be locked inside one tool. The best platforms make it incredibly simple to get your insights where your team already works. This means you need the flexibility to:
Export data as a CSV or an image for a presentation.
Schedule reports to be sent to your team's inbox or Slack.
Embed live charts into other applications, like Notion or even your own SaaS product.
This ensures data-driven decisions become a seamless part of your team's daily workflow.
Real-World Use Cases for Every Team
What does this look like on a typical Monday morning? The real magic of an AI reporting tool is how it gets specific, crucial answers into the hands of the people who need them, right when they need them.
For Marketing Leads
Marketing teams are drowning in data. Waiting a week for an analyst to dig into campaign numbers means you’ve already torched a good chunk of your budget. A Conversational AI Data Analyst gives marketers an immediate feedback loop.
The Old Way: "Hey data team, can you pull a report on blog performance for last month?" (Wait time: 3 days)
The New Way with Statspresso: "Which blog posts drove the most signups last month?" (Wait time: 10 seconds)
For Product Managers
Product managers juggle feature requests, bugs, and the long-term roadmap. Is that new feature getting any love? Are customers on a certain plan churning? Answering these questions used to mean pulling an engineer away from building the product. Now, a PM can find these insights on their own.
The Old Way: "Can we get a query to see engagement with the new dashboard feature?" (Wait time: 1 week, plus a developer's time)
The New Way with Statspresso: "Show me user engagement for our new feature, segmented by subscription plan." (Wait time: 15 seconds)
For Founders and CEOs
For a founder, the health of the business is everything. You need a constant pulse on MRR, customer lifetime value, and burn rate. An AI reporting tool is like an executive dashboard you can actually talk to. A Conversational AI Data Analyst like Statspresso puts the company's vital signs right at your fingertips.
The Old Way: Asking the finance team for an updated MRR trend line for a board deck. (Wait time: 1 day)
The New Way with Statspresso: "What is our monthly recurring revenue trend for the past year?" (Wait time: 5 seconds)
Choosing the Right AI Reporting Tool
The market for AI tools is crowded. With the global AI software market projected to explode past $1.8 trillion by 2030, according to Grandview Research, it's tough to tell what's genuinely useful. You can see the projections for the AI software market for yourself—it’s a dizzying climb.
This means you need a clear plan. Not every platform that calls itself an AI reporting tool can give you the instant, reliable answers you need.
Your Evaluation Checklist
Before you sign up for a demo, have a list of essential questions ready.
Data Source Compatibility: Does it connect easily to your stack? Whether your data is in Postgres, Snowflake, or Google Analytics, the connection should be simple.
Security and Compliance: This is a deal-breaker. The tool must offer read-only connections and be compliant with standards like SOC 2. Your data is your most valuable asset—protect it.
Ease of Implementation: How long until you get your first real answer? The best tools deliver value on day one.
Natural Language Understanding: Push it beyond simple questions. Ask something tricky like, "Compare user signups from last month to the month before, but only for users in the United States."
Pricing That Makes Sense: Find a model that grows with your team's usage. Be wary of per-user fees that punish you for getting more people to use data.
Look for Transparency, Not a Black Box
If I had to pick the single most important factor, it would be trust.
A great AI reporting tool doesn’t just spit out a chart. It shows its work. It should give you the ability to see the exact query it ran. This level of transparency is everything. It lets your technical folks double-check the logic and gives everyone else confidence in the answers.
Statspresso was built on this principle. As a Conversational AI Data Analyst, it lets you skip the SQL but also gives you the power to inspect it whenever you need to.
Go from Raw Data to Your First Dashboard in Minutes
Tired of reading about faster insights? Let’s get you some. Bringing a modern AI reporting tool on board isn't a months-long IT slog. The point is to deliver value right away.
Here are the three simple steps to go from a raw database to a shareable dashboard.
Connect Your Data Securely: Link up your data sources with one-click connections to popular databases like Postgres or CRMs like HubSpot. This connection is always read-only.
Ask Your First Question: Open the conversational interface and ask a question in plain English. No code, no complicated filters. Just ask.
Build Your First Dashboard: See a useful chart? Click "pin" to a new dashboard. Ask another question, get another chart, and pin that one, too. In minutes, you've built a live, interactive dashboard.
The core idea is incredibly simple: Skip the SQL. Just ask your data a question and get a chart in seconds. Statspresso, as a Conversational AI Data Analyst, is built entirely around this principle.
Ready to see for yourself? Connect your first data source for free and ask your first question.
Frequently Asked Questions
It's normal to have questions when changing how your team interacts with data. Let's tackle the most common ones.
Is My Company Data Secure?
Yes. Platforms like Statspresso are built with multiple layers of security.
Read-Only Connections: The AI gets "look, don't touch" access. It can query your database but has zero ability to change, write, or delete your data.
Data Encryption: All data is encrypted using industry-standard protocols, both in transit and at rest.
Access Controls: You decide who on your team can access which data.
Will an AI Reporting Tool Replace Our Data Analysts?
Not a chance. It makes them more valuable. A Conversational AI Data Analyst handles the repetitive, day-to-day questions. This frees up your human experts to focus on deep-dive strategic analysis, building sophisticated data models, and mentoring colleagues. It's about empowerment, not replacement.
How Accurate Are the Answers?
This is a fantastic question. Unlike general AIs that can "hallucinate," a dedicated AI reporting tool is tethered to reality—your company's data. Its answers are derived directly from the information you provide.
The best tools offer total transparency.
For every answer it provides, Statspresso shows you the exact SQL query it used. This "show your work" feature lets anyone verify the logic, which builds trust and confidence in the results.
Before committing to one tool, see how they compare: our ranked guide to the best AI reporting tools for 2026 covers 8 options side-by-side on ease of use, data source breadth, and time to first answer.
Ready to stop waiting and start asking? Connect your first data source for free and ask your first question.