Data Visualization Dashboards (2026 Guide)

Waiting weeks for an analyst to build a dashboard is a relic of the past. You need answers now, but most data visualization dashboards are digital paperweights—packed with charts, yet empty of insight. They’re a tangled mess that leaves you guessing. If your dashboard can't answer a simple follow-up question, it's not working for you. It's time for a better way.
Why Your Current Dashboards Don't Work
We’ve all been there. You have a simple question, like, "How did last month's marketing campaign perform in the EU?" but the dashboard is a maze. It feels like trying to find a book in a library with no catalog.
This is a huge source of frustration for busy founders, product managers, and marketing leads. You’re left with two bad options:
Spend hours piecing together a story from confusing visuals.
Add another ticket to your data team’s endless backlog and wait.
The problem? Traditional dashboards are static answers to questions someone thought you might ask weeks ago. They weren't built for the specific, urgent questions you have right now.

From Static Views to Dynamic Conversations
The future isn't about building more complicated dashboards. It's about having a direct conversation with your data. This is where a Conversational AI Data Analyst like Statspresso flips the script. Instead of hunting for insights, you just ask.
This new approach removes the friction between curiosity and clarity. You can move from a high-level overview to a granular detail in seconds.
Try asking Statspresso: "Show me my revenue by month for the last year as a bar chart."
Just like that, you get the exact chart you need. This is the promise of modern business intelligence: Skip the SQL. Just ask your data a question and get a chart in seconds. It’s time to move beyond dashboards that just look good and start using tools that deliver immediate value.
What's the Real Point of a Dashboard, Anyway?
Let's get one thing straight: a data visualization dashboard isn't just a gallery of pretty charts. That's a common mistake.
Think of the dashboard in your car. You don't need a dial showing the real-time spark plug firing rate. You need your speed, fuel level, and a big, impossible-to-miss warning light if the engine is overheating. It's about getting the right information, right now, to make a decision—like pulling over for gas.
A business dashboard serves the exact same purpose. Its job is to provide a quick, at-a-glance view of the most critical indicators that tell you if things are running smoothly. A great dashboard answers your most important questions before you even have to ask them.
From Static Snapshots to a Live Pulse
Not long ago, "dashboard" meant someone manually pulled data, plugged it into a spreadsheet, and refreshed it once a week. By the time you saw it, the information was already a historical document.
Modern Automated BI has changed everything. Today's tools connect directly to your data sources—your Shopify store, a Postgres database, or your HubSpot CRM. This creates a live feed, ensuring your insights are always fresh.
This isn't just a convenience; it's a fundamental shift. The global market for data visualization tools is expected to reach $10.2 billion by 2026, up from $5.9 billion in 2021, according to MarketsandMarkets. This growth is exploding because businesses are ditching static reports for dynamic dashboards that turn data into action.
The Only Metric That Matters for a Dashboard
How do you measure a dashboard's success? It's simple: by the quality and speed of the decisions it helps you make. A screen packed with vanity metrics might look impressive, but if it doesn't help you answer, "Okay, what should we do next?" it has failed.
This is where a Conversational AI Data Analyst really shines. Instead of being stuck with pre-built charts, you can just ask your data questions directly.
Try asking Statspresso: "Compare new user sign-ups from our last two marketing campaigns and show me the trend."
That ability to get an immediate, specific answer is what separates a useful tool from digital decoration. The goal is to skip the SQL and get a chart in seconds, turning curiosity directly into clarity.
The Four Essential Dashboard Types You Should Know
Not all dashboards are created equal. Using a one-size-fits-all approach is like using a sledgehammer to hang a picture frame. The key is to match the dashboard to the job.
Your CEO doesn't need to know the number of support tickets from the last hour. Your support team doesn't need a 10-year market forecast. Each audience has a different question, so they need a different kind of dashboard.
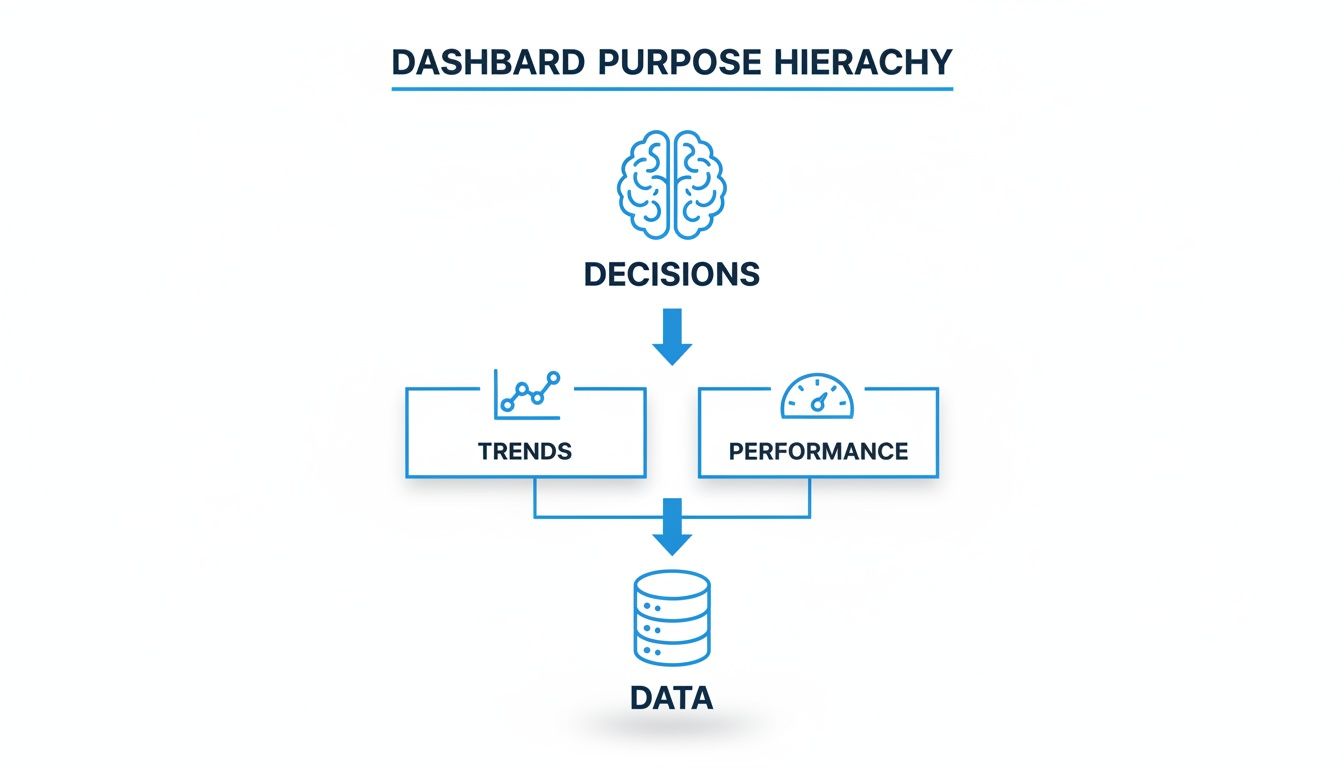
This hierarchy shows how everything flows up from raw data. You track performance, spot trends, and make smarter decisions.
Let's break down the four essential types.
Strategic Dashboards
Strategic dashboards are the 30,000-foot view. This is the command center for your C-suite, designed for a quick pulse check on the business's overall health. They're all about long-term goals and high-level KPIs.
Who uses them? Executives, founders, and department heads.
What's on them? Big-picture metrics like Monthly Recurring Revenue (MRR), Customer Lifetime Value (CLV), and year-over-year growth.
The goal: Answer the big question: "Are we on track to hit our long-term targets?"
Operational Dashboards
While strategic dashboards look at the horizon, operational dashboards focus on the here and now. They monitor real-time business processes, acting as an early warning system for your front-line teams.
These dashboards are crucial for teams that can't afford to wait. A sudden server outage or a flood of negative customer feedback requires an instant response, and an operational dashboard makes that possible.
Who uses them? Customer support, IT, and sales teams.
What's on them? Live metrics like website uptime, open support tickets, or current call queue volume.
The goal: Spot problems as they happen and enable a rapid response.
Analytical Dashboards
Think of analytical dashboards as the data playground for your company's detectives. These tools are built for exploration. They let users dig deep into the data, slice and dice it, and uncover the "why" behind the numbers.
Instead of just showing what happened, an analytical dashboard helps you figure out why. A product manager might use one to see how a new feature affects user engagement across different demographics.
According to research highlighted by Forsta.com, modern tools have collapsed the time it takes to get insights from weeks to seconds. In fact, it's predicted that 90% of insight professionals will soon rely on AI to suggest the best visualizations for their data—exactly what a Conversational AI Data Analyst does.
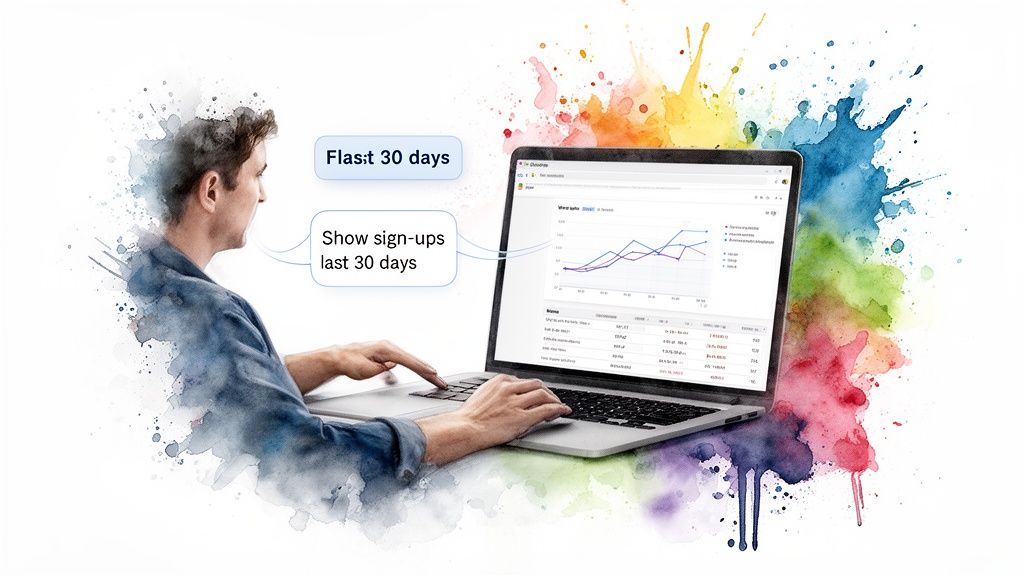
Try asking Statspresso: "Show me user sign-ups by day for the last 30 days as a line chart."
Tactical Dashboards
Last but not least, tactical dashboards bridge the gap between high-level strategy and daily operations. These are for middle managers who need to track performance against specific initiatives and departmental goals.
A marketing manager, for example, would use a tactical dashboard to see how a specific ad campaign is performing. They'd monitor click-through rates, conversion costs, and return on ad spend to ensure their tactics are driving the company's broader goals.
How to Design Dashboards People Actually Use
A great data visualization dashboard is like a perfectly organized workspace. Everything you need is right where you expect it. A bad one? It's a cluttered desk where finding anything is a frustrating scavenger hunt.
The goal is clarity, not complexity. A dashboard’s success is measured by how quickly your team can look at it, get the point, and make a confident decision.
Embrace the "Less is More" Philosophy
The single biggest mistake is trying to show everything at once. This "kitchen sink" approach creates cognitive overload. Your audience can't focus on what’s important when twenty different things are screaming for attention.
Instead, ask one question: "What is the single most important decision someone needs to make after seeing this?" Every chart should help answer that question.
Stick to 5-7 Key Visuals: This rule of thumb forces you to prioritize what matters.
Use White Space Generously: It gives visuals room to breathe and guides the eye.
Remove "Chart Junk": Ditch unnecessary gridlines, distracting borders, or cheesy 3D effects. Clean and simple wins.
Establish a Clear Visual Hierarchy
Your eyes should be naturally drawn to the most important information first. This isn't magic; it's strong visual hierarchy.
Think of it like a newspaper. The massive headline grabs your attention first, followed by the subheading. You can create the same intuitive flow on your dashboard.
Place your most critical KPI in the top-left corner. This is where most Western readers' eyes land first. As you move down and to the right, present more granular, supporting details.
This structure tells a logical story, guiding the user from the main takeaway to the underlying data. Without it, you leave your users wandering aimlessly.
From Manual Builds to Instant Answers
Building a useful dashboard used to be a long, painful slog of complex SQL queries and endless revision cycles. Frankly, that old way is too slow for modern business. The new way is conversational. With a Conversational AI Data Analyst like Statspresso, you just ask for what you need.
It's night and day.
Dashboard Creation: The Old Way vs. The New Way
Process Step | The Old Way (Manual SQL) | The New Way (Statspresso) |
|---|---|---|
Initial Request | Submit a detailed ticket to the data team. | Ask a question in plain English. |
Development Time | Weeks or months of coding and revisions. | Seconds. |
Required Skill | Deep knowledge of SQL and BI software. | The ability to ask a question. |
Flexibility | Static. A new question requires a new build. | Dynamic. Ask endless follow-up questions. |
Outcome | A rigid dashboard that's quickly outdated. | An instant chart and a clear answer. |
This shift moves the power of data analysis from a few specialists to everyone. You can skip the SQL, just ask your data a question and get a chart in seconds. This isn't just convenience; it's a competitive advantage.
Try asking Statspresso: 'Compare revenue from new vs. returning customers last quarter and show it as a stacked bar chart.'
Common Dashboard Mistakes and How to Avoid Them
Even with the best intentions, it's shockingly easy to build a data visualization dashboard that nobody uses. These are design failures, not technical ones. But the good news is, they're completely avoidable.
Mistake 1: The Kitchen Sink Dashboard
This is the number one offender. Fearing they'll leave something out, creators throw every possible metric onto a single screen. The result is a chaotic mess that overwhelms anyone looking at it.
The Fix: Be ruthless. Before adding any element, ask: "Does this directly help answer the main question?" If the answer is no, leave it out. A great dashboard has a strong point of view.
Mistake 2: Using Misleading Visualizations
Choosing the wrong chart can do more harm than good. A 3D pie chart, for example, looks fancy but distorts proportions, actively misleading the viewer.
The Fix: Let the data choose the chart.
For comparisons: Use bar charts. They are simple and clear.
For trends over time: Line charts are your best friend.
For parts of a whole: Use a stacked bar chart or a simple table. And please, avoid pie charts unless you have fewer than four categories.
Modern GenBI platforms like Statspresso, your Conversational AI Data Analyst, can suggest the right chart type automatically.
Try asking Statspresso: 'What were my top 5 selling products last quarter? Show me as a table.'
Mistake 3: Failing to Define Clear KPIs
A dashboard without clear Key Performance Indicators (KPIs) is like a road trip without a destination. You’re moving, but you don't know if you're going in the right direction.
The Fix: Start with your objectives, not your data. What business outcome are you trying to achieve? Work backward from there to pinpoint the few metrics that truly measure progress. Make these KPIs the heroes of your dashboard—big, bold, and impossible to miss.
The push for better, faster insights is undeniable. According to Market Research Future, the data visualization tool market is set to balloon from $30.36 billion in 2024 to $73.83 billion by 2035. This growth is fueled by teams demanding self-serve analytics.
Move from Static Reports to Conversational Insights
If you remember just one thing, let it be this: the future isn't about building more complex dashboards. It’s about closing the gap between a question and its answer.
The old way—waiting in line for the data team, battling clunky BI tools, and staring at charts that don't answer your real question—is broken. Your team has questions now, and they need answers that move as fast as your business. Instead of passively looking at reports, your team can start having a real conversation with your data.
The Power of Asking a Simple Question
Imagine your product manager needs to dig into user retention. Instead of applying a dozen filters to a rigid dashboard, what if they could just ask?
Try asking Statspresso: “What is our 30-day user retention rate for customers who signed up in Q2, broken down by acquisition channel?”
That’s all it takes. No SQL queries, no support tickets, no waiting. This is the magic of a Conversational AI Data Analyst. It gives everyone access to powerful insights. Your data stops being a locked resource and becomes a collaborative partner. Learn more about how you can chat with your data using AI.
TL;DR Key Takeaways
For the busy founder who needs the highlights, here’s what matters most:
Focus on Decisions, Not Data: A dashboard’s worth is measured by how quickly it helps you make better decisions. If it doesn’t lead to action, it’s just wallpaper.
One Dashboard, One Job: Tailor the dashboard type (Strategic, Operational, Analytical, or Tactical) to its audience. A one-size-fits-all dashboard fits no one.
Clarity Over Clutter: The best dashboards are scannable in seconds. Use a clear visual hierarchy and be ruthless about cutting any chart that doesn’t serve the main goal.
The Future is Conversational: Move past static reports. Tools like Statspresso let you Skip the SQL. Just ask your data a question and get a chart in seconds.
Ready to stop waiting and start asking?
Connect your first data source for free and ask your first question.
Frequently Asked Questions
You've got questions about data visualization dashboards. We've got straight answers.
What Is the Main Goal of a Data Visualization Dashboard?
The goal is to help you make faster, smarter decisions. A great dashboard gives you a crystal-clear, at-a-glance understanding of what's happening so you know exactly what to do next. It's the cockpit of your business, showing only the critical information needed to get to your destination.
How Do I Choose the Right Metrics for My Dashboard?
Stop looking at the data you have and start with the questions you need to answer. What are your most important business objectives? Work backward from there to pinpoint the Key Performance Indicators (KPIs) that truly measure your progress. Everything else is just noise.
TL;DR: If a metric doesn't directly inform a decision or track a critical goal, it has no place on your dashboard.
What Makes a Dashboard "Good" vs "Bad"?
It boils down to clarity and action.
A good dashboard is focused and scannable. It tells a coherent story in seconds and prompts the question, "So, what's our next move?"
A bad dashboard is a cluttered "data-dump." It’s overwhelming and leaves you with more questions than answers. It's a report, not a decision-making tool.
What Is the Difference Between Traditional BI and a Conversational AI Data Analyst?
It’s the difference between a printed map and a live GPS that talks to you.
Traditional BI tools like Tableau or Power BI depend on specialists who spend weeks writing SQL and building rigid dashboards. If you have a follow-up question, you go to the back of the line.
A Conversational AI Data Analyst like Statspresso changes the game. You connect your data and just ask questions in plain English. No SQL, no waiting. You get an answer to a complex question in seconds, not weeks, putting the power of data into everyone's hands.
Ready to stop staring at confusing charts and start a conversation with your data? Statspresso is the conversational AI data analyst that gives you answers in seconds.
Connect your first data source for free and ask your first question.
Waiting weeks for an analyst to build a dashboard is a relic of the past. You need answers now, but most data visualization dashboards are digital paperweights—packed with charts, yet empty of insight. They’re a tangled mess that leaves you guessing. If your dashboard can't answer a simple follow-up question, it's not working for you. It's time for a better way.
Why Your Current Dashboards Don't Work
We’ve all been there. You have a simple question, like, "How did last month's marketing campaign perform in the EU?" but the dashboard is a maze. It feels like trying to find a book in a library with no catalog.
This is a huge source of frustration for busy founders, product managers, and marketing leads. You’re left with two bad options:
Spend hours piecing together a story from confusing visuals.
Add another ticket to your data team’s endless backlog and wait.
The problem? Traditional dashboards are static answers to questions someone thought you might ask weeks ago. They weren't built for the specific, urgent questions you have right now.
From Static Views to Dynamic Conversations
The future isn't about building more complicated dashboards. It's about having a direct conversation with your data. This is where a Conversational AI Data Analyst like Statspresso flips the script. Instead of hunting for insights, you just ask.
This new approach removes the friction between curiosity and clarity. You can move from a high-level overview to a granular detail in seconds.
Try asking Statspresso: "Show me my revenue by month for the last year as a bar chart."
Just like that, you get the exact chart you need. This is the promise of modern business intelligence: Skip the SQL. Just ask your data a question and get a chart in seconds. It’s time to move beyond dashboards that just look good and start using tools that deliver immediate value.
What's the Real Point of a Dashboard, Anyway?
Let's get one thing straight: a data visualization dashboard isn't just a gallery of pretty charts. That's a common mistake.
Think of the dashboard in your car. You don't need a dial showing the real-time spark plug firing rate. You need your speed, fuel level, and a big, impossible-to-miss warning light if the engine is overheating. It's about getting the right information, right now, to make a decision—like pulling over for gas.
A business dashboard serves the exact same purpose. Its job is to provide a quick, at-a-glance view of the most critical indicators that tell you if things are running smoothly. A great dashboard answers your most important questions before you even have to ask them.
From Static Snapshots to a Live Pulse
Not long ago, "dashboard" meant someone manually pulled data, plugged it into a spreadsheet, and refreshed it once a week. By the time you saw it, the information was already a historical document.
Modern Automated BI has changed everything. Today's tools connect directly to your data sources—your Shopify store, a Postgres database, or your HubSpot CRM. This creates a live feed, ensuring your insights are always fresh.
This isn't just a convenience; it's a fundamental shift. The global market for data visualization tools is expected to reach $10.2 billion by 2026, up from $5.9 billion in 2021, according to MarketsandMarkets. This growth is exploding because businesses are ditching static reports for dynamic dashboards that turn data into action.
The Only Metric That Matters for a Dashboard
How do you measure a dashboard's success? It's simple: by the quality and speed of the decisions it helps you make. A screen packed with vanity metrics might look impressive, but if it doesn't help you answer, "Okay, what should we do next?" it has failed.
This is where a Conversational AI Data Analyst really shines. Instead of being stuck with pre-built charts, you can just ask your data questions directly.
Try asking Statspresso: "Compare new user sign-ups from our last two marketing campaigns and show me the trend."
That ability to get an immediate, specific answer is what separates a useful tool from digital decoration. The goal is to skip the SQL and get a chart in seconds, turning curiosity directly into clarity.
The Four Essential Dashboard Types You Should Know
Not all dashboards are created equal. Using a one-size-fits-all approach is like using a sledgehammer to hang a picture frame. The key is to match the dashboard to the job.
Your CEO doesn't need to know the number of support tickets from the last hour. Your support team doesn't need a 10-year market forecast. Each audience has a different question, so they need a different kind of dashboard.
This hierarchy shows how everything flows up from raw data. You track performance, spot trends, and make smarter decisions.
Let's break down the four essential types.
Strategic Dashboards
Strategic dashboards are the 30,000-foot view. This is the command center for your C-suite, designed for a quick pulse check on the business's overall health. They're all about long-term goals and high-level KPIs.
Who uses them? Executives, founders, and department heads.
What's on them? Big-picture metrics like Monthly Recurring Revenue (MRR), Customer Lifetime Value (CLV), and year-over-year growth.
The goal: Answer the big question: "Are we on track to hit our long-term targets?"
Operational Dashboards
While strategic dashboards look at the horizon, operational dashboards focus on the here and now. They monitor real-time business processes, acting as an early warning system for your front-line teams.
These dashboards are crucial for teams that can't afford to wait. A sudden server outage or a flood of negative customer feedback requires an instant response, and an operational dashboard makes that possible.
Who uses them? Customer support, IT, and sales teams.
What's on them? Live metrics like website uptime, open support tickets, or current call queue volume.
The goal: Spot problems as they happen and enable a rapid response.
Analytical Dashboards
Think of analytical dashboards as the data playground for your company's detectives. These tools are built for exploration. They let users dig deep into the data, slice and dice it, and uncover the "why" behind the numbers.
Instead of just showing what happened, an analytical dashboard helps you figure out why. A product manager might use one to see how a new feature affects user engagement across different demographics.
According to research highlighted by Forsta.com, modern tools have collapsed the time it takes to get insights from weeks to seconds. In fact, it's predicted that 90% of insight professionals will soon rely on AI to suggest the best visualizations for their data—exactly what a Conversational AI Data Analyst does.
Try asking Statspresso: "Show me user sign-ups by day for the last 30 days as a line chart."
Tactical Dashboards
Last but not least, tactical dashboards bridge the gap between high-level strategy and daily operations. These are for middle managers who need to track performance against specific initiatives and departmental goals.
A marketing manager, for example, would use a tactical dashboard to see how a specific ad campaign is performing. They'd monitor click-through rates, conversion costs, and return on ad spend to ensure their tactics are driving the company's broader goals.
How to Design Dashboards People Actually Use
A great data visualization dashboard is like a perfectly organized workspace. Everything you need is right where you expect it. A bad one? It's a cluttered desk where finding anything is a frustrating scavenger hunt.
The goal is clarity, not complexity. A dashboard’s success is measured by how quickly your team can look at it, get the point, and make a confident decision.
Embrace the "Less is More" Philosophy
The single biggest mistake is trying to show everything at once. This "kitchen sink" approach creates cognitive overload. Your audience can't focus on what’s important when twenty different things are screaming for attention.
Instead, ask one question: "What is the single most important decision someone needs to make after seeing this?" Every chart should help answer that question.
Stick to 5-7 Key Visuals: This rule of thumb forces you to prioritize what matters.
Use White Space Generously: It gives visuals room to breathe and guides the eye.
Remove "Chart Junk": Ditch unnecessary gridlines, distracting borders, or cheesy 3D effects. Clean and simple wins.
Establish a Clear Visual Hierarchy
Your eyes should be naturally drawn to the most important information first. This isn't magic; it's strong visual hierarchy.
Think of it like a newspaper. The massive headline grabs your attention first, followed by the subheading. You can create the same intuitive flow on your dashboard.
Place your most critical KPI in the top-left corner. This is where most Western readers' eyes land first. As you move down and to the right, present more granular, supporting details.
This structure tells a logical story, guiding the user from the main takeaway to the underlying data. Without it, you leave your users wandering aimlessly.
From Manual Builds to Instant Answers
Building a useful dashboard used to be a long, painful slog of complex SQL queries and endless revision cycles. Frankly, that old way is too slow for modern business. The new way is conversational. With a Conversational AI Data Analyst like Statspresso, you just ask for what you need.
It's night and day.
Dashboard Creation: The Old Way vs. The New Way
Process Step | The Old Way (Manual SQL) | The New Way (Statspresso) |
|---|---|---|
Initial Request | Submit a detailed ticket to the data team. | Ask a question in plain English. |
Development Time | Weeks or months of coding and revisions. | Seconds. |
Required Skill | Deep knowledge of SQL and BI software. | The ability to ask a question. |
Flexibility | Static. A new question requires a new build. | Dynamic. Ask endless follow-up questions. |
Outcome | A rigid dashboard that's quickly outdated. | An instant chart and a clear answer. |
This shift moves the power of data analysis from a few specialists to everyone. You can skip the SQL, just ask your data a question and get a chart in seconds. This isn't just convenience; it's a competitive advantage.
Try asking Statspresso: 'Compare revenue from new vs. returning customers last quarter and show it as a stacked bar chart.'
Common Dashboard Mistakes and How to Avoid Them
Even with the best intentions, it's shockingly easy to build a data visualization dashboard that nobody uses. These are design failures, not technical ones. But the good news is, they're completely avoidable.
Mistake 1: The Kitchen Sink Dashboard
This is the number one offender. Fearing they'll leave something out, creators throw every possible metric onto a single screen. The result is a chaotic mess that overwhelms anyone looking at it.
The Fix: Be ruthless. Before adding any element, ask: "Does this directly help answer the main question?" If the answer is no, leave it out. A great dashboard has a strong point of view.
Mistake 2: Using Misleading Visualizations
Choosing the wrong chart can do more harm than good. A 3D pie chart, for example, looks fancy but distorts proportions, actively misleading the viewer.
The Fix: Let the data choose the chart.
For comparisons: Use bar charts. They are simple and clear.
For trends over time: Line charts are your best friend.
For parts of a whole: Use a stacked bar chart or a simple table. And please, avoid pie charts unless you have fewer than four categories.
Modern GenBI platforms like Statspresso, your Conversational AI Data Analyst, can suggest the right chart type automatically.
Try asking Statspresso: 'What were my top 5 selling products last quarter? Show me as a table.'
Mistake 3: Failing to Define Clear KPIs
A dashboard without clear Key Performance Indicators (KPIs) is like a road trip without a destination. You’re moving, but you don't know if you're going in the right direction.
The Fix: Start with your objectives, not your data. What business outcome are you trying to achieve? Work backward from there to pinpoint the few metrics that truly measure progress. Make these KPIs the heroes of your dashboard—big, bold, and impossible to miss.
The push for better, faster insights is undeniable. According to Market Research Future, the data visualization tool market is set to balloon from $30.36 billion in 2024 to $73.83 billion by 2035. This growth is fueled by teams demanding self-serve analytics.
Move from Static Reports to Conversational Insights
If you remember just one thing, let it be this: the future isn't about building more complex dashboards. It’s about closing the gap between a question and its answer.
The old way—waiting in line for the data team, battling clunky BI tools, and staring at charts that don't answer your real question—is broken. Your team has questions now, and they need answers that move as fast as your business. Instead of passively looking at reports, your team can start having a real conversation with your data.
The Power of Asking a Simple Question
Imagine your product manager needs to dig into user retention. Instead of applying a dozen filters to a rigid dashboard, what if they could just ask?
Try asking Statspresso: “What is our 30-day user retention rate for customers who signed up in Q2, broken down by acquisition channel?”
That’s all it takes. No SQL queries, no support tickets, no waiting. This is the magic of a Conversational AI Data Analyst. It gives everyone access to powerful insights. Your data stops being a locked resource and becomes a collaborative partner. Learn more about how you can chat with your data using AI.
TL;DR Key Takeaways
For the busy founder who needs the highlights, here’s what matters most:
Focus on Decisions, Not Data: A dashboard’s worth is measured by how quickly it helps you make better decisions. If it doesn’t lead to action, it’s just wallpaper.
One Dashboard, One Job: Tailor the dashboard type (Strategic, Operational, Analytical, or Tactical) to its audience. A one-size-fits-all dashboard fits no one.
Clarity Over Clutter: The best dashboards are scannable in seconds. Use a clear visual hierarchy and be ruthless about cutting any chart that doesn’t serve the main goal.
The Future is Conversational: Move past static reports. Tools like Statspresso let you Skip the SQL. Just ask your data a question and get a chart in seconds.
Ready to stop waiting and start asking?
Connect your first data source for free and ask your first question.
Frequently Asked Questions
You've got questions about data visualization dashboards. We've got straight answers.
What Is the Main Goal of a Data Visualization Dashboard?
The goal is to help you make faster, smarter decisions. A great dashboard gives you a crystal-clear, at-a-glance understanding of what's happening so you know exactly what to do next. It's the cockpit of your business, showing only the critical information needed to get to your destination.
How Do I Choose the Right Metrics for My Dashboard?
Stop looking at the data you have and start with the questions you need to answer. What are your most important business objectives? Work backward from there to pinpoint the Key Performance Indicators (KPIs) that truly measure your progress. Everything else is just noise.
TL;DR: If a metric doesn't directly inform a decision or track a critical goal, it has no place on your dashboard.
What Makes a Dashboard "Good" vs "Bad"?
It boils down to clarity and action.
A good dashboard is focused and scannable. It tells a coherent story in seconds and prompts the question, "So, what's our next move?"
A bad dashboard is a cluttered "data-dump." It’s overwhelming and leaves you with more questions than answers. It's a report, not a decision-making tool.
What Is the Difference Between Traditional BI and a Conversational AI Data Analyst?
It’s the difference between a printed map and a live GPS that talks to you.
Traditional BI tools like Tableau or Power BI depend on specialists who spend weeks writing SQL and building rigid dashboards. If you have a follow-up question, you go to the back of the line.
A Conversational AI Data Analyst like Statspresso changes the game. You connect your data and just ask questions in plain English. No SQL, no waiting. You get an answer to a complex question in seconds, not weeks, putting the power of data into everyone's hands.
Ready to stop staring at confusing charts and start a conversation with your data? Statspresso is the conversational AI data analyst that gives you answers in seconds.
Connect your first data source for free and ask your first question.