Data Analytics for Small Businesses (2026)

Waiting weeks for a data analyst to build a dashboard is a relic of the past. You're juggling a million things, and even though you have valuable data in Shopify, HubSpot, and Stripe, learning SQL is the last thing on your to-do list. The problem isn't a lack of data; it's the lack of time to make sense of it. This guide shows you how to get answers in seconds, not sprints.
TL;DR: Key Takeaways
Your Data Is an Asset: Stop letting valuable information gather dust. Use it to make confident, profitable decisions.
Start with One Question: Avoid analysis paralysis. Pick one critical business question and find the answer. Momentum beats perfection.
Focus on Real Metrics: Track numbers that directly impact your bottom line, like Customer Acquisition Cost (CAC) and Lifetime Value (LTV), not vanity metrics.
The New Way is Asking: Skip the SQL. Just ask your data a question and get a chart in seconds with a conversational AI data analyst like Statspresso.
Why Your Data Is a Goldmine (If You Can Get to It)
Right now, you’re probably running on experience and intuition. That's essential. But what if you could back up that gut feeling with hard numbers? Imagine knowing for sure which marketing campaign brought in your most profitable customers or which product feature is a ghost town.
This is where your business data flips from a messy spreadsheet into your most valuable asset.
The old model of waiting for a consultant to build a clunky dashboard is broken. It's slow, expensive, and by the time you get the report, the moment to act is gone.
The Shift from Manual Reports to Instant Answers
Thankfully, that’s all changing. Modern tools, especially a Conversational AI Data Analyst like Statspresso, finally make data analytics for small businesses accessible. The idea is simple: you shouldn't need a technical degree to get answers from your own data. This isn't about becoming a data scientist; it's about making smarter, faster decisions.
The Old Way (Manual SQL) | The New Way (Statspresso) |
|---|---|
Email a request for a sales report, wait 3 days. | Ask, "What were our total sales last month by product?" |
Export data, build pivot tables, hope for an insight. | Ask, "Why did our user signups dip last week?" |
Take a screenshot, paste it into a slide deck. | Get a shareable chart and a plain-English summary. |
This evolution means you can finally stop guessing and start knowing. It's a direct path to answers, not another layer of complexity. For a small business, this is a game-changer. It lets you operate with the same strategic insight as your larger competitors.
Try asking Statspresso: “Show me my revenue by month for the last year as a bar chart.”
Decoding Analytics Without The Jargon
Let's cut through the noise. Data analytics for small businesses sounds way more complicated than it is. Forget the textbook definitions; think of it like a chef tasting a sauce. You’re just sampling the ingredients (your data) to perfect the final dish (your business strategy).
You don't need a Ph.D. in statistics. You just need curiosity.
The Four Flavors of Data Analytics
Analytics generally comes in four flavors, moving you from hindsight to foresight.
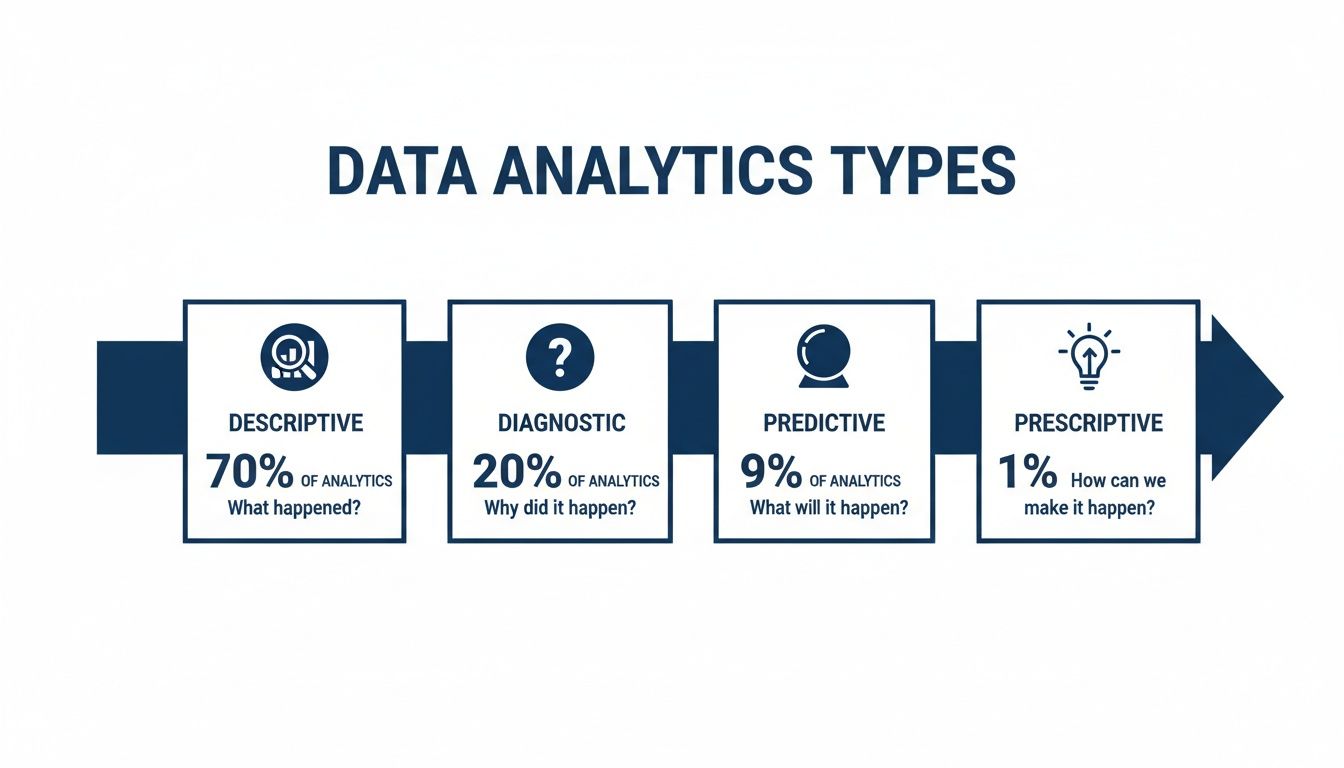
Descriptive (What happened?): This is your basic scorecard. “What were our total sales last month?” It summarizes the past into something you can understand.
Diagnostic (Why did it happen?): Now we play detective. If sales dipped, you ask, “Why did sales dip? Did a competitor run a huge sale, or was our website down?”
Predictive (What is likely to happen?): This is your business weather forecast. “Which customers are most likely to churn in the next 90 days?” It lets you get ahead of problems.
Prescriptive (What should we do?): This is the final step. It doesn't just predict; it recommends an action. “What specific discount should we offer this group to keep them?”
Skip The How, Just Ask The What
Here’s the best part: you don't need to know how to perform these calculations. A Conversational AI Data Analyst like Statspresso handles the heavy lifting. Your only job is to ask the right questions. Skip the SQL. Just ask your data a question and get a chart in seconds.
Try asking Statspresso: “Show me my top 5 customers by revenue last quarter and tell me what they bought.”
The Real ROI: How Data Drives Your Bottom Line
Let's talk about what really matters: money. Bringing data analytics into your small business isn't about collecting digital trivia. It’s a direct investment in your profitability. What if you could confidently stop spending on marketing that doesn't work? Or know you could raise prices without losing customers?
Getting these results is more accessible than ever. The big data analytics market is projected to hit USD 745.15 billion by 2030, and that growth is fueled by small businesses. According to one study, 80% of small businesses using analytics report sharper decision-making. This isn't just for corporations anymore. You can find more details on big data adoption rates and their impact.
From Hindsight to Profit
Refined Marketing Spend: Pinpoint the exact channels bringing in your most valuable customers. Double down on what works, cut the rest.
Optimized Product Pricing: Analyze sales data to find the pricing sweet spot that maximizes revenue.
Reduced Customer Churn: Spot early warning signs of unhappy customers, allowing you to step in and keep their business.
Eliminated Operational Waste: Find hidden inefficiencies in your inventory or workflows that are draining your bank account.
The real ROI isn't just in the answers you get; it's in the speed.
The Old Way (Manual SQL) | The New Way (Statspresso) |
|---|---|
Export data, build a complex VLOOKUP to find LTV. (ETA: 4-6 hours) | Ask: "What's the LTV of customers from Q1?" (ETA: 10 seconds) |
Manually combine ad spend with sales reports for ROI. (ETA: 1-2 days) | Ask: "Show me the ROI for our latest Google Ads campaign." (ETA: 15 seconds) |
Request a custom "top customers" report from an analyst. (ETA: 1 week) | Ask: "Who were my top 10 customers by revenue last year?" (ETA: 5 seconds) |
This isn't a small improvement—it's a massive shift. Skip the SQL. Just ask your data a question and get a chart in seconds. This immediate access turns your data from a historical record into a real-time strategic tool.
Try asking Statspresso: “Compare my monthly recurring revenue (MRR) growth over the last six months.”
Your First Data Project In Three Simple Steps
The biggest hurdle in analytics isn't complexity—it's getting started. Forget "analysis paralysis." The secret is to build momentum with a quick win. This playbook gets you from zero to your first insight in minutes, not months.
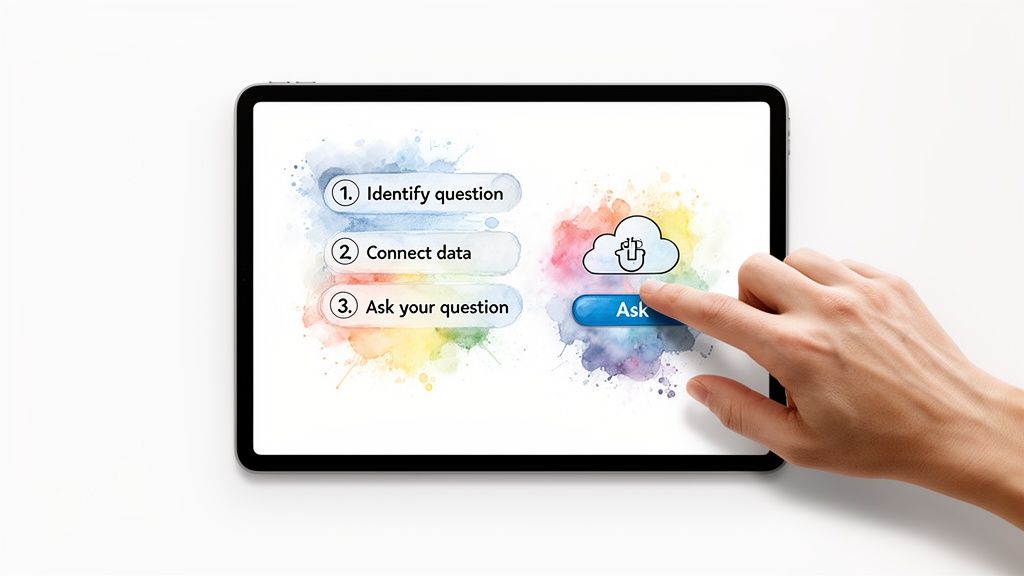
Step 1: Identify One Critical Business Question
Forget building a massive dashboard. Your only goal is to answer one specific, high-impact question. This focus is your superpower.
Here are a few solid starting points:
E-commerce: "What are my top 5 selling products this quarter?"
SaaS: "How many new users signed up last month, and where did they come from?"
Marketing: "Which ad campaign had the best ROI in the last 30 days?"
Pick one. Write it down. This simple act is half the battle.
Step 2: Securely Connect Your Primary Data Source
Now you need the data. This used to be the hard part. These days, it’s often a one-click process.
A Conversational AI Data Analyst like Statspresso connects directly to the tools you already use, like Shopify, Stripe, HubSpot, or Google Analytics. There’s no need to export messy CSVs. You just authorize the connection, and it does the rest. It's like linking your Spotify account to a smart speaker.
Step 3: Ask Your Question In Plain English
This is where the magic happens. No code. No new query language. Just ask the question you wrote down in step one.
Skip the SQL. Just ask your data a question and get a chart in seconds.
A Conversational AI Data Analyst understands natural language. You type your question like you're chatting with a colleague, and it instantly translates it, finds the data, does the math, and visualizes the result.
Instead of digging through Shopify reports, you ask: "Show me my top 5 selling products by revenue for Q2."
Instead of building a HubSpot dashboard, you ask: "How many new contacts did we get from our blog versus paid ads last month?"
That's it. You just completed your first data project.
Try asking Statspresso: “Which marketing channel brought in the most new customers last month?”
Key Metrics Every Small Business Should Track
It's easy to get lost in a sea of data. The secret is to focus on the handful of metrics that actually move your business forward. Trying to watch everything at once is a surefire way to see nothing.
Marketing Metrics That Matter
Your marketing should make you money, period. These two metrics connect your ad spend to your bank account.
Customer Acquisition Cost (CAC): Your "cost per customer." It's everything you spent on marketing and sales, divided by the number of new customers you won.
Lifetime Value (LTV): The total money you can expect from a customer over their entire relationship with you. When your LTV is 3x your CAC, you have a healthy, scalable business.
Try asking Statspresso: “What is the average LTV of customers acquired from Google Ads versus Facebook?”
Sales Metrics That Drive Growth
These numbers reveal the health of your sales process.
Conversion Rate: The percentage of leads who actually buy or sign up. A low conversion rate can signal a problem with your pricing or pitch.
Average Deal Size: The average dollar value when you close a deal. Tracking this shows if you're landing bigger clients or if values are slipping.
Try asking Statspresso: “Show me our sales conversion rate by lead source for the last quarter as a bar chart.”
Operations Metrics for a Healthy Foundation
These KPIs are about customer loyalty and predictable income—the bedrock of a successful company.
Customer Churn Rate: The percentage of customers who stop doing business with you. High churn is like trying to fill a leaky bucket.
Monthly Recurring Revenue (MRR): For any subscription business, MRR is your lifeblood. It’s the predictable revenue you can count on each month.
Try asking Statspresso: “What was our customer churn rate last month, and how does it compare to the previous month?”
Common Data Pitfalls And How To Avoid Them
I’ve watched countless data projects go sideways. It’s rarely the tech that fails; it’s almost always one of these common mistakes.
Pitfall 1: Analysis Paralysis
You have data streaming in from everywhere, and the pressure is on to analyze all of it before making a move. This is a progress killer.
The Fix: Start with one specific, high-impact question. Don't try to boil the ocean. Create momentum.
Pitfall 2: Chasing Vanity Metrics
It feels great to see social media likes or traffic climb. But do those numbers put money in your bank? Vanity metrics look impressive but have no real connection to revenue or retention.
The Fix: Tie every metric directly to a business outcome. If you can’t draw a line from a metric to your bottom line, it’s a distraction.
Pitfall 3: Living With Data Silos
Your sales data is in HubSpot, payments are in Stripe, and product data is in a Postgres database. When your information is scattered, getting a complete picture is impossible.
The Old Way (Manual SQL) | The New Way (Statspresso) |
|---|---|
Export CSVs from 3 different tools. | Connect your sources with one click. |
Write complex SQL joins to connect tables. | Ask a single question across all sources. |
Get a static, outdated report. | Get a real-time answer in seconds. |
A Conversational AI Data Analyst like Statspresso unifies your data sources automatically. It turns siloed information into a single source of truth.
Try asking Statspresso: “Show me the revenue generated from our latest Instagram campaign compared to our email newsletter.”
Your First Answer Is Just Minutes Away
Let's cut right to the chase. Data analytics for small businesses is no longer a far-off dream tied to complex software or expensive data scientists. It’s about asking good questions and getting clear answers, fast.
The old roadblocks—cost, complexity, time—are gone. According to a 2024 Forbes report, AI adoption in business is expected to grow by over 35% annually, with analytics being a primary driver. This isn't a trend; it's the new standard. Tools like Linear generate data, but a Conversational AI Data Analyst turns it into strategy.
The era of waiting is over. Waiting for a report, waiting for an analyst, waiting for the budget—that’s all in the rearview mirror. You can get answers right now. If you're curious, you can learn more about how to chat directly with your data.
Ready to stop guessing and start knowing?
Connect your first data source for free with Statspresso and ask your first question. See for yourself how you can go from confusion to clarity in the next five minutes.
Waiting weeks for a data analyst to build a dashboard is a relic of the past. You're juggling a million things, and even though you have valuable data in Shopify, HubSpot, and Stripe, learning SQL is the last thing on your to-do list. The problem isn't a lack of data; it's the lack of time to make sense of it. This guide shows you how to get answers in seconds, not sprints.
TL;DR: Key Takeaways
Your Data Is an Asset: Stop letting valuable information gather dust. Use it to make confident, profitable decisions.
Start with One Question: Avoid analysis paralysis. Pick one critical business question and find the answer. Momentum beats perfection.
Focus on Real Metrics: Track numbers that directly impact your bottom line, like Customer Acquisition Cost (CAC) and Lifetime Value (LTV), not vanity metrics.
The New Way is Asking: Skip the SQL. Just ask your data a question and get a chart in seconds with a conversational AI data analyst like Statspresso.
Why Your Data Is a Goldmine (If You Can Get to It)
Right now, you’re probably running on experience and intuition. That's essential. But what if you could back up that gut feeling with hard numbers? Imagine knowing for sure which marketing campaign brought in your most profitable customers or which product feature is a ghost town.
This is where your business data flips from a messy spreadsheet into your most valuable asset.
The old model of waiting for a consultant to build a clunky dashboard is broken. It's slow, expensive, and by the time you get the report, the moment to act is gone.
The Shift from Manual Reports to Instant Answers
Thankfully, that’s all changing. Modern tools, especially a Conversational AI Data Analyst like Statspresso, finally make data analytics for small businesses accessible. The idea is simple: you shouldn't need a technical degree to get answers from your own data. This isn't about becoming a data scientist; it's about making smarter, faster decisions.
The Old Way (Manual SQL) | The New Way (Statspresso) |
|---|---|
Email a request for a sales report, wait 3 days. | Ask, "What were our total sales last month by product?" |
Export data, build pivot tables, hope for an insight. | Ask, "Why did our user signups dip last week?" |
Take a screenshot, paste it into a slide deck. | Get a shareable chart and a plain-English summary. |
This evolution means you can finally stop guessing and start knowing. It's a direct path to answers, not another layer of complexity. For a small business, this is a game-changer. It lets you operate with the same strategic insight as your larger competitors.
Try asking Statspresso: “Show me my revenue by month for the last year as a bar chart.”
Decoding Analytics Without The Jargon
Let's cut through the noise. Data analytics for small businesses sounds way more complicated than it is. Forget the textbook definitions; think of it like a chef tasting a sauce. You’re just sampling the ingredients (your data) to perfect the final dish (your business strategy).
You don't need a Ph.D. in statistics. You just need curiosity.
The Four Flavors of Data Analytics
Analytics generally comes in four flavors, moving you from hindsight to foresight.
Descriptive (What happened?): This is your basic scorecard. “What were our total sales last month?” It summarizes the past into something you can understand.
Diagnostic (Why did it happen?): Now we play detective. If sales dipped, you ask, “Why did sales dip? Did a competitor run a huge sale, or was our website down?”
Predictive (What is likely to happen?): This is your business weather forecast. “Which customers are most likely to churn in the next 90 days?” It lets you get ahead of problems.
Prescriptive (What should we do?): This is the final step. It doesn't just predict; it recommends an action. “What specific discount should we offer this group to keep them?”
Skip The How, Just Ask The What
Here’s the best part: you don't need to know how to perform these calculations. A Conversational AI Data Analyst like Statspresso handles the heavy lifting. Your only job is to ask the right questions. Skip the SQL. Just ask your data a question and get a chart in seconds.
Try asking Statspresso: “Show me my top 5 customers by revenue last quarter and tell me what they bought.”
The Real ROI: How Data Drives Your Bottom Line
Let's talk about what really matters: money. Bringing data analytics into your small business isn't about collecting digital trivia. It’s a direct investment in your profitability. What if you could confidently stop spending on marketing that doesn't work? Or know you could raise prices without losing customers?
Getting these results is more accessible than ever. The big data analytics market is projected to hit USD 745.15 billion by 2030, and that growth is fueled by small businesses. According to one study, 80% of small businesses using analytics report sharper decision-making. This isn't just for corporations anymore. You can find more details on big data adoption rates and their impact.
From Hindsight to Profit
Refined Marketing Spend: Pinpoint the exact channels bringing in your most valuable customers. Double down on what works, cut the rest.
Optimized Product Pricing: Analyze sales data to find the pricing sweet spot that maximizes revenue.
Reduced Customer Churn: Spot early warning signs of unhappy customers, allowing you to step in and keep their business.
Eliminated Operational Waste: Find hidden inefficiencies in your inventory or workflows that are draining your bank account.
The real ROI isn't just in the answers you get; it's in the speed.
The Old Way (Manual SQL) | The New Way (Statspresso) |
|---|---|
Export data, build a complex VLOOKUP to find LTV. (ETA: 4-6 hours) | Ask: "What's the LTV of customers from Q1?" (ETA: 10 seconds) |
Manually combine ad spend with sales reports for ROI. (ETA: 1-2 days) | Ask: "Show me the ROI for our latest Google Ads campaign." (ETA: 15 seconds) |
Request a custom "top customers" report from an analyst. (ETA: 1 week) | Ask: "Who were my top 10 customers by revenue last year?" (ETA: 5 seconds) |
This isn't a small improvement—it's a massive shift. Skip the SQL. Just ask your data a question and get a chart in seconds. This immediate access turns your data from a historical record into a real-time strategic tool.
Try asking Statspresso: “Compare my monthly recurring revenue (MRR) growth over the last six months.”
Your First Data Project In Three Simple Steps
The biggest hurdle in analytics isn't complexity—it's getting started. Forget "analysis paralysis." The secret is to build momentum with a quick win. This playbook gets you from zero to your first insight in minutes, not months.
Step 1: Identify One Critical Business Question
Forget building a massive dashboard. Your only goal is to answer one specific, high-impact question. This focus is your superpower.
Here are a few solid starting points:
E-commerce: "What are my top 5 selling products this quarter?"
SaaS: "How many new users signed up last month, and where did they come from?"
Marketing: "Which ad campaign had the best ROI in the last 30 days?"
Pick one. Write it down. This simple act is half the battle.
Step 2: Securely Connect Your Primary Data Source
Now you need the data. This used to be the hard part. These days, it’s often a one-click process.
A Conversational AI Data Analyst like Statspresso connects directly to the tools you already use, like Shopify, Stripe, HubSpot, or Google Analytics. There’s no need to export messy CSVs. You just authorize the connection, and it does the rest. It's like linking your Spotify account to a smart speaker.
Step 3: Ask Your Question In Plain English
This is where the magic happens. No code. No new query language. Just ask the question you wrote down in step one.
Skip the SQL. Just ask your data a question and get a chart in seconds.
A Conversational AI Data Analyst understands natural language. You type your question like you're chatting with a colleague, and it instantly translates it, finds the data, does the math, and visualizes the result.
Instead of digging through Shopify reports, you ask: "Show me my top 5 selling products by revenue for Q2."
Instead of building a HubSpot dashboard, you ask: "How many new contacts did we get from our blog versus paid ads last month?"
That's it. You just completed your first data project.
Try asking Statspresso: “Which marketing channel brought in the most new customers last month?”
Key Metrics Every Small Business Should Track
It's easy to get lost in a sea of data. The secret is to focus on the handful of metrics that actually move your business forward. Trying to watch everything at once is a surefire way to see nothing.
Marketing Metrics That Matter
Your marketing should make you money, period. These two metrics connect your ad spend to your bank account.
Customer Acquisition Cost (CAC): Your "cost per customer." It's everything you spent on marketing and sales, divided by the number of new customers you won.
Lifetime Value (LTV): The total money you can expect from a customer over their entire relationship with you. When your LTV is 3x your CAC, you have a healthy, scalable business.
Try asking Statspresso: “What is the average LTV of customers acquired from Google Ads versus Facebook?”
Sales Metrics That Drive Growth
These numbers reveal the health of your sales process.
Conversion Rate: The percentage of leads who actually buy or sign up. A low conversion rate can signal a problem with your pricing or pitch.
Average Deal Size: The average dollar value when you close a deal. Tracking this shows if you're landing bigger clients or if values are slipping.
Try asking Statspresso: “Show me our sales conversion rate by lead source for the last quarter as a bar chart.”
Operations Metrics for a Healthy Foundation
These KPIs are about customer loyalty and predictable income—the bedrock of a successful company.
Customer Churn Rate: The percentage of customers who stop doing business with you. High churn is like trying to fill a leaky bucket.
Monthly Recurring Revenue (MRR): For any subscription business, MRR is your lifeblood. It’s the predictable revenue you can count on each month.
Try asking Statspresso: “What was our customer churn rate last month, and how does it compare to the previous month?”
Common Data Pitfalls And How To Avoid Them
I’ve watched countless data projects go sideways. It’s rarely the tech that fails; it’s almost always one of these common mistakes.
Pitfall 1: Analysis Paralysis
You have data streaming in from everywhere, and the pressure is on to analyze all of it before making a move. This is a progress killer.
The Fix: Start with one specific, high-impact question. Don't try to boil the ocean. Create momentum.
Pitfall 2: Chasing Vanity Metrics
It feels great to see social media likes or traffic climb. But do those numbers put money in your bank? Vanity metrics look impressive but have no real connection to revenue or retention.
The Fix: Tie every metric directly to a business outcome. If you can’t draw a line from a metric to your bottom line, it’s a distraction.
Pitfall 3: Living With Data Silos
Your sales data is in HubSpot, payments are in Stripe, and product data is in a Postgres database. When your information is scattered, getting a complete picture is impossible.
The Old Way (Manual SQL) | The New Way (Statspresso) |
|---|---|
Export CSVs from 3 different tools. | Connect your sources with one click. |
Write complex SQL joins to connect tables. | Ask a single question across all sources. |
Get a static, outdated report. | Get a real-time answer in seconds. |
A Conversational AI Data Analyst like Statspresso unifies your data sources automatically. It turns siloed information into a single source of truth.
Try asking Statspresso: “Show me the revenue generated from our latest Instagram campaign compared to our email newsletter.”
Your First Answer Is Just Minutes Away
Let's cut right to the chase. Data analytics for small businesses is no longer a far-off dream tied to complex software or expensive data scientists. It’s about asking good questions and getting clear answers, fast.
The old roadblocks—cost, complexity, time—are gone. According to a 2024 Forbes report, AI adoption in business is expected to grow by over 35% annually, with analytics being a primary driver. This isn't a trend; it's the new standard. Tools like Linear generate data, but a Conversational AI Data Analyst turns it into strategy.
The era of waiting is over. Waiting for a report, waiting for an analyst, waiting for the budget—that’s all in the rearview mirror. You can get answers right now. If you're curious, you can learn more about how to chat directly with your data.
Ready to stop guessing and start knowing?
Connect your first data source for free with Statspresso and ask your first question. See for yourself how you can go from confusion to clarity in the next five minutes.